Aims
- To be able to understand inductive reactance, capacitive reactance, and resonant circuits.
- To be able to utilize an oscilloscope and function generator for testing and measurement of circuits.
- To analyze the frequency response of R-L and R-C circuit networks.
- To investigate the effects that frequency has on R-L-C components.
- To observe the current and voltage waveforms and analyze the effect of L and C on such waveforms.
- To assess the characteristics of a series resonant circuit.
Introduction
When a circuit is made up of resistors only, it is said to be purely resistive. However, the presence of reactive elements like capacitors and inductors brings about the term impedance, Z. Frequency has an effect on circuits that contain storage elements. The reason why frequency effects such circuits is because the reactance expressions contain frequency as one of their components. This report investigates how frequency affects R-L-C circuits.
Theoretical background
Impedance, Z, is generally described as the voltage to current ratio. This ratio is taken to be an analog of resistance. In the case of reactive elements (that is, inductors and capacitors), the term reactance is used instead of resistance. Thus, the capacitor introduces what is known as capacitive reactance, XC, while inductor inductive reactance, XL (All ABout Circuits, 2015).
When a circuit is purely resistive, frequency has no influence as resistance is independent of the frequency component. On the other hand, circuits with reactive components are influenced by frequency. Equations (1), (2), and (3) below illustrate this concept.


Where: C is the capacitance (F), L is inductance (H), R is resistance (Ω), and f is the frequency (Hz) of the oscillating power supply.
Another interesting feature of these circuits is resonance. This is a scenario where a given system oscillates with higher amplitude at some specific frequencies (known as resonance frequencies) than at others. At such points, XL = XC and input current and voltage are in phase. Since XL = XC, the circuit is purely resistive (Harlow, 2004). Resonance frequency, fr, is given by:

There is another vital parameter known as the Q-factor (which is a measure of quality of the resonator) that influences the selectivity of the circuit.

According to equation (2), there is a linear relationship between frequency, f, and inductance, L. Any change in the frequency of the power supply will directly affect the inductive reactance of the circuit. If the supply is DC, XL represents a short circuit while very high frequencies correspond to extremely high XL hence representing an open-circuit. According to equation (3), frequency relates inversely with C. The behaviour of the capacitor is directly opposite to that of an inductor. However, capacitive reactance is nonlinearly dependent on frequency.
Laboratory work
Equipment and components
- Circuit boards
- Oscilloscope with 2 probes
- Multi-meters
- Signal generator
- Inductor (2.2mH), capacitor (44μF), resistor (Ω)
- Connecting wires.
Precaution: The power supply was kept in off position during all connections.
Procedure and circuit diagrams
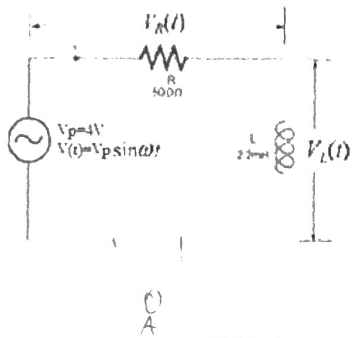
The circuit and input voltage was connected as in figure 1 below, frequency was altered step-wise, and results were recorded as in table 1 below;
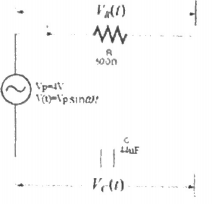
The circuit was connected as in figure 2 below. Part b in (1) above was repeated and results recorded as in figure 1 above.
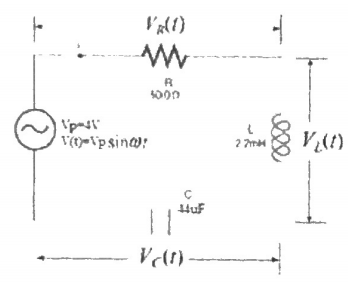
The circuit was then connected as in figure 3 below; frequency varied as in table 2 and results recorded in the same table.
Discussion
Questions
In case there are such values for resistor and capacitor as 500Ω and 44μF respectively, the empirical decision to make is to use components whose standard ratings are very close to the required ones. For the above case, 5100Ω and 47uF will be preferred.
- Using equation (4);


Since XL= XC at resonance, then Z=R=500Ω.
Hence:


OR 5.656mA
VR, VL, I and Z determination at 200Hz using figure 1.
First,


And


Thus:


VS = 8 × 0.3535 = 2.828V


The above computed figures are not the same as the measured ones. The experimental error accounts to such deviation. Some of them include, ageing components, inherent errors of the components, systematic errors, and the parallax errors that occur during the reading of the instruments.
VR, VL, VC, I and Z at 200Hz in figure 3:


= 500.23 Ω


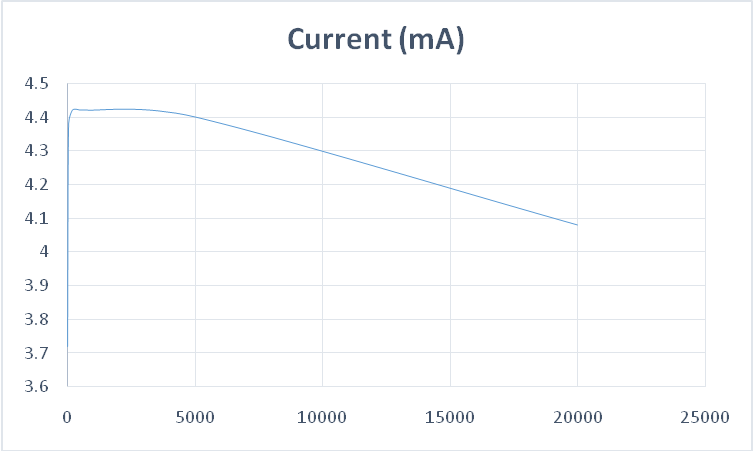
The graph of frequency versus current
Or
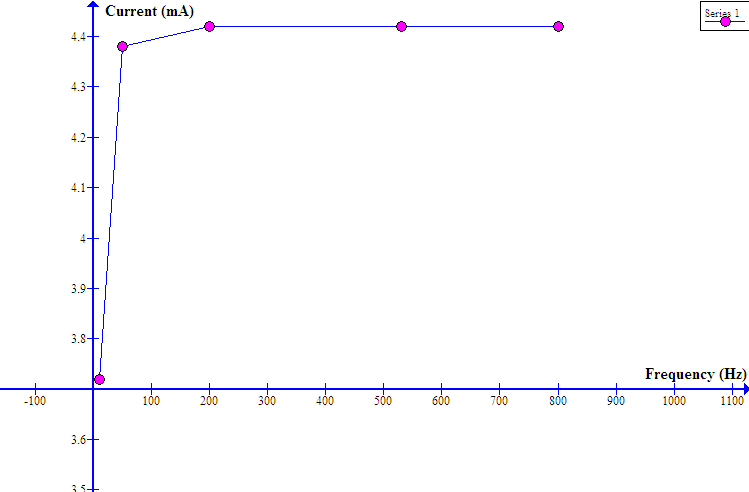
From the graph, an increase in frequency results to a sharp increase in current up to a point (undoubtedly the resonance point) where the trend reverses. An increase in frequency leads to a decline in current. The nature of such a trend is as outlined under the theoretical outline.
References
All ABout Circuits. (2015). All About Circuits. Web.
Harlow, J. H. (2004). Electric Power Transformer Engineering. Boca Raton, FL: CRC Press.