Introduction
The discovery of Nafion in the 1960s by DuPont served to set the stage for the commencement of themanufacture of unique artificial polymers that exhibit ionic properties. Nafion was developed from a copolymerization reaction pitting tetrafluroethylene (TFE) and sulfonic acid (SO3– H+) that was attached to a vinyl ether backbone. With these properties, Nafion is referred to as an ionomer i.e. it is ionic in nature and can conduct ionic compounds. Its structure is as shown in the figure below:
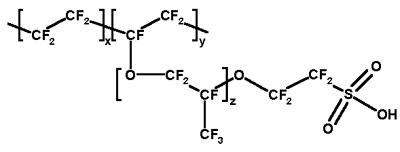
Nafion is an important compound that finds application in protein exchange membrane (PEM), serving as a cation conductor. Nafion is an excellent candidate vis-à-vis other alternative components for this application since it exhibits exceptional mechanical and thermal stability. Another area that Nafion (resin) has excelled is in the esterification process where it acts as a catalyst. Its choice over other candidates like sulphuric acid is that it does not contaminate the final product, and doesn’t generate wastes by avoiding an ensuing neutralization process synonymous with conventional catalysts.II
In this article we focus our discussions on the synthesis, characterization and the structure-property-performance correlation of a porous Nafion resin nanocomposite. Finally, we will look at one commercial application of this compound as an ionomer.
Synthesis
Nafion resin is synthesized via a two-step acid/base hydrolysis process which is subsequently followed by a condensation process of alkoxysilane. Here, a 7.93-gram mass of tetraethylorthosilicate (TEOS), a 2-milliliter de-ionized H2O and half-milliliter of 5-Molar hydrochloric acid were mixed and stirred to give a clear product. A 2.5-milliliter solution of Nafion resin was then siphoned into the solution amid a stirring process. Later, to this solution, a 0.4-Molar sodium hydroxide solution was added gradually “until the mixture gelled to form a hard, solid mass that was slightly opaque.”III The resulting product was then subjected to a 2-day drying process inside an oven at a temperature of 95o C. This was then followed by a similar drying process but for a 24-hour period under a vacuum. The final product was then pounded into a fine powder, re-acidified inside a 40-milliliter hydrochloric acid (3.5 Molar) and subsequently washed using de-ionized H2O. This process was replicated 5 times, and later, subjected to a 24-hour period of vacuum-drying process at a temperature of 95o C. This final process resulted in the formation of the Nafion resin nanocomposite product. For the sake of the ensuing analyses, six products of Nafion resin were developed by varying the percentage compositions of both TEOS and Nafion resin solution. As such, Nafion resin “products with 5, 13, 20, 40 and 60% Nafion resin solution were developed.”III These products were denoted as NR/S-Xs, with X representing the degree of Nafion resin solution in the product.
Characterization
The characterization of the surface area (SA) of Nafion resin nanocomposites was accomplished by an adsorption-desorption method with the help of nitrogen gas at 77 K. Prior to this process, a preliminary process was done where the NR/S-X samples were subjected to a 24-hour drying process inside an oven and at a temperature of 95oC. This was necessary to drive away moisture from nanocomposite pores. The BET plot’s linear section was significant in exploring the SA of a localized region. The resulting NR/S-X samples were “observed by a Meiji optical microscope and scrutinized by an LEO 120 energy-filtered transmission electron microscope (EFTEM) operating an acceleration voltage of 120V.”III Importantly, for the sake of electron microscope characterization, a sample (1% by weight) was spread on alcohol (C2H5OH) solution. An aliquot from this solution “was then placed on a 400 mesh copper grid (carbon-coated) and later given time to evaporate at room temperature prior to observation.”III Moreover, a scanning electron microscope (SEM) came in handy with regard to surface inspection. Finally, a Perkin Elmer instrument was employed in the performance of Fourier Transform Infrared (FTIR) spectroscopy.
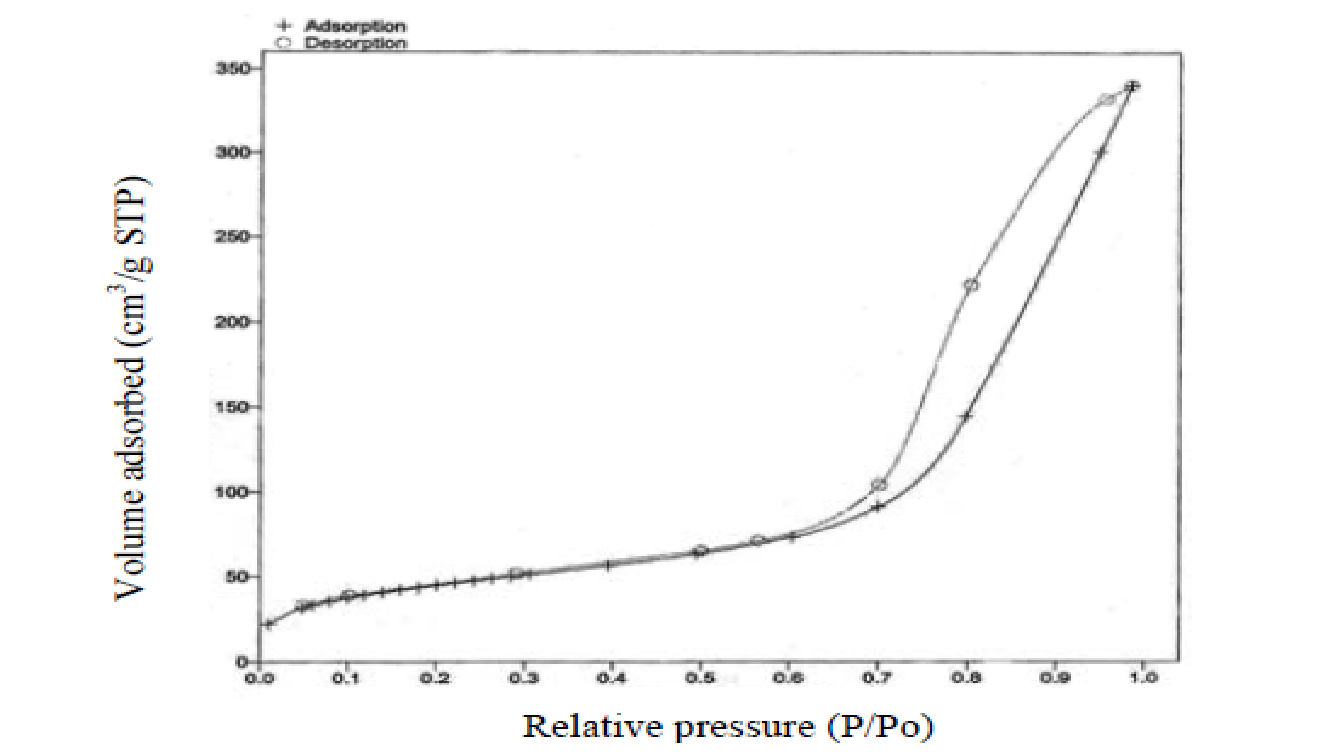
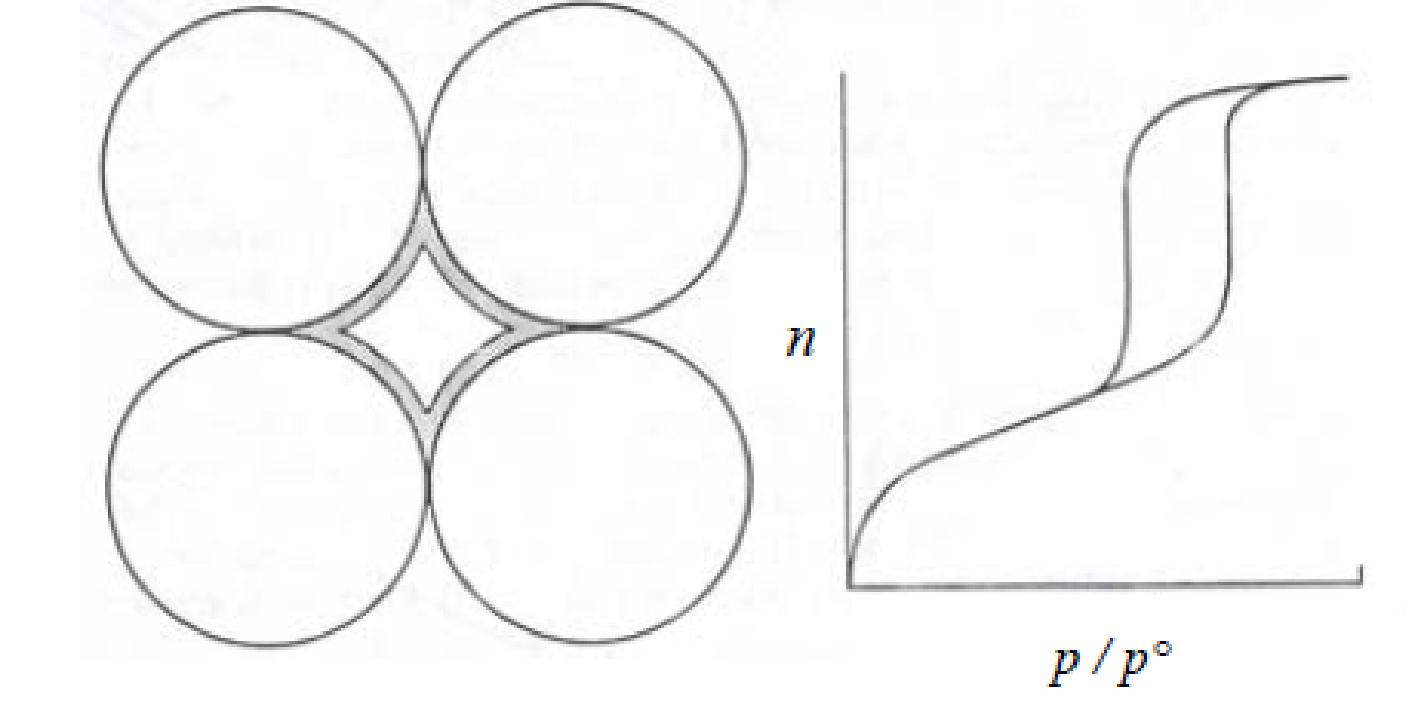
With respect to the adsorption-desorption characterization of the NR/S nanocomposite, the isotherm observed revealed a type IV isotherm (fig. 2). This type is synonymous with a mesoporous structure and is characterized by a hysteresis loop. From the isotherm, the structure of NR/S resin reveals a compact structure with spherical particles (fig. 3).
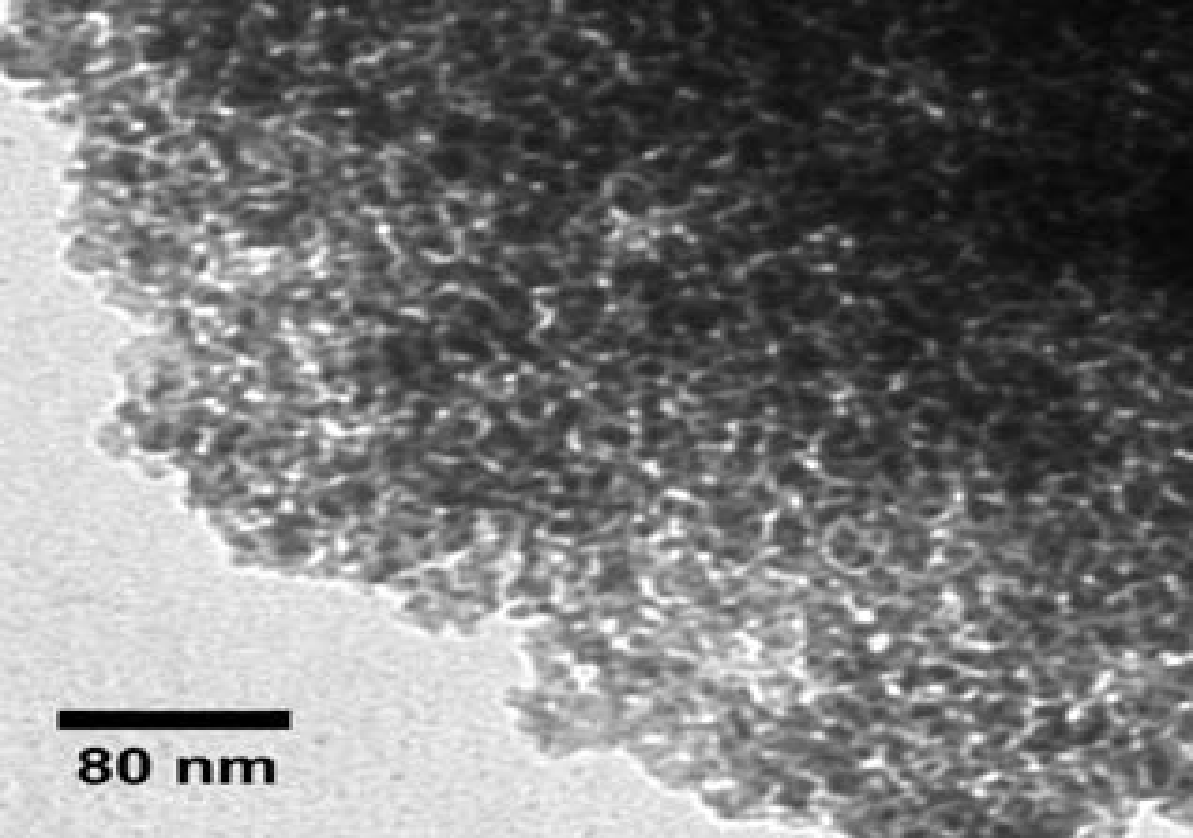
The BET observations revealed that the NR/S nanocomposite’s SA increases with an increase in Nafion resin concentration. Figure 4 represents a corresponding EFTEM image (micrograph) of NR/S-13 nanocomposite with an aperture diameter of approximately10 nm. This agrees with the surface area of NR/S-13 nanocomposite as recorded by BET (108 Ȧ).
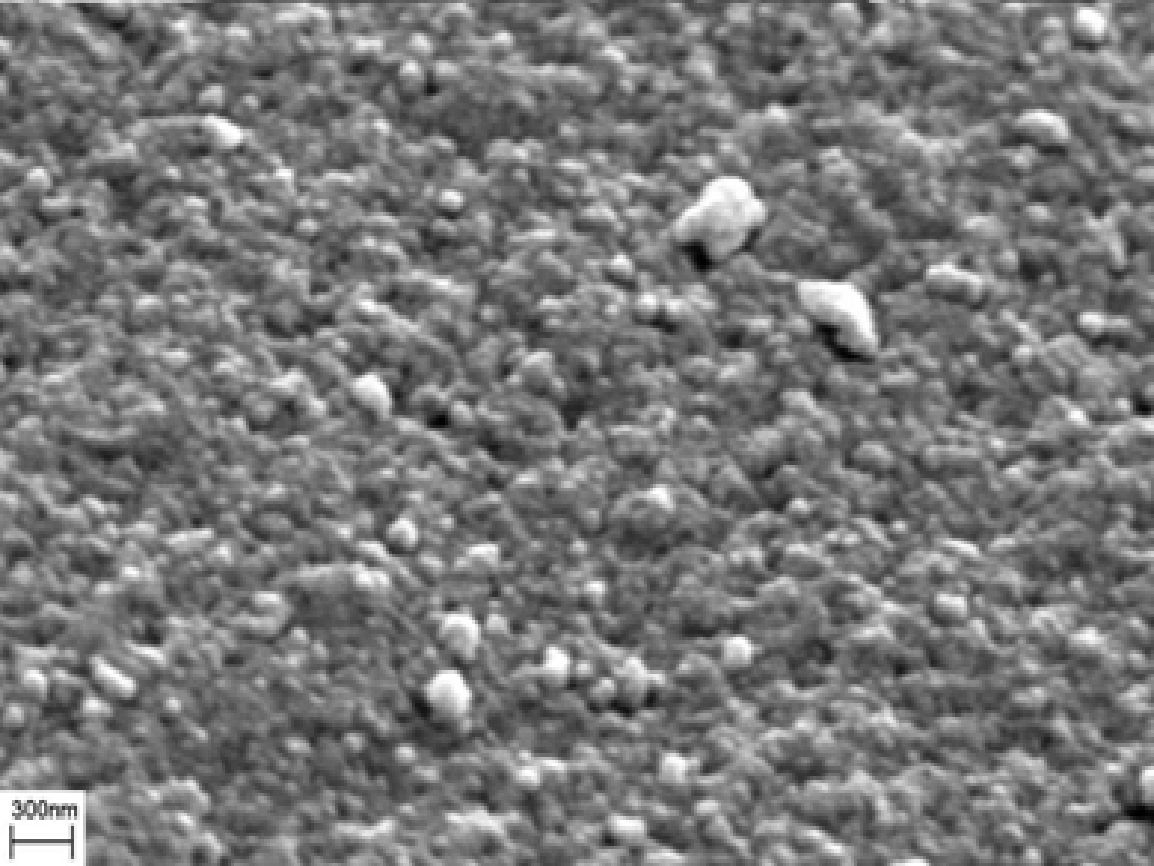
The figure below (5) depicts an SEM micrograph of NR/S-13. The micrograph image portrays that NR/S-13 microstructure is in form of particles. Elemental mapping “by SEM confirmed that the Nafion resin was well dispersed in the silica medium.”III
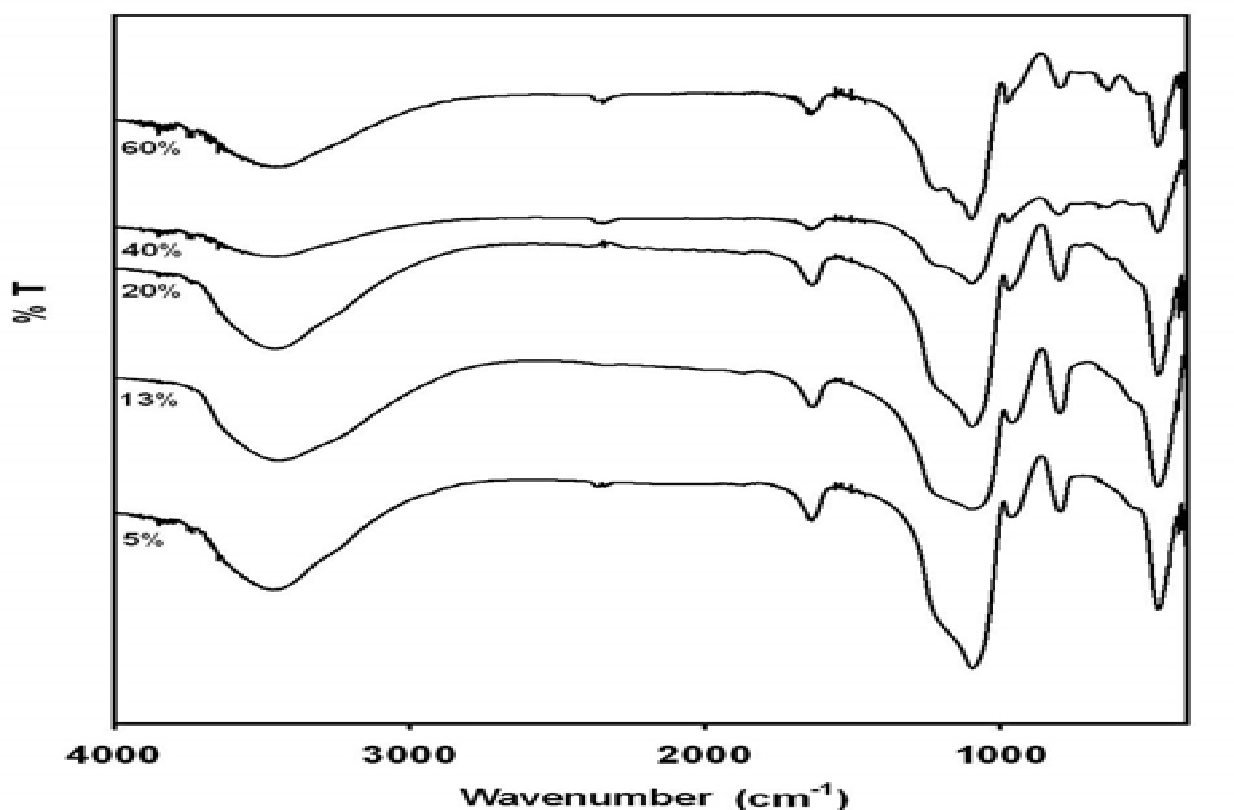
The figure below (6) shows the trends obtained by FTIR spectra of the samples at different Nafion solution concentrations. The trends exhibit similar peaks at “470, 800, 950, 1110, 1650 and 3400 cm–1.III The S-O stretch is typified by a trend that coincided with a peak at 1050 cm-1. Nonetheless, this was overlapped at 1110 cm-1 by a broad crest.
Structure-property-performance correlation
In this section, we analyze the effect of the molar ratio (R) of methanol-to-lauric acid on the performance of the NR/S nanocomposite. An analysis done on this property revealed that both the conversion rate of lauric acid and the affinity for methyl laurate increased with an increase in R. This behavior can plausibly be explained by the fact that methanol species were critical in the opening up of the resin matrix as well as availing the sulphonic compounds for esterification process.
Application NR/S nanocomposite
Nafion resin has long been used for its catalytic properties. Deutsche Texaco, a Dutch-based plant, has developed a novel process that explores a strong acid resin to help speed up reactions that enhance the direct hydration of olefins to their respective alcohols. As such, the conversion of isobutylene to its corresponding alcohol- t-butanol has long been commercialized. In Europe and Japan, resin-catalyst-based plants account for more than 100,000 tonnes of products produced per year. Contrary to the above application, ion-exchange resins find application in dehydration-based industries, which helps in the catalysis of a reverse reaction e.g. the conversion of t-butanol to isobutylene.
Conclusion
Nafion resin is an important ionomer vital in catalyzing esterification reactions. This product is synthesized via a complex method, yielding a material that is both mechanically and thermally stable. As such, it has found applications in catalyst-based commercial plants. However, the efficiency of the material is dependent on the concentrations of the reacting species.
References
A. Beer and T. Nijhius, Solid-acid Catalyst–General (University of Saskatchewan Press, Saskatchewan, 1997), pp. 116.
G. Olah, Acidity and Basicity of Solids (New York University Press, New York, 2008), pp. 305.
H. Lim and M. Yarmo, “Synthesis, Characterisation and Catalytic Performance of Porous Nafion Resin/Silica Nanocomposites for Esterification of Lauric Acid and Methanol,” Journal of Physical Science, 20 (2), 23–36 (2009).