Executive Summary
This report includes four tasks to study a firm’s risk profile, value, capital investments, and dividend policy. The first part focuses on the firm’s risk profile and asks students to compute its operating profit margin, operational leverage, WACC, and asset turnover and compare them to sector averages.
The second part focuses on the company’s value and needs students to identify the value drivers and determine the business’s intrinsic value using four firm value models. Moreover, the third part focuses on the firm’s dividend policy, requiring students to examine the policy and any changes in the trend and explain the theoretical background and consequences of the policy.
Apple’s Valuation Models
Firm’s Risk Profile Analysis
Sales Growth Rate

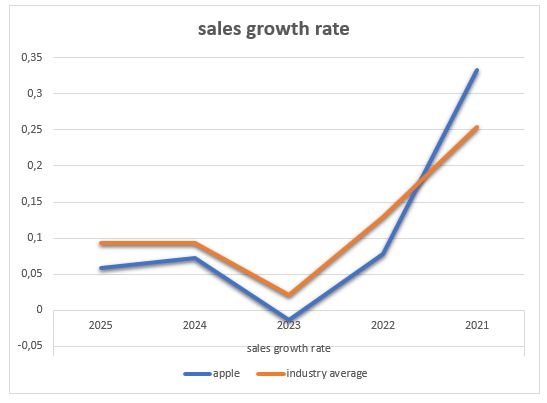
Apple’s revenue growth rate between 2021 and 2025 significantly surpasses the industry average. In 2021, 2022, 2024, and 2025, Apple’s revenue growth rates are 0.332594, 0.077938, 0.07181, and 0.058398, respectively, compared to the industry average of 0.253956, 0.128749, 0.020659, and 0.092566 as indicated in figure 1. Apple’s sales growth rate is less than the industry average in 2021, 2022, and 2024 but more significant than the industry average in 2025 (Financial Times, 2023).
Various underlying causes might explain why Apple’s sales growth rate is much higher than the industry average. Apple’s competitive landscape is the first factor to consider. Other technological companies like Samsung, Huawei, and Google compete fiercely with Apple. Apple competes with other technology companies by producing high-quality products, which causes Apple’s sales growth rate to increase.
The second issue to consider is Apple’s pricing approach. Apple’s products are more expensive than its competitors, which might result in slower sales growth than the industry average. Moreover, since Apple’s goods are sometimes seen as luxury items, they may not be as accessible to the general market as those from other technology manufacturers. As a result, sales growth rates may be lower than the industry average. Moreover, many consumers are becoming more frugal with purchasing, which may result in lower sales growth rates than the industry average.
Operating Profit Margin

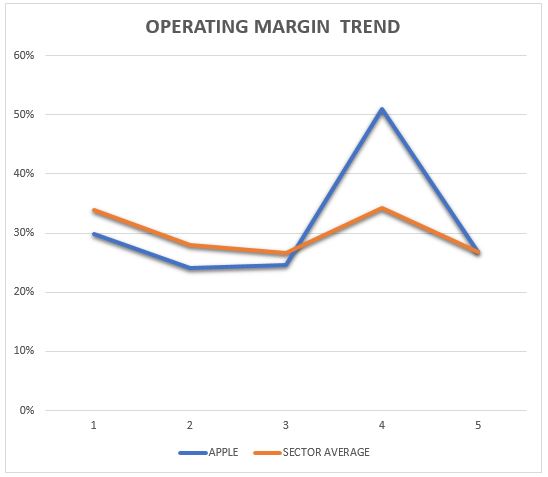
Table 1 shows that in 2021, Apple’s operating margin was much lower than the industry average. This is most likely due to a mix of reasons, such as greater competition, decreased demand for Apple goods, higher manufacturing costs, and saturation of the supply market. Moreover, Apple’s expenditure on research and development may have impacted its operating margin. In 2018, Apple’s operating margin was greater than the industry average, indicating the business had a profitable and successful year.
Firm’s Operating Leverage
Table 1: Firm’s Operating Leverage (Researcher, 2023).
Operational leverage measures how much variations in sales volume impact a company’s profitability. It is calculated using the following formula: percentage change in earnings divided by the percentage change in sales. A more considerable operational leverage suggests that a company’s earnings are more sensitive to changes in sales, meaning that an increase in sales is more probable.
Apple has an operational leverage of 5.66, and the industry average is 4.32; Apple is more sensitive to fluctuations in sales than the sector average, as shown in Table 2. This might be advantageous for Apple if the projected sales growth rate results in more significant earnings. If this is the case, Apple will gain more than the sector as a whole from the increase in sales. As a result, a high operational leverage might be advantageous if a firm anticipates an increase in sales. This is due to the fact that earnings are more sensitive to fluctuations in sales, and the firm will gain more from increased sales. Yet, excessive operational leverage may be problematic if sales volume falls since earnings may drop as a result.
Firm’s WACC
Table 3: Firm’s WACC (Researcher, 2023).
Apple’s current debt-to-equity ratio is quite low compared to the industry average. While the industry average is generally approximately 30% debt and 70% equity, Apple’s capital structure is now 73% equity and 27% debt (Financial Times, 2023). This discrepancy may be attributed to Apple’s sound financial standing and capacity to produce enough cash flow to support operations without excessively depending on debt financing. Table 3 displays the weighted average cost of capital for Apple, which is 13.3%, due to the company’s low debt burden.
Firm’s Asset Turnover
Table 4: Firm’s Asset Turnover (Researcher, 2023)
In the most recent fiscal year, Apple Inc. recorded an asset turnover ratio of 1.6 times, much higher than the industry average of 1.1 times, as detailed in Table 4. This suggests that Apple is more efficient than its rivals in generating income from its assets. Apple Inc.’s increased asset turnover ratio might be related to various causes.
Apple, for example, has a well-developed supply chain system that enables it to manage its inventory effectively, enhancing its asset turnover ratio. Moreover, Apple has made significant investments in technology and automation, which allows it to maximize asset use and enhance the asset turnover ratio. Lastly, because of Apple’s strong brand identification and reputation, it has produced more revenues and hence raised its asset turnover ratio.
Firm’s Beta Values
Table 5: Beta Values (Financial Times, 2023).
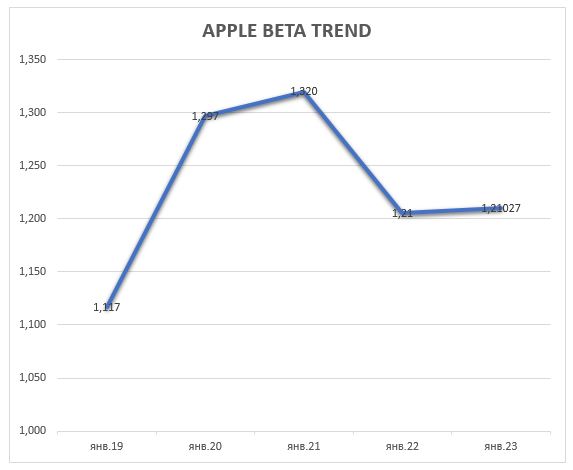
A beta of one indicates that the stock moves in lockstep with the market; a beta less than one indicates that the stock is less volatile than the market; and a beta larger than one indicates that the stock is more volatile than the market. In the example of Apple Inc., its beta has ranged from 1.117 to 1.21027 throughout the previous five years, as indicated in Table 5. According to the beta values and the trend in Figure 3, the stock is more volatile than the market.
Changes in factors associated with systematic risk, such as changes in the macroeconomic environment, industry-wide trends, geopolitical events, and shifting investor mood, might all be ascribed to this. The economic situation directly affects the stock market and Apple’s shares. A robust economy is typically accompanied by higher stock prices, whilst a bad economy is usually accompanied by lower stock prices. The economy in the United States has been reasonably solid over the last five years, which has likely contributed to Apple’s higher beta values.

Return on Assets and Return on Equity
Table 6: Return on Assets and Return on Equity (Researcher, 2023).
Return on Assets (ROA) and Return on Equity (ROE) are two of the most frequent profitability measures used by investors to evaluate a company’s performance. The ROA evaluates a company’s profitability in proportion to its total assets, while the ROE measures a company’s profitability in relation to its shareholders’ equity. The firm’s ROA has progressively increased over the last three years, rising from 13.38% in 2017 to 17.18% in 2019 and 18.44% in 2020, as depicted in Table 6. This is a good trend that indicates the firm is growing more lucrative over time.
Return on equity (ROE) has also increased significantly over time, growing from 36.07% in 2017 to 61.06% in 2019 and 87.87% in 2020, as shown in Table 2. These data indicate that the corporation is getting more efficient in its use of capital, resulting in higher earnings for shareholders. Moreover, the company’s sales and revenue may have increased, resulting in a larger return on assets and equity.
Hedging Strategies
To manage critical commercial and financial risks, Apple Inc. has used a number of hedging measures. For starters, the corporation has broadened its product range to encompass hardware, software, and services. This allows the firm to spread out its risk exposure and decrease its effect in the case of a sector slump. Second, Apple employs forward contracts to protect itself against currency swings. This shields the company’s profitability from the negative consequences of foreign exchange rate fluctuations.
Third, Apple has made investments in a wide range of financial instruments, including bonds, equities, and ETFs. This contributes to the company’s liquidity in the event of a financial catastrophe. Lastly, Apple employs third-party insurance to cover any losses incurred as a result of operational risks such as natural catastrophes and supply chain interruptions.
In addition to the existing risk-mitigation techniques, Apple may explore implementing additional risk-mitigation strategies. For example, the corporation may consider engaging in interest rate swaps to protect itself from additional interest rate hikes. This would shield the company’s earnings from any increase in borrowing costs. Apple might also explore investing in options and futures contracts. This would enable the corporation to secure its earnings by hedging against stock market volatility. Lastly, Apple may consider forming a risk management committee to monitor and analyze its risk mitigation techniques to ensure that they stay successful.
Firm’s Value Analysis
Table 7: Firm’s Value Analysis (MarketScreener, 2023).
The table depicts Alphabet, Microsoft, and Apple’s valuations using three separate methods: dividend-based valuation, book value (Balance Sheet) valuation, and market multiples valuation. For comparison, the sector average is also supplied. The dividend-based valuation technique posits that a company’s worth is determined by the present value of future dividends paid to its shareholders. According to this technique, Alphabet has the greatest worth of the three firms, with a value of 13.61, compared to 13.47 for Microsoft and 11.66 for Apple. This method’s sector average is 12.91, as indicated in table 7.
The book value technique determines a company’s worth based on its net assets or book value. This technique yields the greatest valuation for Microsoft, 307.44, compared to 128.02 for Alphabet and 166.82 for Apple. This approach has a sector average of 200.76. The market multiples approach compares a company’s main financial ratios, such as price-to-earnings and price-to-sales, to those of other firms in the same industry. According to this measure in Table 7, Alphabet has the greatest valuation at 770,515, followed by Microsoft at 1,197,348.48 and Apple at 437,806.08. This method’s sector average is 801,889.92.
When comparing these numbers to the firms’ current market capitalization, keep in mind that the market capitalization represents the current market mood and estimates about the company’s future growth potential. If the estimated valuation of a model differs considerably from the market capitalization, this could suggest that the market excessively valued or undervalued the firm based on the model’s assumptions (Homburg et al., 2020). For example, if the dividend-based valuation shows a greater value than the market capitalization, the market may be undervaluing the company’s future dividend payments. If, on the other hand, the book value-based technique predicts a lower value than the market capitalization, this might imply that the market is overvaluing the company’s net assets.
It is also critical to understand the assumptions and limits of each valuation approach. The dividend-based techniques, for example, presume that the corporation will pay out future dividends, which is not necessarily the case. The book value technique requires that a company’s assets are appropriately represented on its balance sheet, which is not always the case, particularly for intangible assets (Homburg et al., 2020). Finally, the market multiples technique presumes that the firm’s financial ratios are similar to those of other companies in the same industry, which may not necessarily be the case if the company works in a unique or specialized market.
Discounted Cash Flow Model
Table 8: Apple’s Discounted Factor Model (MarketScreener, 2023).
The Discounted Cash Flow (DCF) model is a financial valuation tool used by investors and analysts to assess a company’s worth, such as Apple. This approach is based on the idea that a company’s value is defined by the present value of future cash flows. The DCF model’s cash flow estimates are often based on the company’s previous performance and future goals and aspirations, as shown in Table 8.
After projecting the cash flows, they must be discounted back to their present value using the discount rate. This is accomplished using the formula: present value = future cash flow divided by (1 + discount rate) number of periods. This formula considers the time value of money, which asserts that money is worth more now than it will be in the future. The payback Period is the time it takes for an investment to generate a positive internal rate of return, calculated by discounting future cash flows to their present value (Laitinen, 2019). The Net Present Value (NPV) is the difference between the present value of the cash flows and the original investment. In the instance of Apple, the Payback Time is four years, and the NPV is sixteen thousand dollars.
The Internal Rate of Return (IRR) is then determined, the rate at which the present value of all cash flows (both positive and negative) matches the original investment. In Apple’s situation, the IRR is 14%. Apple’s repayment time is four years, as shown in Table 1. This suggests that it will take four years to return the original investment. This is a comparatively quick payback period, indicating that the investment will likely succeed over time.
Moreover, the payback time may be used to evaluate several investments and decide the most lucrative ones (Laitinen, 2019). The DCF model helps evaluate possible investments, such as those in Apple. Investors and analysts may assess the current value of a firm and make educated judgments about whether or not to invest in it by utilizing the discount rate, cash flow predictions, and other factors.
Assumptions
The first premise of the model is that cash flows are constant and predictable over the investment horizon. Moreover, the model considers no inflationary effects on future cash flows (Laitinen, 2019). This is significant because currency depreciation due to inflation makes budgeting difficult in the long run. Hence, the model assumes that the cash flow estimations are unaffected by inflation, which allows for more precise computations.
Book Value Based Valuation
Table 9: Book Value-Based Valuation (MarketScreener, 2023).
A company’s assets and liabilities may be valued using the difference between their book and market values. A company’s NAV, or “net asset value,” may be determined this way. Apple has £352.755 billion in assets and £302.1 billion in liabilities, for a Net Asset Value of £506.72 billion. The firm’s market cap is £2644811 million, which may be compared to the NAV, as shown in Table 9. The market price/book value-based valuation, in this example, £268562 million, is derived from the industry’s average price/book ratio.
Assumptions
The assumptions and criteria that go into Apple’s book value-based valuation include the reliability of the financial statements and the reliability of the current market capitalization. Moreover, the average industry price-to-book ratio may not be representative of the market since it does not include the firm’s development potential or competitive advantages (Homburg et al., 2020). Likewise, when establishing a company’s worth, future cash flows are a key consideration that book value-based assessment ignores.
Market Multiples-Based Valuation
Table 10: Market Multiples Based Valuation
A typical method for estimating a company’s worth, market multiples-based valuation, does this by comparing the target company’s financial indicators to those of similar companies in the same industry or sector. Apple Plc’s P/E ratio and the average P/E multiple in the industry determined the company’s value. Apple Plc has a P/E ratio 22 at its current stock price of $152.55 based on its Yearly Earnings of $6.62, as indicated in Table 10. By multiplying the company’s earnings per share by the average P/E ratio in the industry, which is 18.95, we get a price estimate of $125.45. This calculation shows Apple Plc’s share price is now 22% over its intrinsic value.
Assumptions
Its price may reflect the company’s financial performance, growth prospects, industry competitiveness, macroeconomic variables such as interest rates, and the market mood. The possibility of regulatory difficulties, market instability, and the company’s dependence on a small number of goods and markets might mitigate any benefits (Homburg et al., 2020). This value should be viewed cautiously since it is based on assumptions and thus open to revision if new information becomes available.
Apple DPS Valuation

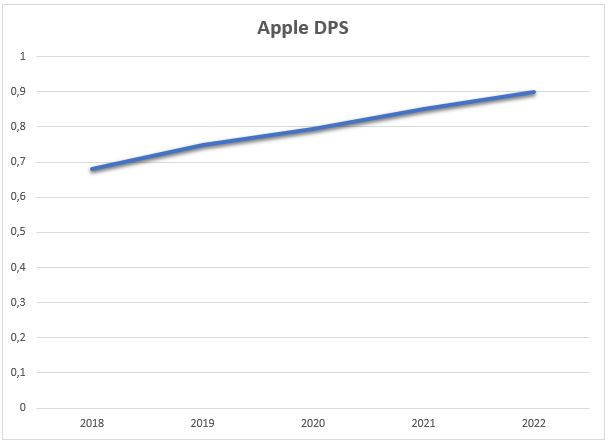
Apple’s dividend per share (DPS) is a metric that evaluates the quarterly cash dividends distributed to stockholders. The dividend payout ratio is found by dividing the total dividends by the total number of shares in the firm. Many variables are used to calculate Apple’s projected DPS for 2018–2022, as shown in Figure 4. The first step is for Apple’s board of directors to set a target percentage of net income for dividends.
Assumptions
The model assumes that the present value of all future dividend payments equals the value of a stock. It is based on the notion that the price of a company should equal the entire value of all projected future dividends (Arsal, 2021).
The first assumption is that the company’s dividends would rise consistently. This growth rate should represent the company’s planned rate of return on investment and its profits growth rate. This assumption is required because it enables the model to forecast the value of dividends in the future.
The second assumption is that the corporation will pay a fixed dividend yearly. This payment should represent the predicted cash flow and the company’s capacity to earn enough cash to pay dividends.
Best Model for Apple Valuation
The Discounted Cash Flow (DCF) Model is the best methodology for evaluating Apple Inc. The DCF Model is based on the premise that the present value of a company’s future cash flows determines its worth. Because it takes into account the time value of money—which holds that money is worth more now than it will be later—this method was chosen to value Apple (Laitinen, 2019). The model also considers the company’s prior performance and forecasts of future cash flows. Investors and analysts may use the DCF Model to correctly analyze Apple’s present worth and make informed choices about whether or not to invest in it.
Analysis of Firm’s Dividend Policy
The firm’s dividend policy is based on a stable and sustainable dividend payout ratio and is aimed at providing shareholders with a consistent and predictable source of income. The Modigliani-Miller (M-M) Proposition I is a theoretical framework that most likely affected Apple’s dividend policy. According to this model, with ideal capital markets and no taxes, a firm’s dividend policy does not affect its overall worth. Consequently, Apple’s choice to pay a constant and stable dividend is likely founded on the belief that this dividend policy would be the most appealing to shareholders in the long term, regardless of the actual payout ratio.
Furthermore, the Bird-in-the-Hand Hypothesis implies that investors favor dividends over capital gains because they are less risky. According to this idea, investors appreciate the present income provided by dividends more than the anticipated benefits of capital growth. As a result, Apple’s choice to pay a regular dividend may be predicated on the belief that investors value a continuous source of income more than the possibility of capital gains.
Reference List
Arsal, M. (2021) “Impact of earnings per share and dividend per share on firm value,” ATESTASI: Jurnal Ilmiah Akuntansi, 4(1), pp. 11–18. Web.
Financial Times (2023) Financial Times Home, Financial Times. Web.
Homburg, C., Theel, M. and Hohenberg, S. (2020) “Marketing excellence: Nature, measurement, and investor valuations,” Journal of Marketing, 84(4), pp. 1–22. Web.
Laitinen, E.K. (2019) “Discounted cash flow (DCF) as a measure of startup financial success,” Theoretical Economics Letters, 9(8), pp. 2997–3020. Web.
MarketScreener (2023) Stock market quotes and news : Equities, indexes, Commodities, forex on Marketscreener.com, MarketScreener.com | stock exchange quotes| Company News. Web.