Introduction
The objective of the current report is to calculate the beta value of Apple Inc. and discuss the implications of this value. The analysis carried out in this report determines the slope between stock returns of Apple Inc. and S&P 500 (index) returns, which is determined on a daily basis. Apple Inc. is a technology-based firm based in the United States. The company is considered a mature firm, which is engaged in developing and selling technology-related products including computers, smartphones, wearables, accessories, and software.
The company has a strong customer base due to its advanced technologies and high-quality products. It also has an excellent customer relationship management system, which ensures that consumers receive high-quality services after purchasing Apple’s products. The company is operating in the information technology industry, which is growing rapidly. There are many existing and new companies competing with each other through the development of new technologies.
Apple is a well-established company and its business strategy is to acquire new companies and integrate their technologies into its existing systems, as well as further developing new ones. The company sells products and services to both individuals and corporate clients. Its products are considered luxury items because of their pricing. Although technology has lowered the cost of certain products, Apple has a premium-pricing strategy due to its innovativeness and the continuing demand for its new products and models.
CAPM Model
The Capital Asset Pricing Model (CAPM) is considered to be useful and is the most commonly used method of determining the expected return on equity investment. The CAPM can be used to measure risks and interpret them to estimate the projected return on equity. The primary advantage of CAPM is that it generates an accurate value of the cost of equity. According to Sharifzadeh, CAPM is a systematic model that is used to assess the association between the risk of investing in a security and its expected return.
Furthermore, it indicates that the return generated by a security depends on the risk-free return and market risk premium. In this way, financial analysts use this model to determine whether the business has the ability to generate profit when they face various risks. The cost of equity can be determined by using the following equation of the CAPM, which requires the beta value of stock, risk-free rate, and market rate of return (Sharifzadeh 60).
- Cost of Equity: Risk-Free Rate + Beta * (Total Market Rate of Return – Risk-Free Rate)
The CAPM may be used to determine the total return, which shareholders require on their investment in the selected company’s stocks. Moreover, I can use the CAPM as a capital accounting threshold for determining the prerequisite rate of return. Consequently, it will help me in demonstrating the return, which is demanded by the market in exchange for maintaining their financial resources and bearing the risks associated with the firm.
The CAPM’s application will help in understanding that the level of risk associated with the company’s stocks. It could be noted that in the model provided above, the stock beta value is positively correlated with the cost of equity. It means that if the stock has a high beta value, then shareholders are likely to demand a higher return of return to compensate for the risks that they are accepting.
Data Sources
The data of historical stock prices of Apple Inc. (AAPL) was obtained from Yahoo! Finance (“Apple Inc. (AAPL)”). Furthermore, historical values of the S&P 500 index were also collected from the same source (“S&P 500 (^GSPC)”). The daily data of both AAPL and the S&P 500 was retrieved from Yahoo! Finance and inserted in MS Excel sheet to calculate daily returns. The daily returns were calculated using the following formula.
Results and Discussion
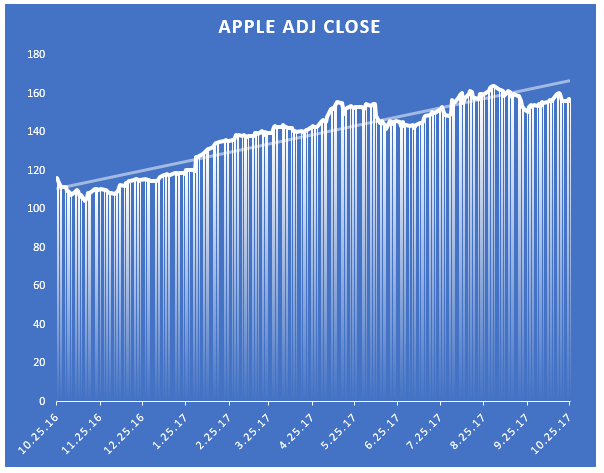
The results obtained from the calculation of daily returns indicate the stock price of Apple had a positive trend as its values were $116.20 and $156.41 on October 25, 2016 and October 25, 2017 respectively. It is also represented in the following graph.

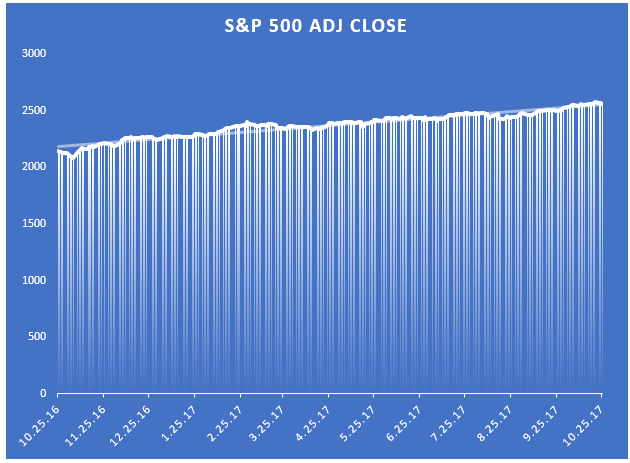
Additionally, the value of the S&P 500 index also showed a positive trend in the last one year. Its values were 2143.16 and 2557.15 on October 25, 2016 and October 25, 2017 respectively. It is represented in the following graph.

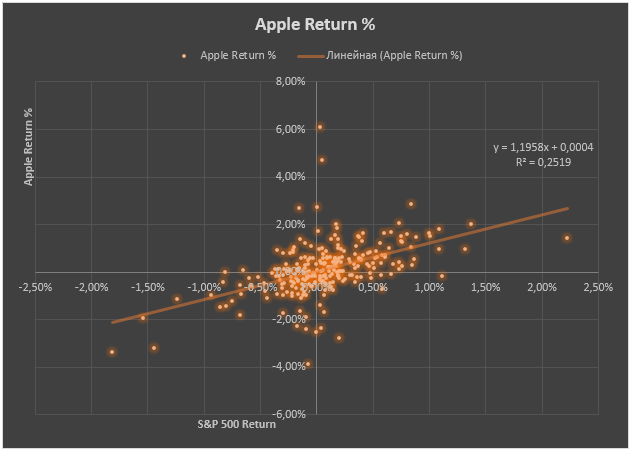
From this analysis, it should be noted that the values of both AAPL and the S&P 500 increased in the last one year. This implies that there was a positive correlation between these two as they moved in the same direction. The average daily return of AAPL is 0.12%, and that of the S&P 500 is 0.07%. It implies that the stock value of Apple has a higher growth rate in comparison to the S&P 500. The company’s stock has outperformed the market index. Based on the CAPM model, it could be indicated that stocks with higher beta value (risk) are likely to generate a higher return on stockholdings. The beta plot of Apple is provided in the following.

The regression equation representing the relationship between Apple Return (%) and the S&P 500 Return (%) is given below.
- Apple Return (%) = 1.1958 x S&P 500 Return (%) + 0.0004
The equation provided above indicates that the stock beta is 1.1958, which is greater than 1. This implies that Apple’s stock bears a high-risk position. The changes in the company’s stock value are more than the observed changes in the values of the S&P 500 index. It is noted that stocks of technology related companies offer a higher return than companies in other sectors while also having a higher risk level.
This is due to the greater uncertainty about the viability of their products and services in the long term. The competition in the technology industry is intense, and new companies are emerging that are working on new technologies. Therefore, it is challenging for existing firms to ensure that their technologies are up to date. It is for this reason that companies such as Apple, which have a high net worth and excessive cash position, buy small companies that are working on technologies to enhance their products or services. Moreover, the demand for new technologies is also increasingly rapidly with the introduction of the Cloud and wearables.
Companies are working on inventive methods of data collection, which is also pressurizing information technology companies to invest in research and development. Based on this discussion, it could be indicated that the beta value of Apple, which is greater than 1, is similar to other companies that are operating in the technology sector.
The beta value of Apple listed on Yahoo! Finance is 1.39, which is different from the beta value obtained from the beta plot. In fact, it is higher than the calculated value. The reason for this difference is that Yahoo! Finance calculates the beta value by using monthly data of stocks and index of a 3-year period. Moreover, the method used by Yahoo! Finance is different as it uses total return adjusted beta, which considers stock price including dividends and excludes dividends from index values.
On the other hand, the method used in this report used the data of daily stock prices and index values for only one year. However, it is possible that both approaches used the same Excel function, i.e., SLOPE function to determine the beta value by inserting daily stock return as known y’s and S&P return as known x’s.
The results from the analysis meet my expectation because I understand that the companies in the information technology industry face more risks than manufacturing or retail companies. Their business depends on their ability to develop new technologies that attract users. The competition in the market is increasing, and companies require a lot of funds to invest in technology development either in the form of software or hardware.
Although high investment generates high returns, there are greater risks faced by these companies as their technologies can become obsolete quickly. Moreover, the company’s products are luxury items, which cannot be purchased by everyone because of their high prices. It is understood that firms which sell luxury items tend to have a high value of beta as risk aversion in the consumption of luxury items is high. Therefore, technology-related firms have a high beta value, which also results in a high return on equity determined by the CAPM model.
Works Cited
“Apple Inc. (AAPL).” Yahoo! Finance, 2017. Web.
“S&P 500 (^GSPC).” Yahoo! Finance, 2017. Web.
Sharifzadeh, Mohammad. An Empirical and Theoretical Analysis of Capital Asset Pricing Model. Universal-Publishers, 2010.