The Experimental Objectives
- To be fully acquainted with the basic operation of both single channel and multichannel analyzers including acquisition software Maestro.
- To determine the linearity of the single channel analyzers in different modes of operation.
- To be able to measure the intrinsic resolution of the tail pulse generator-amplifier system using the MCA.
- To be able to determine the nonlinearity of a multichannel analyzer.
Brief Theoretical Background
One of the targets in signal processing is converting the processed linear signal to a digital form. It is worth noting that most storage (or memory) devices store information in digital form, that is, in 1s and 0s. Therefore, conversion is crucial in the sense that the processed information can be stored for future analysis as well as plotting the pulse height spectrum as emitted by the detector. There are two key channels or tools used to output logic pulses. The first one is known as a single channel analyzer (SCA), it outputs a logic pulse when the input pulse meets a certain amplitude. The tool that provides the means to conduct a pulse height analysis of incoming linear signals (pulse height analysis, or PHA mode) as well as conduct a series of counting experiments in one run (multichannel scaling, or MCS mode) is known as a multichannel analyzer (MCA). It is worth noting that MCA is a collection of SCAs where every individual SCA is connected to a unique counter. This interconnection of SCAs results in MCA being known as an ADC (analog-to-digital converter). There are various types of comparators, key of them being Wilkinson, flash, and sub-ranging ADC. Figure 1 below shows the flash ADC;
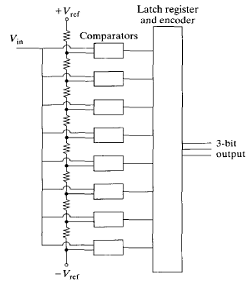
Despite the configuration technique the ADC cannot carry out a simultaneous processing and storage of signals. There is a time-span referred to as the dead time that is usually linked with every ADC. The digital values are either on or off, there is a scale to the power of 2 for such parameter as voltage bins, number of SCAs utilized, and number of channels. Correspondingly, the number of states of the inputs will be to the power of 2. For instance, a three-input systems will have 23 as its possible digit values. These are as outlined below:
000 001 010 011 100 101 110 111
Also, the available commercial MCAs have their number of channels corresponding to this power 2 algorithm. As such, the key specification of commercial MCAs is the number of bits. For example, a 12 bit MCA will have 212 bins or 4,096 channels across its voltage range. If this range is 0-10 V, which is common for NIM, then the voltage range per channel will be 2.44 mV. From the experiment’s perspective, the radiation being measured as well as the resolution of a given SCA or MCA will influence the number of channels to be utilized.
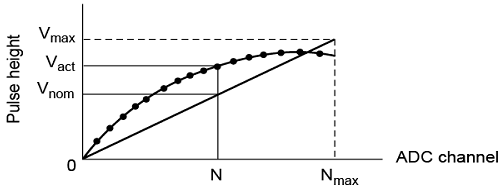
However, the conversion process via the ADCs is not always perfect as there are deviations occurring across the given input voltage range. These are referred to as non-linear effects and they are significant at the tail end of the scale, as figure 2 depicts. The vital specification of MCAs is their degree of nonlinearity. This measure always dictates the quality of the MCA in question.
Pre-laboratory Questions
Foremost, the key roles of a counter are to index and decrement or increment the values of a given system input. Thus, it relates with SCA (which outputs a logic pulse when the input pulse get to a given amplitude) in a manner that both performs some incremental computations.
The chief advantage of increasing the resolution of MCA is that the entire spectrum of a photoemission can be easily taken with a single shot. This implies that there is full exploitation of the energy dispersion over the detector’s diameter. However, increasing the number of channels in MCAs might be of great disadvantage in cases where short spectra only need to be taken. Since each channel has its own gain, the intensity of a given photoemission at a fixed KE is hard to determine.
The number of SCAs, as alluded to in the theoretical background will be given by:
Where x is the number of SCAs.
The major cause of dead time in MCAs is their limited time resolution where there are losses in counting of the detector’s pulses. Also, the overlapping of pulses can cause dead time in MCAs. One way of overcoming this cause is to increase the number of counts.
As per the NIM standards, the voltage ranges for the digital on (or the logic 1) and the digital off (or the logic 0) for slow-to-medium-speed logic signals are as shown in table 1 below:
Table 1: digital on and off as per NIM
Tools and Equipment
- Tail pulse generator
- Oscilloscope
- NIM rack
- Single channel analyzer
- Multichannel analyzer
- PC with Maestro software on it
Post-laboratory Questions
The SCA portion
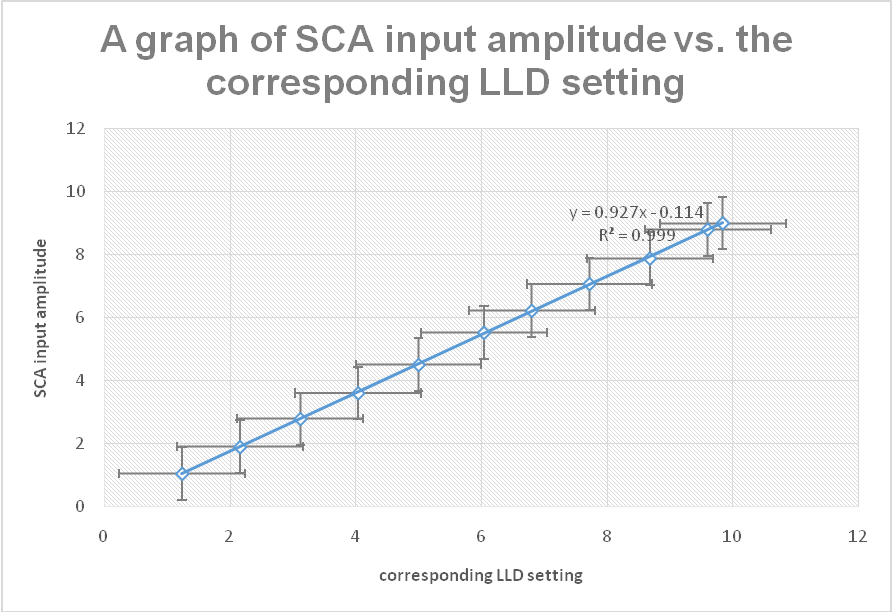
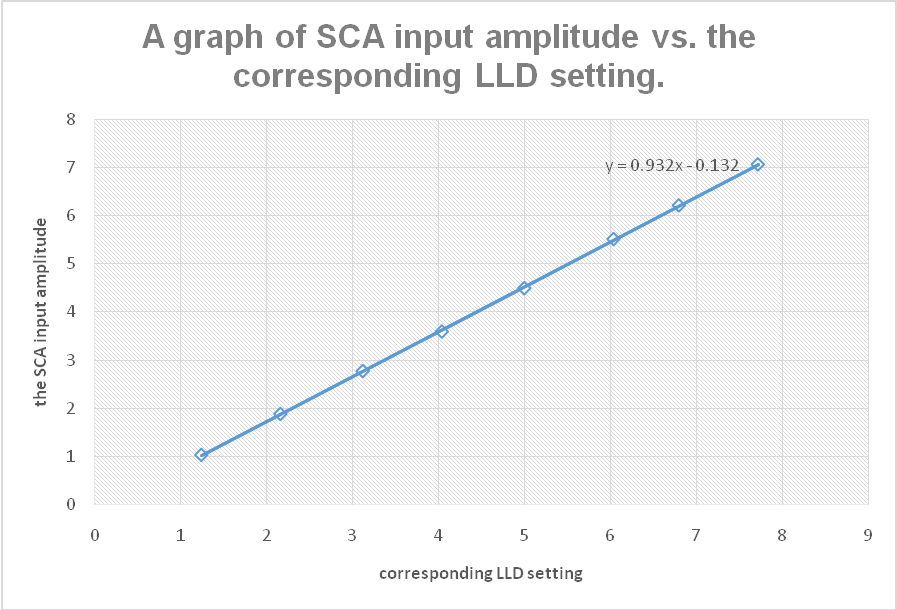
The data collected in step 10 was used to plot the SCA input amplitude vs. the corresponding LLD setting and a linear trend included. This is shown in figure 3 below;
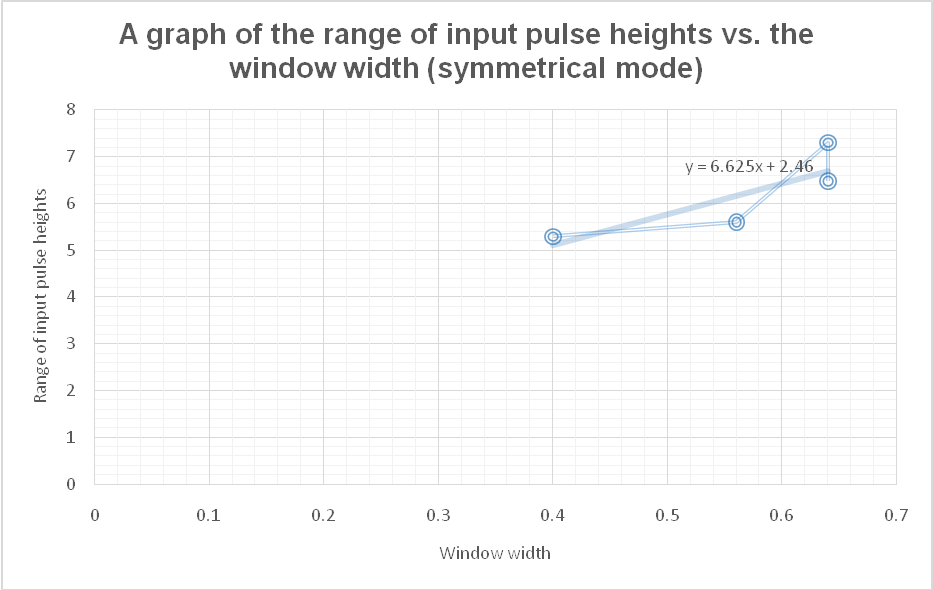
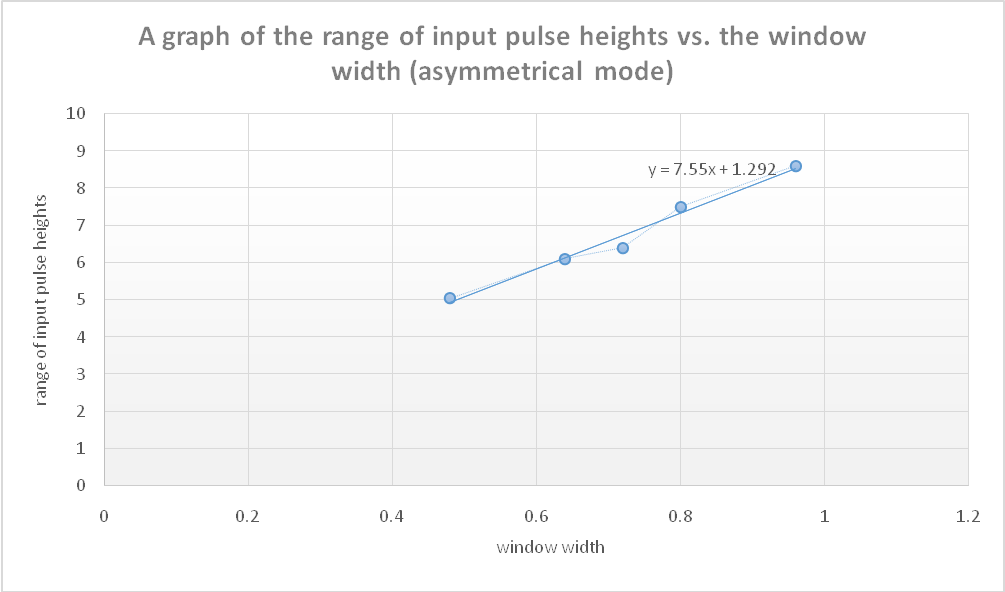
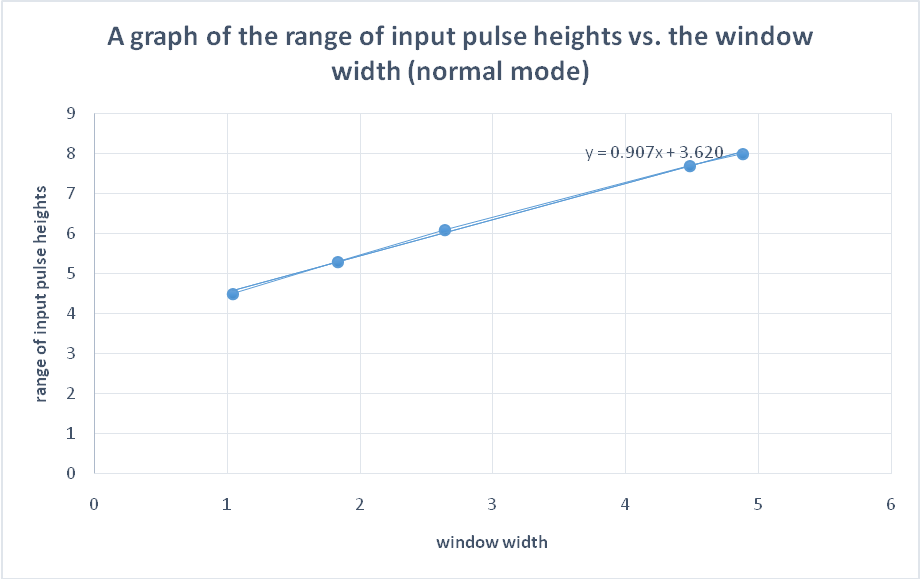
Using the data collected in steps 13-17, the range of input heights vs. the window width for symmetrical, asymmetrical, and normal modes was plotted as shown in figures 4, 5, and 6 below;
Symmetrical mode
Asymmetrical mode
The normal mode
As it can be deduced from figure 3, there is a typical linear relationship between the LLD knob setting and the amplitude input. From the trend line equation y = 0.9323x – 0.132, a unit change in the LLD setting will result in approximately 0.9323 (which is almost unity anyway) change in the SCA amplitude input. Thus it is correct to assert that the two parameters exhibit a linear relationship.
As it can be seen in figures 4, 5, and 6, there is a fairly linear relationship between the range of input pulse heights and the window width for the three modes. However, based on their trend line equations, figure 6 (for the normal mode) exhibits a more linear relationship than the other two modes. That is, with the equation y = 0.9077x + 3.6205, a unit change in the window width will result in about 0.9077 change in the range of input pulse heights. The value of change in this case is a bit closer hence depicting a linear relationship. However, for the other two cases, a unit change in window width leads to about 6.625 (y = 6.625x + 2.46) for the symmetrical mode and 7.55 (y = 7.55x + 1.292) for the asymmetrical mode. This means that there is a huge deviation in the change hence can only be termed as fairly linear curves.
The MCA portion
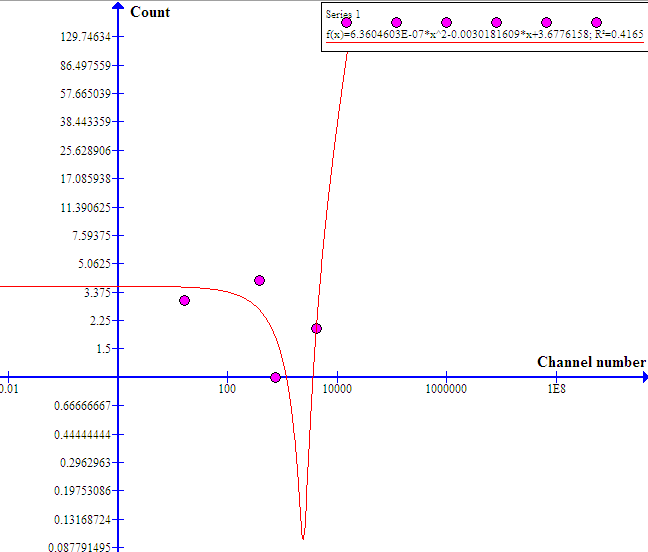
Data collected in steps 27-30 were used to plot a differential pulse height diagram as shown in figure 7 below;
Or
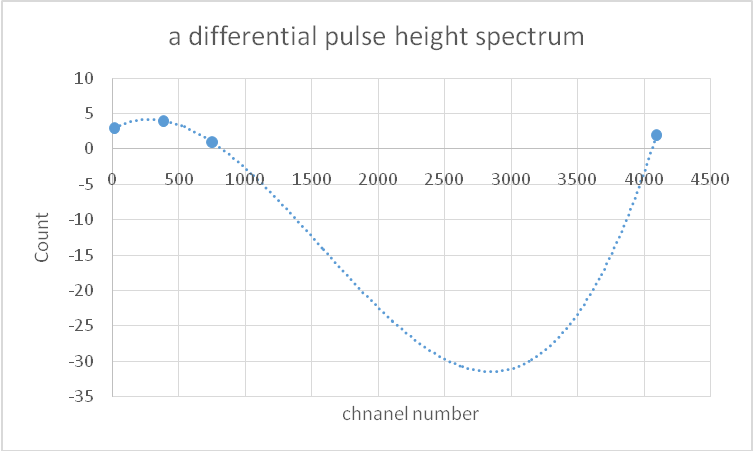
Mean= (750+4090+16+384)/4
≈ 1311.5
Standard deviation ≈ 36.21
The full-width at half-maximum (FWHM) of each trace = 2.35×SD
= 2.35 × 36.21
= 85.0935
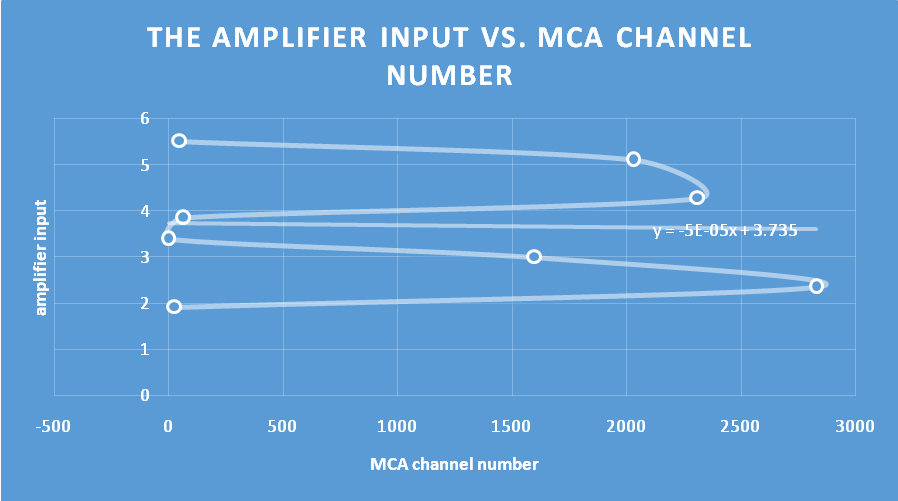
From the data collected in steps 32–34, the amplifier input was plotted against MCA channel number as shown in figure 8 below;
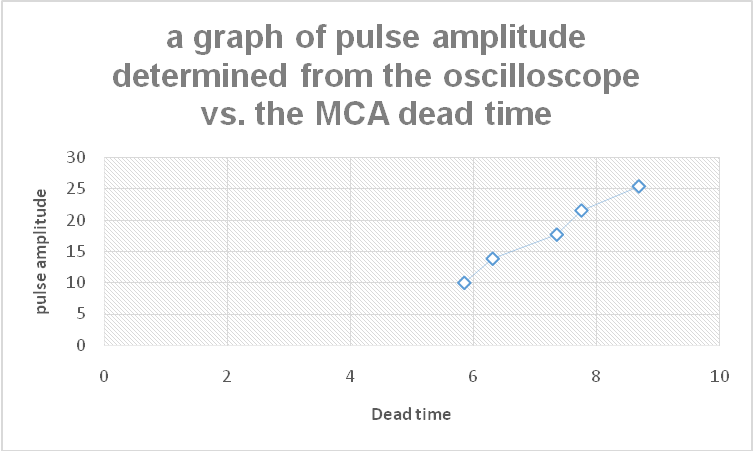
Data collected in steps 35-41 was utilized in plotting a graph of pulse amplitude determined from the oscilloscope vs. the MCA dead time. As shown in figure 9 below;
Plot was done as described in question 2a.
The full-width at half-maximum (FWHM) of plots =85.0935. From the calculated value of FWHM, this is a Gaussian distribution.
The plot was made as described in 2c.
2-D: the percentage differential nonlinearity is given by equation 1 below;
½ * Wmax– Wmin/Wavg* 100
The linearity on any given MCA is vital as it reveals how uniform or non-uniform its address widths are. This affects the way in which pulse heights will be used to select channel numbers.
In this case, the dead time is fairly dependent on the pulse amplitude, as figure 9 depicts. Thus, the ORTEC 927 ASPEC MCA has a flash-type ADC.