Introduction
The article in the Los Angeles Times analysed the changes in the prices of wheat in the global market i.e. Europe, US, Asia etc. This increase in prices has been caused by the harsh environmental conditions experienced in the large producers of wheat e.g. floods, drought, freezing etc (Hirsch, Para 2-5).
It shows and analyses how these increase has been received by different companies and consumers in different countries among them China, Italy, US cities etc. There has been also an increase in the general price level of almost all commodities used in the bakeries e.g. butter, this has also contributed to the increase of price (Hirsch, Para 11).
Hedging a technique used by many companies in this sector has proved unsuccessful in the maintaining of the price as the increase is large i.e. from $2.91 in January 2006 to $8.75 in January 2008. This increase is high as it has also caused inflation making the overall food prices to increase from 4.5% to 5% in 2008.
These high prices has brought different reactions, some of the consumers have resulted to strikes and civil actions to protest this increase in prices while the producers has resulted to a cost cutting measures in their productions e.g. some have resulted to substituting gasoline with natural gases in vehicles, however these reductions has not been scaled down to the consumers as the producers are trying to increase their profit margin (Hirsch, Para 35). This article unfolds the rational behind the increase in price in the liberalised markets of the world where market forces determine the prices. The option of pricing is determines by forces of demand and supply of both the raw materials and the products being produced.
Economic analysis of the situation
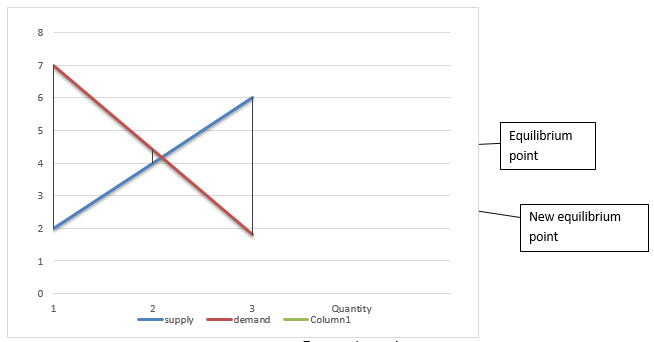
In a free market the price is determined by forces of supply and demand are at an equilibrium point i.e. where these two forces intersect, this can be illustrated as follows; Graph 1

The graph represents an analysis of how the forces of demand and supply determine prices in a market. The intersection point is known as the equilibrium price in this case is about 4.2 for each 2.4 quantities of the commodity.
The same situation is present in the wheat industry, the cost of wheat products increases due to an increase in the cost of wheat. In the above graph if there is an increase in the cost of production that translates to high cost per unit produced. This can be represented by the new equilibrium point which shows that the cost of wheat has increased to $4.2 for each 1.5 quantities of the commodity.
The shift of the supply curve to the left shows a decrease in supply due to factors like; increased cost of production, cost of raw materials, cost of other inputs used in production etc. The demand curve also shifted to the left due to an increase in the price of the commodity.
This will only apply in free or liberalised markets where the forces of supply and demand determine the market price. The market controls itself by increasing or decreasing the equilibrium point due to shocks from the supply side of the market and also shocks from the demand side thus is a self price adjusting mechanism.