SWOT Analysis
Strengths
Our core strengths include affordable prices that contribute to the cost advantage of Spirit Airlines, availability of loyalty programs for retaining customers, and more seats on airplanes in comparison with other affordable airlines. Our company is well-known in the region as well as in Latin America and the Caribbean (“Spirit Airlines SWOT analysis, USP and competitors,” 2017).
Weaknesses
Our weaknesses include the lack of catering and entertainment services on flights, limited destinations, and no allowance for baggage (extra fees).
Opportunities
A positive outlook for the United States’ economy presents major opportunities for our company, facilitating technological advancements to improve in-flight entertainment and attract more customers.
Threats
Among the possible threats for our company, an increase in fuel price can harm low-cost flight operations. Also, outdated technologies and average service quality can lead to the loss of customers (“Spirit Airlines SWOT analysis, USP and competitors,” 2017). These threats are of particular importance for our company to address.
Analysis of the Internal Organizational Environment
Corporate Governance
Audit Committee
Our Audit Committee includes three members (Chair – David Elkins) who are responsible for the review of Spirit Airlines’ audit and internal accounting processes; also, the Committee gets assistance from independent auditors (“Corporate governance guidelines of Spirit Airlines, Inc.,” n.d.). All members of our Audit Committee align with the “requirements of financial literacy and the applicable rules and regulations of the SEC and the NASDAQ Stock Market. The Board has determined that all members of the Audit Committee are financial experts defined under the applicable rules” (Spirit Airlines, Inc., 2017, p. 10).
Compensation and Benefits Committee
Our Committee consists of three members accountable for approving and reviewing specific objectives associated with matters of reimbursements for stakeholders (“Corporate governance guidelines of Spirit Airlines, Inc.,” n.d.). Current members of our Compensation and Benefits Committee are Mr. Elkins (Chair), Mr. Gardner, and Ms. Soto (Spirit Airlines, Inc., 2017). Also, we have engaged Mr. Watson to act in an independent advisory to the Committee.
Corporate Governance Committee
Our Committee also requires the participation of at least three members involved in the decision-making regarding nominations of employees for positions of Committee members and directors. Such decisions involve candidates’ and directors’ evaluations. Current members of the Committee include Mr. Donaway (Chair), Mr. Elkins, and Mr. Jones. Each of them meets the definition of “independent director” to align with the requirements of NASDAQ Stock Market qualifications (Spirit Airlines, Inc., 2017, p. 11).
Credit Committee
Our Committee includes three members who assess our company’s standing credits and whether the debts are repayable based on our financial capacity. Other responsibilities include the management and analysis of current credit policies and identifying possible risks associated with our operations.
Enterprise Risk Committee
Our Committee includes three members responsible for establishing risk management policies and strategies that control our company’s operation (refer to Appendix A). The Committee’s current members include Mr. Johnson (Chair), Mr. Fornaro, Ms. Soto, and Ms. Zier (Spirit Airlines, Inc., 2017). The Committee reviews our activities, develops safety programs and procedures, and manages airline operations’ sustainability as to safety insurance.
Financial Position and Capacity
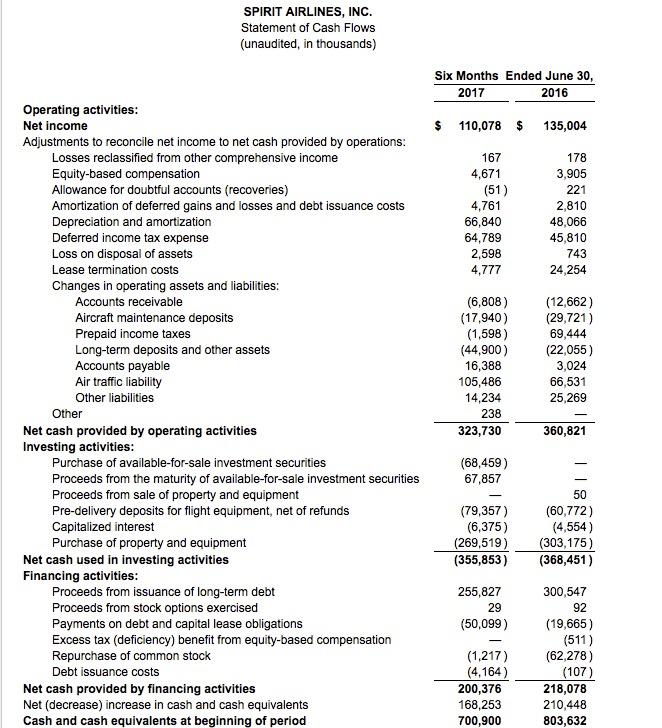
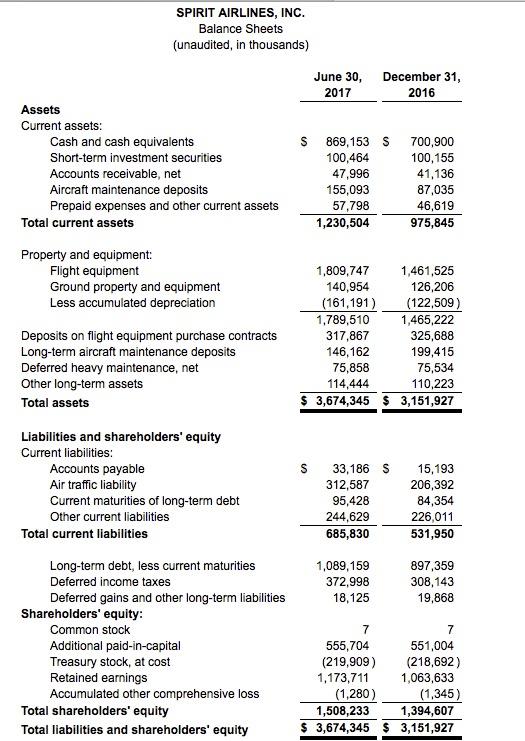
Our net income for 2017 is $110,078,000 compared to $135,004,000 in 2016 (refer to Appendix B here and onward). Net cash provided by operating activities is $323,730,000 for 2017 and $360,821,000 for 2016. Net cash used in ivesting activities is $355,853,000 for 2017 and $368,451,000 for 2016. Total current assets are $1,230,504,000 for 2017 and $975,845,000 for 2016. Total assets by June 20, 2017 were $3,674,345,000 and by December 31, 2016 were $3,151,927,000. Our company’s total shareholders equity by June 20, 2017 was $1,508,233,000 and was $1,394,607,000 by December 31, 2016 (refer to Appendix C).
As to our company’s financial ratio calculations, current ratios were 2.2 and 1.83 in 2015 and 2016, respectively. Long-term debt was 23.58 in 2015 and 28.47 in 2016, with a total asset turnover of 57.86 in 2015 and 24.56 in 2016 (refer to Appendix D). Return on assets was 12.54 in 2015 and 8.4 in 2016, which points to the significant decline in this area. Such a difference in ROA ratio can be attributed to overcapacity and low costs. While we have been extensively extending our airplanes’ capacity to fit as many passengers as possible, now we have to deal with the drop in return on assets.
If to compare the financial results of the first quarter of 2017 with the last quarter of 2016, there is an increase in total assets: $3,438,614,000 on March 31, 2017, and $3,151,927,000 on December 31, 2016 (“Spirit Airlines reports first quarter 2017 results,” 2017). Operating special items to take into consideration include special charges and loss on disposal assets. On March 31, 2017, the loss on disposal of assets was $1,105,000, while on March 31, 2016, it was $204,000. As to special charges, they were $4,776,000 on March 31, 2016, and $16,202,000 on March 31, 2016 (“Spirit Airlines reports first quarter 2017 results,” 2017). Lastly, our company agrees that economic fuel expenses are the best measurement of the effect that fuel prices have on our business. Fuel expenses on aircraft fuel were $139,782,000 on March 31, 2017, and were $85,982,000 on March 31, 2017 (“Spirit Airlines reports first quarter 2017 results,” 2017). Overall, there has been a reported increase in our company’s spending and earnings in 2017, which points to the expansion of operations, which needs to extend further to reach genuinely significant results.
Organization Structure
Organization culture
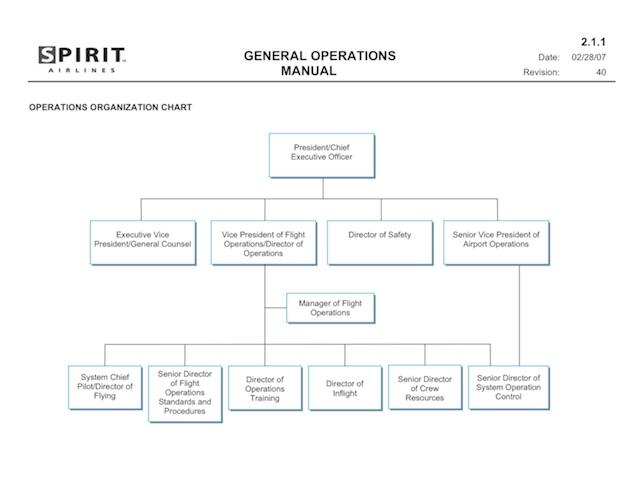
Robert Funaro as the Executive Officer (Chief/President) and the head of our company (refer to Appendix E) who guides the performance of the Chief Executive Officer Ted Christie, the Chief Operating Officer John Bendoraitis, the Chief Information Officer Rocky Wiggins, the Chief Commercial Officer, and Sr. Vice President Matt Klein, and Sr. Vice President and General Counsel & Secretary Thomas Canfield.
Human resources
Michael Perry is the Director of the Human Resources department here at Spirit Airlines. Mr. Perry leads our team of human resources specialists who manage 4.85 thousand employees, including full-time and part-time workers. Our company focuses on attracting talented and skillful pilots, flight attendants, operators, customer relationships specialists, managers, and many more professionals who want to work on low-cost travel. We maximize our efforts to hire diverse personnel to offer job opportunities to everyone who can add value to our operations, regardless of employees’ gender or ethnic background.
Operations/Production
If to take into account the nature of airline operations, we do not specifically offer products. Here at Spirit Airlines, we ensure the convenience of traveling quickly and light. We care about increasing the capacity of our aircraft to expand our customer base by maximizing the number of available seats without causing the rise in fixed costs. For example, the A319 owned by our company has 145 available seats compared to 128 seats in the same aircraft owned by our competitors (Matthews, 2015). We also focus on operating only three models of airplanes that have similar mechanisms to achieve effective management of our pilots. We believe that our customers should only pay for the services they need and should not subsidize services that other customers use.
Marketing (Marketing Mix)
Price
Our fares are among the lowest on the market, which subsequently increases the flow of customers and attracts those individuals that usually travel by train or bus. We can state that our pricing is highly transparent, unlike our competitors. Our company also offers customers an option to compare our prices to those of other airlines, which supports our message about transparency.
Place
We currently offer our customers more than fifty destinations across the United States (including the Caribbean) and South America. As we are planning to grow, the coverage of our operations will extend to new destinations.
Promotion
In our marketing campaigns, we promote fuss-free air travel that does not require customers to pay for an abundance of unnecessary services. We predominantly target price-conscious consumers that care about the amount of money they spend on their travel. Moreover, we have managed to attract an entire sector of new clients who would not have chosen air travel had we not offered the lowest prices possible.
Research and Development
Our company focuses on research and development efforts on extending the capacity of our aircraft and reduce operating costs. We train our personnel to be skillful in airplanes’ operations while ensuring the safety and comfort of our passengers. The cost-effective utilization of our aircraft is the priority of the R&D department. We measure our operational efficiencies and expect high utilization capacities that lead to a decrease in fixed costs per unit.
Management Information Systems
We place particular importance on our management information systems as tools for achieving success and increasing our profitability. We organize our financial information so our management will be able to access regular reports. Therefore, we are working towards technological improvements to support our current initiatives and operations. For example, in 2013, we integrated an innovative SAP Resource Planning application to replace “our general ledger, accounts payable, accounts receivable, cash management and fixed asset systems” (Spirit Airlines, Inc., 2015, p. 96). Such a change in our management information systems was implemented to improve our overall effectiveness regarding the improvement of data accuracy, cost efficiency, and consistency. In 2015, our company integrated a new repair, maintenance, and operations system (TRAX) to improve the processes of tracking and maintenance of our financial transactions (Spirit Airlines, Inc., 2015). We are planning a continuous investment of resources to enhance our information systems’ effectiveness and ensure data security.
Internal Factor Evaluation Matrix
The main strengths that allow us to compete in low-cost air travel are loyal employees, low costs per available mile and seat, human resources, information systems, and the organizational structure and development. Our net income, the average price per fuel gallon, passenger land factor, corporate culture, and services are also contributors to our strength. As to our weaknesses, we admit that our lack of geographic coverage, high employee turnover, legal expenses, suppliers becoming competitors, poor commercial performance, and the revenue per available seat are the most prominent. Besides, no cargo operations, market strategy, and the lack of morning flights also limit our performance (refer to Appendix F).
Analysis of External Environment
Political and Legal
The industry in which we operate is highly susceptible to restrictions and regulations associated with international and domestic tax policies, trade, and competition problems (Cederholm, 2014). We also recognize that such problems as terrorism and disease outbreaks can limit our operations. Because of this, our management monitors the air travel industry’s political and legal environment to be able to adapt to any sudden changes that come from the external political and legal environment.
Regulatory and Governmental
The airspace sector, especially companies that operate airlines, suffer significant losses due to the regulatory changes governments make. Critical issues of concern for our business include potential security problems and aircraft safety procedures. On the other hand, such governmental initiatives as airline deregulation had a significant impact on reducing prices on airplane tickets and the subsequent increase in traffic.
Economic
Our business within the airline industry can suffer severe losses due to changing economic conditions that we cannot control. Such conditions include economic volatility (both in the U.S. and the international arena), consumer preferences and perceptions’ changes (for high or low fare carriers), unemployment rates, and stock market prices. From time to time, our operations and financial liquidity suffer from either one or more economic conditions. Among unfavorable characteristics of the economy, we acknowledge the adverse impact of high unemployment rates, housing-related constraints, issues on the credit market, and decreased demand for air travel.
We recognize that a stable position of the current economy directly influences our growth as a business. Such economic indicators as GDP, disposable income, and consumer confidence characterize our operations’ external environment. In the second quarter of 2017, the US GDP increased by 2.6% (CNBC, 2017). The personal disposable income of US consumers increased to $14417.4 billion in the third quarter of 2017 (Trading Economics, 2017). The last measurement of consumer confidence is 101.10 compared to the previous measurement of 95.1 (Trading Economics, 2017). We also take into consideration the oil price fluctuations. Currently, the price of crude oil is $51.34 per barrel (DailyFX, 2017).
Social, Cultural, Demographic, and Natural Environment
We have concluded that the demand for affordable air travel has increased in recent years due to consumers’ desire to discover new destinations. Our company expects that the subsequent increases in affordable air travel will depend on the millennial generation’s growth, which includes individuals aged between sixteen and thirty-four. Consumers who were born between 1946 and 1964 have started decreasing their expenditure on air travel due to the shifting social preferences. As to the natural environment that influences our operations, there is an issue of sustainability when it comes to air travel. At the moment, aircraft have a negative influence on the air; we consider it our duty to preserve the environment and invest in technologies that reduce adverse impacts.
Technological
For surviving the intense competition in the industry of low-cost air travel, we adopt the latest technologies. For example, our company is starting to invest in lower fuel consumption and increased seat capacity, thus improving our operations’ efficiency. Moreover, we are constantly looking to replace our old fleet with newer aircraft that have more operational potential.
Industry/Competitive
The Intensity of Existing Rivalry (External)
Our real rivals currently have better quality services and lower prices, with which we have to compete. We have to determine the level of competition between the rivals because its intensity depends on its competitive forces (refer to Appendix G).
Bargaining Power of Suppliers (Internal)
Our suppliers play a significant role in increasing our profitability. However, because of their work with other companies, they experience considerable pressure to deliver higher bargaining power.
Bargaining Power of Customers (Internal)
Our customers encourage us to be more aware of their demands and bring affordable services to increase our profitability. By being loyal to our customers, we can narrow the number of choices and encourage them to select our airline when they need a low-cost travel option.
The Threat of Substitutes (External)
The industry of inexpensive air travel has an abundance of carriers from which customers can choose, making our company vulnerable to losing customers who can opt for our rivals’ services. Subsequently, this leads to lower profitability for our company.
The Threat of new Competitors (External)
With the continuously rising popularity of low-cost air travel, we recognize that the degree of competition within the industry will increase, thus reducing profits for our company and old rivals.
Competitive Profile Matrix
International
Currently, our company predominantly operates within the United States’ borders, and there are only several international destinations that we cover (including Mexico, El Salvador, Costa Rica, and Honduras). We are planning to expand our operations to other international locations, including Canada and South America, to offer our customers more opportunities for low-cost air travel.
External Factor Evaluation Matrix
When it comes to evaluating our external factors that influence our business condition, we consider several characteristics, such as economic, social, legal, and political forces that shape the external environment. The highest weighted scores for external characteristics that present opportunities for our business include interest rate reduction, increases in the number of airports, and insurance against financial loss (refer to Appendix I). Partnership, technological development, and bond rate increase fall under the category of opportunities of the medium-weighted score. Lastly, the lowest weighted scores are for such opportunities as governmental support, consumer trust, and a rigid economy. Threats that can inhibit our company’s operations include fluctuating fuel costs, war, international threats, privatization, and labor issues. The most threatening external factors include industry competition, inflation rates, new entrants, decreases in interest bonds, and increases in interest rates.
Consumer Characteristics and Behavior
The low-cost airline sector had grown dramatically since the 1990s when Ryanair airlines started operating as a low-cost carrier (Thomas, 2014). Consumers’ demand for affordable travel by air increased, encouraging airlines such as ours to reduce their prices and extend seat capacity. While customers were previously put off by low-cost travel that allows practically no baggage, currently, customers of our airline are willing to compromise quality for affordability. Therefore, our company relies on the interests of consumers towards cheaper traveling options and thus rarely bothers with the goal of achieving customer satisfaction. According to Arbor (2017), customer satisfaction has never been a goal for airlines, with which our company has agreed. However, our company has been ranked the least in customer satisfaction surveys for low-cost airlines, which currently presents a significant problem for us. Not only low satisfaction rates of our customers limit our profits but also present more opportunities for competitors.
Strategic Direction (Past and Present)
Past
We are proud to state that we have managed to achieve a low-cost leadership strategy that allows us to efficiently utilize our aircraft, operate a cohesive fleet, and subsequently reduce operational and maintenance costs as well as convenient scheduling of flights.
Present
Our present strategic direction relates to achieving a continuous reduction of operational cost per seat mile and provide our customers with a broader range of destinations across the United States and internationally. As our company has undergone some changes in management, our present direction will change slightly. For example, we will continue the capacity extension at a slower pace. We will also discover and capture unserved markets instead of targeting the most significant destinations (Schmidt, 2016). Lastly, we will focus on the reliability of our operations and improve customer satisfaction.
Problem/Issue Diagnosis
With the competitiveness in the industry of low-cost air travel increasing each day, we are proud to announce a modest increase per share in the second quarter of 2017 (Levine-Weinberg, 2017). Nevertheless, our company acknowledges that the increase could be higher; we have experienced a rise in cancellations of low-cost flights at the beginning of May due to the disputes between our management and pilots employed at our airlines. Therefore, the first strategic issue relates to improving relationships between employees and the higher management.
Another issue for consideration is that our company has ranked last in customer satisfaction surveys for three years in a row (Fox News, 2017). Because we attempted to maximize the seat capacities of our airplanes, we have compromised on quality and baggage options while offering the lowest prices possible. Therefore, we consider it a challenge to invest money and time to improve our services’ quality without increasing the prices on our plane tickets.
List of Alternative Solutions
To address the issue of poor relationships between our management and the team, our company can provide various opportunities for pilots and the administration to interact more. We can achieve this through seminars, workshops, and training programs targeted at improving individual and collective communicative skills. Since our pilots’ salaries seem to be the key issue regarding their dissatisfaction, our duty lies in collaborating with the pilots’ union to negotiate future wage increases (Isidore, 2017).
If to develop alternative solutions based on our company’s strengths, weaknesses, opportunities, and threats, several categories of solutions come into play. As to Strategic Options (SO), we are first planning to extend the family of our loyal employees by adding more destinations on our route map, thus offering our customers more options for low-cost travel. Second, we will use our information systems to gain consumers’ trust and monitor the quality of our services. Through exercising or critical principles of organizational structure and development, we will seek partnerships with other carriers and facilitate governmental support to improve our operations.
To minimize the previously identified threats (refer to Appendix J), our company should use our strengths (ST). International treats and war are threats that we can minimize through the optimization of our organizational culture to plan our operations and evaluate current political instabilities that could prevent us from running smoothly. We can mitigate the threat from competitors and new entrants (refer to Appendix K: -365% of profits due to the threat of new entrants) to the market by improving our passenger land factors and offer the lowest costs per available mile and seat, which will make customers choose our airline over others.
When it comes to strategies that can minimize our weaknesses through using opportunities to our advantage (WO), our company will consider gaining consumers’ trust to thus extend the list of destinations due to the rising demands of customers. Technological development in the industry can allow our company to introduce cargo operations and improve the quality of content and services available on our flights.
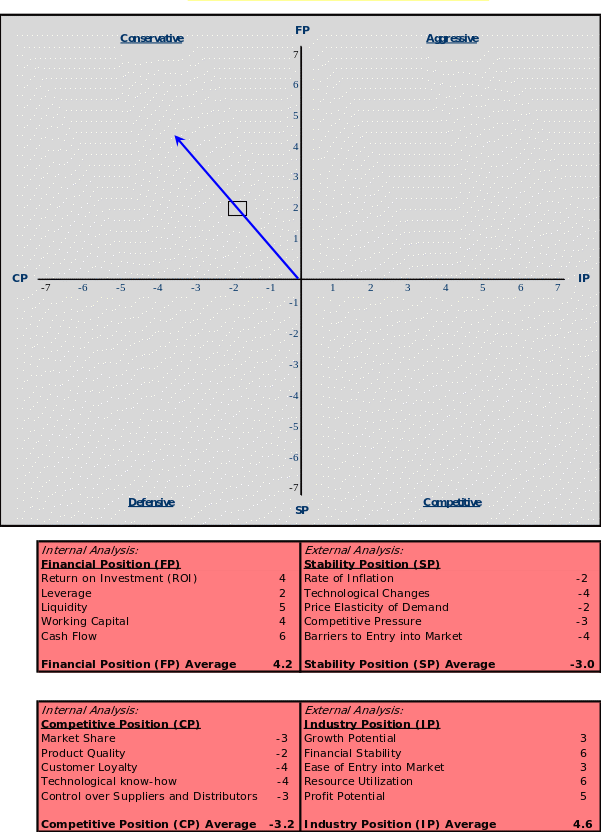
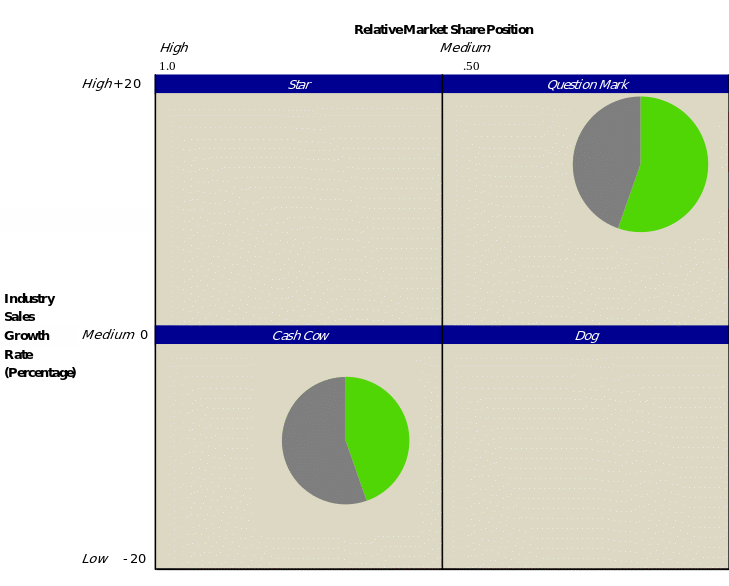
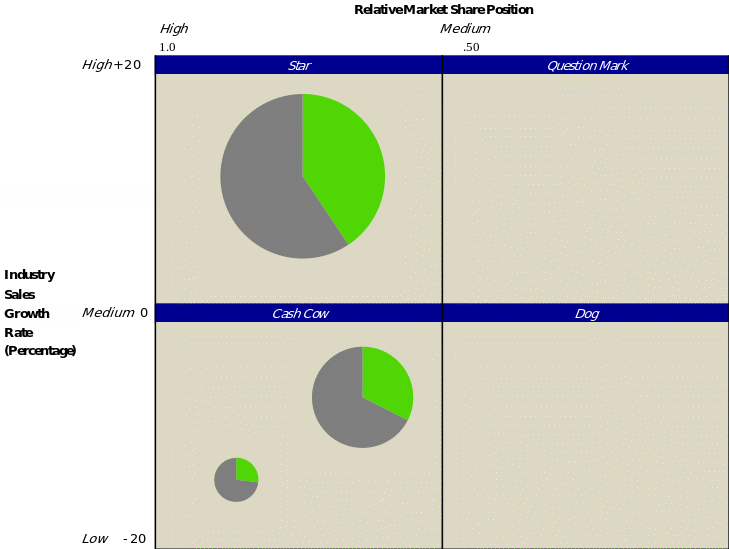
Lastly, strategies that reduce weaknesses and eliminate threats (WT), our company can improve our labor processes for decreasing staff turnover, especially with regards to the higher management and such essential workers as pilots who have protested their wages. We will improve our market strategies by catering to the specific segment of consumers that can choose our competitors over our services. Based on our company’s BCG matrix (refer to Appendix K), our services fall under the “cash cow” category. This means that our airlines offer services in a market of low growth and high shares, thus presenting extensive opportunities. Our Space Matrix (refer to Appendix M), our competitive and financial positions are conservative, which means that we lack competition efforts and stability to optimize our operations and the situation on the market.
Alternative Solutions’ Evaluation
Based on Appendix N, “Quantitative Strategic Planning Matrix,” the alternative solutions that our company may implement consist of opportunities, threats, strengths, and weaknesses. We have assessed total attractiveness scores (TAS) for marketing development and financial planning efforts. We can report the highest TAS scores for rising bond rates, technological development, and increasing the number of airports under the category of marketing development. Under the financial planning TAS scores, the highest are expanding the number of airports, ensuring against financial loss, raising bond rates, and facilitating the partnership.
Solution and Implementation of the Decision
Even though our company currently has the lowest statistics on the operating costs per passenger compared to any other American low-cost airline carrier, we are still dealing with the severe pressure and competition from our competitors. After carefully considering the alternative solutions to the fundamental problems our company faces, we decided to tool into the customer intimacy strategy to reinforce the loyalty of prospective customers to our company. We recognize that our management will need to conduct a revision and an overhaul of our customer service practices to improve relationships with our customers who have shown low satisfaction with our services. The customer intimacy strategy will allow us to assess potential customers’ demands as to the improvement of in-flight services and the expansion of destinations. It has shown that increasing the number of served airports is the highest in attraction rates.
Another recommended solution for enhancing our company’s operations is the development of a grand strategy for determining the course of action regarding reaching the long-term objectives. To be specific, our management should consider implementing a strategic alliance strategy to expand the selection of products and services for our customers. We think that such a strategy is the most appropriate in our case since it is more cost-effective than spending large amounts of money on advertising campaigns. Partnerships present great opportunities for us here at Spirit Airlines because they will provide unique perspectives on customer experiences without having a negative influence on our costs.
Current Profile
Here at Spirit Airlines, our net income for the first quarter of 2017 was $35.6 million if to exclude special items. We ended the first quarter of this year with “unrestricted cash, cash equivalents, and short-term investments of $918.4 million” (“Spirit Airlines reports first quarter 2017 results,” 2017, p. 1). Our total operating revenue for the first quarter of this year was $591.7 million, which is an increase of 10% if to compare this result with the total operating revenue for the first quarter of 2016. Currently, we do not capture destinations in all states; however, we are planning to expand our operations and extend the number of airports. We will continue to follow our missions statement to offer “the lowest total price to the places we fly, on average much lower than other airlines […] We help people save money and travel more often, create new jobs and stimulate business growth in the communities were serve” (“About Spirit,” n.d., para. 1). Nevertheless, we have a long way to go regarding optimizing our operations and offering our customers the highest quality of services.
References
About Spirit. (n.d.). Web.
Arbor, A. (2017). ACSI: Low-cost carriers lead legacy airlines for passenger satisfaction. Web.
Cederholm, T. (2014). Must-know: External factors that influence the airline industry.Web.
CNBC. (2017). US second quarter GDP meets expectations. Web.
Corporate governance guidelines of Spirit Airlines, Inc. (n.d.). Web.
DailyFX. (2017). Crude oil. Web.
Fox News. (2017). Spirit Airlines ranks last in customer satisfaction survey for third year. Web.
Isidore, C. (2017). Spirit’s customers are mad. Its pilots are furious. Web.
Levine-Weinberg, A. (2017). Spirit Airlines incorporated earnings: Pilot problems undermine profit growth. Web.
Matthews, S. (2015). Spirit Airlines: An introduction to a low-cost pioneer. Web.
Schmidt, A. (2016).Spirit Airlines: New CEO, new strategy. Web.
Spirit Airlines reports first quarter 2017 results. (2017). Web.
Spirit Airlines SWOT analysis, USP and competitors. (2017). Web.
Spirit Airlines, Inc. (2015). Annual report pursuant to section 13 or 15(d) of the Securities Exchange Act of 1934. Web.
Spirit Airlines, Inc. (2017). Proxy statement pursuant to section 14(a) of the Securities Exchange Act of 1934. Web.
Thomas, N. (2014).From budget to business: How the low cost airlines are winning us over. Web.
Trading Economics. (2017). United States disposable personal income. Web.
Appendix A: Corporate Governance Committee Representatives

*Table obtained from company Corporate Governance segment on website citation: (Spirit Airline Corporate Governance) *
Appendix B: Income Statement and Statement of Cash Flow
Appendix C: Balance Sheet Statement
Appendix D: Financial Ratio Calculations

Appendix E: Organizational Chart
Appendix F: Internal Factor Evaluation Matrix (IFE)
Appendix G: Porter’s Five Forces Model

Appendix H: Competitive Profile Matrix
Appendix I: External Factor Evaluation Matrix (EFE)
Appendix J: TOWS Matrix
Appendix K: BCG Matrix
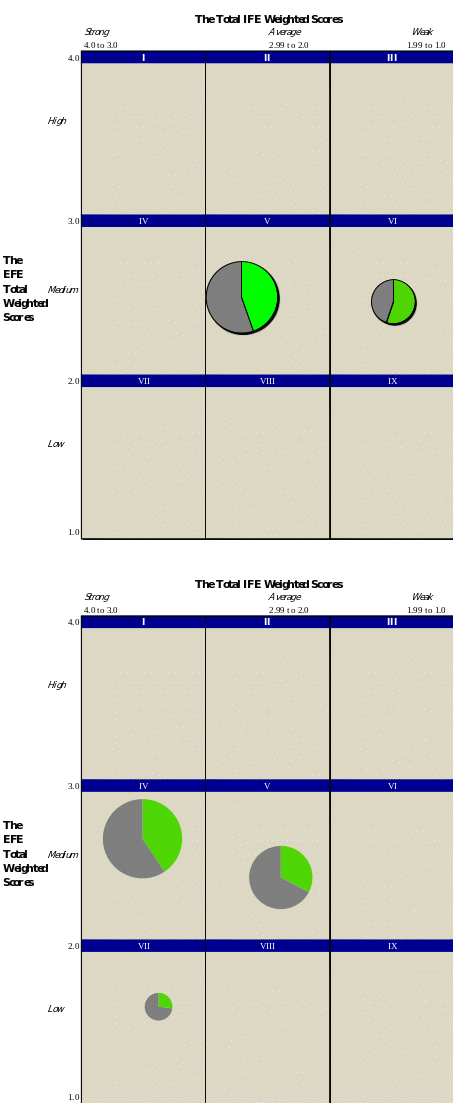
Appendix L: IE Matrix
Appendix M: Space Matrix
