Evaluating a company’s progress based on its key financial ratios as well as detecting any hiccups in the firm’s operational system with the help of the specified data type is quite tricky, as the forecast for the future progress of the organization is likely to be rather approximated. Nevertheless, a detailed analysis of the recent ratios will allow for the identification of the current tendencies of the organization, as well as the sustainability rates that its strategies allow maintaining.
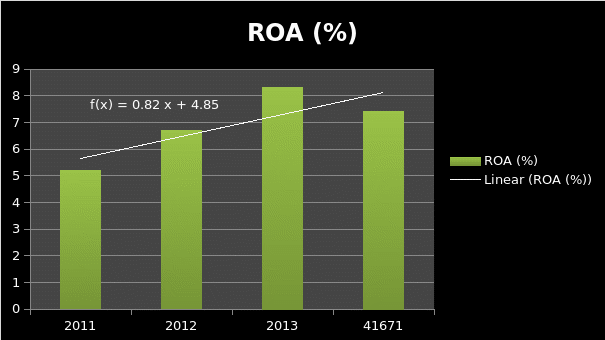
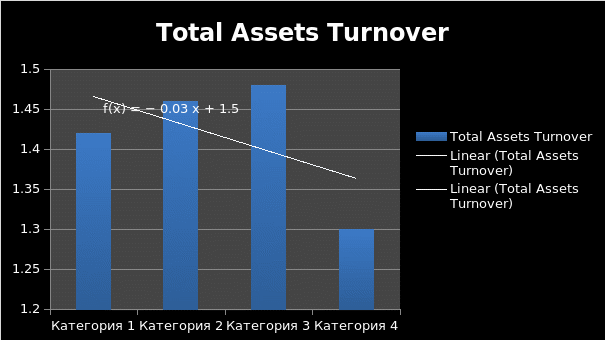
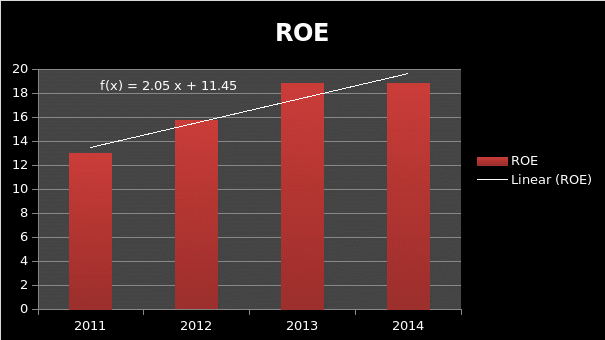
A closer look at the financial ratios, which can be calculated based on the entrepreneurship’s four-year record, will reveal that Savills, Inc. has been experiencing a mild increase in its performance rates (“Report and Accounts” par. 1). According to the existing data, the company’s return on equity remains the same, yet its ratio of total liabilities to total assets reached 60.8%, increasing by 9.16% compared to the statistical data from the previous year. The same can be said about the indicators such as the current ratio of the organization, which has dropped to 1.1% in 2014 and seems to tend to decline.
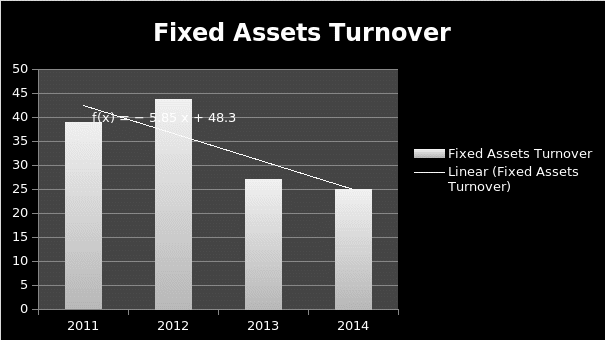
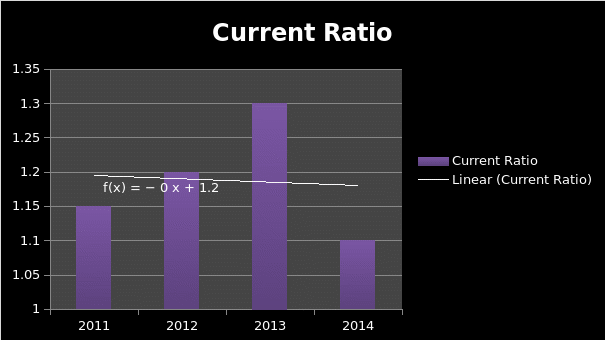
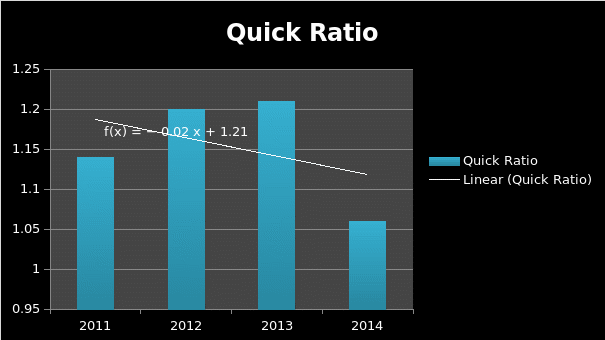
Therefore, it can be assumed that the general forecast for the company can be deemed as rather disturbing (Samonas 37). One must bear in mind, therefore, that the organization’s current ratio and quick ratio have been declining over the past year. Indeed, as the graph below shows, the firm has been experiencing a barely significant, yet quite obvious slowdown in its progress. As the chart below indicates, the organization may reconsider its current strategy regarding the use of its resources.
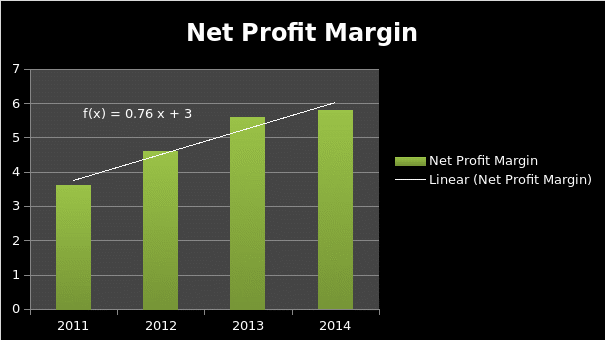
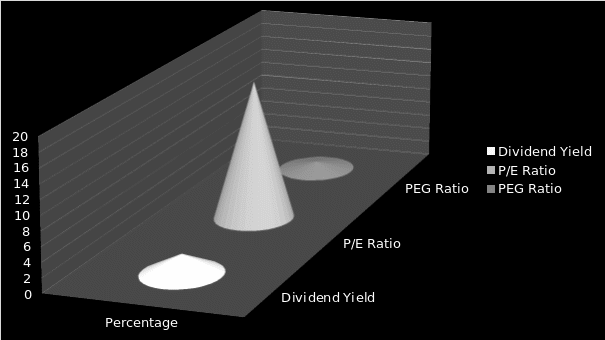
Addressing the issues in question, Savills, Inc. should consider the option of incorporating a sustainable approach toward the distribution of the organizations’ financial assets. Seeing that the decline in the firm’s short-term liquidity means the drop in Savills’ ability to pay its short-term debts in an appropriate manner (Strawser 450), it can be assumed that the firm may require a more elaborate strategy concerning the allocation of its funds (Wahlen and Baginski 823).
Likewise, the fact that Savills has recently experienced a decline in the fixed assets turnover points to the need to develop a sustainable strategy for putting its fixed assets to proper use. Moreover, the negative tendency in the designated area shows that the organization’s fixed assets may be under the threat of depreciation. Particularly, Savills, Inc. should consider the possibility of sustaining its property and equipment in a better condition by improving the maintenance services (Ernst and Hacker 185). Alternatively, a consistent upgrade in the aforementioned assets should be viewed as a possibility; however, the strategy I question is likely to be quite expensive and, therefore, fail to serve the purpose of reducing the firm’s costs (Soyka 11).
As the analysis of the issue has shown, Savills, Inc. has been experiencing steady progress over the past three years; however, the disturbingly low rates in its fixed assets turnover, the current ratio, and the quick ratio, which the firm delivered in 2014, indicates that the entrepreneurship could benefit from a more sustainable strategy concerning the distribution of financial resources. As soon as all the departments of the company are financed and substantive funds are provided so that Savills, Inc. could pay its liabilities, a significant increase in the entrepreneurship’s productivity is expected. As a result, the firm is likely to attain a higher level of success with the target customers.
References
Ernst, Delmar and Joachim Hacker. Applied International Corporate Finance. Munich: Vahlen, 2012. Print.
Report and Accounts 2014, 2015. Web.
Samonas, Michael. Financial Forecasting, Analysis and Modelling: A Framework for Long-Term Forecasting. New York City, NY: John Wiley & Sons, 2015. Print.
Soyka, Peter A. Creating a Sustainable Organization: Approaches for Enhancing Corporate Value Through Sustainability. Upper Saddle River, NJ: FT Press, 2013. Print.
Strawser, Cornelia. Business Statistics of the United States 2012: Patterns of Economic Change. Lanham, MD: Bernan Press, 2012. Print.
Wahlen, James and Stephen Baginski. Financial Reporting, Financial Statement Analysis and Valuation: A Strategic Perspective. Boson, MA: Cengage Learning, 2010. Print.