Strategic marketing involves appraising the market trends and evaluating the market potential. The business analyst identifies the risks, potentials, strengths and weaknesses of the business from the potential marketing plans. Strategic market also involves understanding the customers’ behaviour in terms of buying the company’s products and the effects of a shift in government regulations (Drummond, Ensor and Ashford 7; Proctor 34).
The presence of different levels in an organization, gives different strategic marketing plans. The corporate strategic marketing involves competitive analysis, environmental shifts, and market dynamics. The marking aspect involves identifying the current happenings in the market place and formulating programs that will help the organization remain competitive (Drummond et al 10; Proctor 37).
A table of strategic business unit in a sales market
The table above shows the summary of percentage increase in sales as of 2013. The market had an increase in total sales in the year 2013. The reason for the increase is due to increase in strategic business units of car, drinks and banks. Significant decrease of sales is present in strategic business units of cells, and pharma.
A table of car market in the strategic business unit
The car market shows a significant increase in sales from the year 2012 to the year 2013. According to the market share columns, CBA has gained market share from 2012 to 2013. On the other hand, the Toyota brand has lost market share for the year 2012 to the year 2013. It is easy to predict the gain or loss of market share from comparison between the total market, growth and the individual car market brands.
For example, it is justified to state that CBA will gain market since its growth rate is higher than that the total growth rate. The Toyota brand should have a higher growth rate than the total growth rate of car market in order to have an increase in market share. Toyota could increase its market share by using competitive prices for its products. It could also focus on new markets across the world.
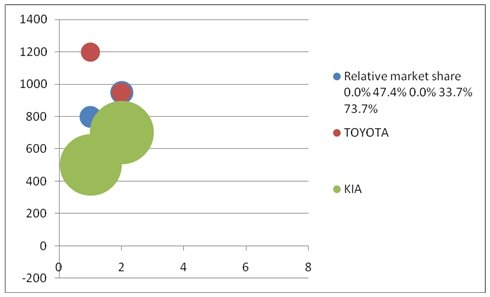
The chart above shows the relative market share of the car market strategic business unit.
The table below shows the market growth and market share of cell market from 2012 to 2013.
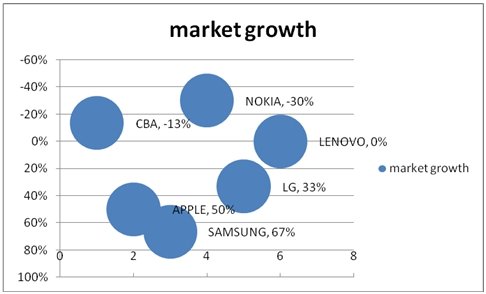
The strategic business unit of cell market show a twenty-one percentage growth increase. The reason for market growth could be increase in cell phone products in the market and improvement in technology. CBA and Nokia have negative growth rates hence low market share in the year 2013.
The cell products of CBA and Nokia may not have evolved to attain the current technological standards. In addition, the prices of the two products may be high that the average earning individual cannot manage to buy. Therefore, the firms could increase their sales by focusing on pricing strategies that could attract and retain customers.
In fact, Nokia products have a good market reputation with regard to quality, but their prices are relatively higher than most of the prices of similar products marketed by other companies. The highest market share increase is Samsung product. The market share increase could be due to large number of products from Samsung Company and subsidised rates of the retail price (Drummond et al 21; Proctor 67). Lenovo has not changed the market growth but overall has gained market share.
The chart below represents the growth rate bubble graph of the cell market Strategic Business Unit.
Drinks market
A table of market growth and market share of drinks market
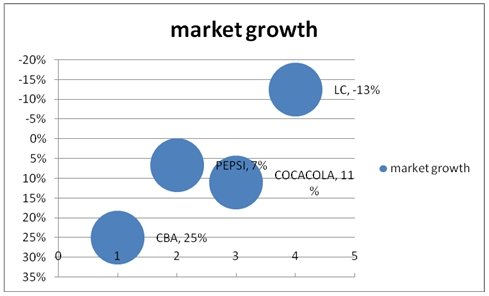
The highest growth market is CBA. The Coca-Cola Company has gained the market share by 11.2%. Coca-Cola Company has stiff competition from Pepsi due to market price and attractive packaging of the Pepsi Company. Coca-Cola Company should refocus on its marketing and distribution channels across the world. Also, it could concentrate on competitive pricing strategies that could be utilized to outdo its competitors in the beverage industry.
LC has lost market share and it is easy to predict from the market growth column. LC has a decrease in the market growth may be due to lack of capital and attractive packages of their products. Taste and preference of the consumers has an effect on the fluctuations of the market price (Drummond et al 25; Proctor 60). LC Company could increase its market share by focusing on new markets in emerging economies, for example, Africa and China. It could also use pricing strategies to attract more customers to buy its drink products.
The graph below shows the market growth of Drinks strategic business unit
Electrics market
Table of market growth and market share of electric strategic business unit
The table above shows a total of 5.97% growth increase from the year 2012 to 2013. The market increase on electrical is minimal because of market price and durability of the electronics. The table shows a negative growth on Sony products and high percentage increase in LG products.
The three electronic products have gained the market share of 2013 showing significant increase in the preference of electronics. The consumers do not have a preferred choice of electronic because the sales of all the products are almost equal. Sony has significantly lost the market share in 2013 due to decrease in its advertisements of the available products. The business management should strategize on customer, competition and corporation (Homburg, Kuester and Krohmer 50; Proctor 65).
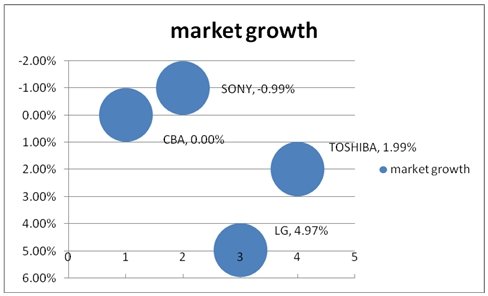
A graph of electric market growth
The graph shows a significant change in the LG and Toshiba electrics in the market. The business merchandize has a role of incorporating marketing strategies in order to improve the sales of Sony electric products. The bubble chart shows the percentage of the market growth of each product hence easy to predict the likelihood of market increase.
A clear marketing definition gives an advantage to the sale of products in the market. The products in the market should have fair competition and allow success of competitor business (Homburg et al 45). It is essential for the marketing strategy to consider when to compete and allow market entry of new products.
The table above shows the pharma strategic business unit growth rate and market share.
The pharma industry is showing significant decrease in its growth. The major reason for decrease in growth is increase of generic and counterfeit products in the market. The pharma companies like Pfizer and GSK are the innovators of major pharmaceutical products. The companies spend more time and resources in drug development than in drug marketing.
The advantage of these pharma companies is the significant increase of sales after releasing a new product in the market. Although there is a decrease in growth rate of pharma products, the companies show gain in market share in 2013. The GSK Company shows highest market share in 2013 due to popularity and reliability of its products (Homburg et al 78).
On the other hand, Jamjoum Company has low market share in 2013 because it is a new company in the corporate pharmaceutical marketing industry.
The pharma companies that have recorded negative growth trends could increase their sales by focusing on innovative products and strategic marketing approaches. For example, a company like the GSK should refocus on its marketing approaches for its original pharmacological products.
It should deploy its medical representatives across the world and concentrate on new markets. The medical representatives should be retrained on marketing and presentation skills that would enable them to increase markets of their respective firms.
New markets could provide new growth avenues for the pharma companies. Companies that have recorded negative or stagnant growth sales could also improve their sales by using low pricing strategies, which could enable them to sell more units at lower prices over a shorter period of time.
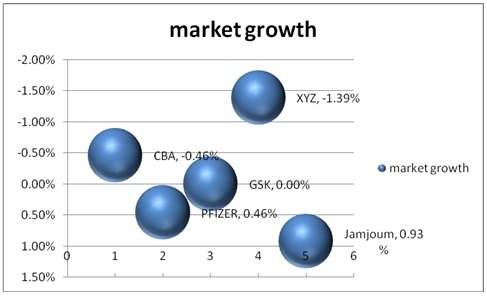
A graph of pharam market growth
The graph shows a positive market growth on Jamjoum Company and a negative growth on XYZ Company. The Jamjoum Company is a new entry in the market hence getting a first preference in terms of testing its products. The significant growth of Jamjoum could also be attributed to low prices and attractive packaging of the pharmaceutical products.
The methods and standards of marketing also matters in the pharmaceutical industry. GSK is stagnant in its growth from the year 2012 to 2013 meaning that there was no significant sales increase of its products. The GSK Company could not have attracted many customers due to high prices of their products and also lack of new products in the market (Homburg et al 68).
Works Cited
Drummond, Graeme, John Ensor, and Ruth Ashford. Strategic Marketing. Amsterdam, Netherlands: Elsevier Ltd, 2010. Print.
Homburg, Christian, Sabine Kuester, and Harley Krohmer. Marketing Management: A Contemporary Perspective. New York, NY: McGraw-Hill Higher Education, 2009. Print.
Proctor, Tony. Strategic marketing: an introduction. London, United Kingdom: Routledge, 2013. Print.