Introduction
An Information System’s principal function is to operate as a lever for the organization’s strategy, enhancing the latter’s ability to perform its managerial, operational, and competitive functions. Integrating the student database with university information systems and strategic planning is a top priority. The University’s complex information needs are met by a robust student database that can meet the varying requirements of ancillary computer-based IS systems.
For this reason, ISs are now fundamental to every viable corporate strategy. They are crucial to a company’s success since they help it synergize its competitive edge and better withstand the challenges posed by the market’s myriad forces.
Phase 1: Requirement Analysis
Problem Definition
The project’s overarching goal is to build a student-centric management information system. At the very least, two tiers of users can be expected, and administrators can enter data on students, such as their names, addresses, phone numbers, and e-mail addresses (Samadbeik et al., 2020). The administrator can quickly and easily produce three reports using the buttons provided.
The project’s overarching goal is to create a centralized database for student information. The registrar at the CCP Vocational Training Institute can use the Student Database System to see, amend, and update information about individual students (Samadbeik et al., 2020). It also speeds up the processing and printing of student transcripts and grade reports.
Issues
Software Requirements
Apache will act as the web server, MySQL will power the database, and HTML, CSS, and Javascript will form the basis of the system’s user interface and front end. The user interface will be improved with the help of Bootstrap and JQuery (Rajaram et al., 2020). A recent web browser version that supports JavaScript currently only works in English.
Needed Hardware Requirements
Laptops and mobile phones with internet access. System Requirements: 2 GB hard drive, 512 MB RAM, Windows 7/8.1/10 Clicking and Typing. The following functional requirements must be met: a form’s validity must be verified before it is submitted, and the administrator cannot add a new course to a student’s account before the current study has concluded (Rajaram et al., 2020). The only users with the ability to manage courses and other data will be the administrators.
Non-Functional Requirements
If a field fails validation, it must be highlighted, and the interface must be simple and intuitive. The page can be loaded quickly enough, even with a mediocre internet connection (Rajaram et al., 2020). The website’s various parts will have logical organization, system sensitivity, presentational tone, typeface, color scheme, and how well the system works. The system should be simple to learn and remember, have data and record backups, have systems that can be upgraded, and have system scalability.
Objectives
Building a trustworthy Student Information System is the key objective of this project. The initial goal of this research was to provide a mechanism for digitally keeping track of students’ information. The project aims to build the system and put it through its paces through testing and validation (Medlock et al., 2023). Therefore, convenient and secure warehousing, easy access to previously stored data and documents, the maintenance of accurate books and records, fast responses to random questions, and aid in noting findings.
Requirements
Needs from a Functional Standpoint are examples of system functionality requirements: The system must enroll and re-enroll students and allow for the addition and editing of student data (Medlock et al., 2023). The students’ record system’s educational offerings require modernization and expansion. Students and faculty must be able to use the system, which must be accessible at all times. Student work must be uploaded and submitted electronically; the system requires an associated pricing scheme.
Constraints
The study was hampered by persons taking too long to respond to the researcher’s introductory letter, filling out questionnaires, and being too busy to meet with top management. People hesitate to give honest replies for fear of getting fired; therefore, they try to avoid the question (Medlock et al., 2023). One limitation of the study is that non-teaching staff may have hired new administrators by the time the research was conducted, rendering them unable to provide the necessary information.
Description of the Purposed System
In our suggested system, students can enter their information, resulting in decreased administrative and instructional costs. One more perk of the system is that it is simple to change a student’s profile or remove them entirely if they are no longer needed (Zhang et al., 2022). Students’ grades are stored electronically in a central database that can be accessed anytime.
Several benefits exist for our proposed system. Advantages include a “user-friendly interface,” “fast access to the database,” “less error,” “more storage capacity,” “a search facility,” “a look and feel environment,” and “quick transactions (Zhang et al., 2022).” Figure 1 below shows the logical model of the students’ record system being designed, all the sections required in the system model, and Figure 2 represents the class diagram.
Student
Lecturer
Lecturers can make online changes to the attendance records, and each teacher is responsible for keeping daily attendance statistics for each class they teach (Ogundepo et al., 2019). The lecturer has full authority over the attendance records for the course, which can only be viewed by the lecturer, printed out in reports, and edited by the professor responsible for teaching that particular class.
Student
A student can only look at their attendance records. Instructors can be asked to update attendance records in the system. If students miss class but produce documentation explaining their absences, warning letters will be sent out from the Office of Academic Affairs if the proofs are not submitted on time (Ogundepo et al., 2019). In addition to this duty, the ARS will be in charge of composing the obligatory warning letters.
Administrator
In this scenario, the Academic Affairs Office will serve as the administrator, and data will be made available to the administrator. The administrator can use ARS to update the records of all instructors and students and send out the warning letters indicated above (Ogundepo et al., 2019).
In addition to viewing the attendance data daily or monthly, they can also print reports that are processed in real-time. Web-based technologies such as PHP, a MySQL database, and the Apache web server create ARS throughout the physical design process (Ogundepo et al., 2019). The logical design of the ARS is used to inform the creation of its user interfaces, which in turn are based on the procedures that the system will carry out.
Data Flow Diagram
Context Diagram
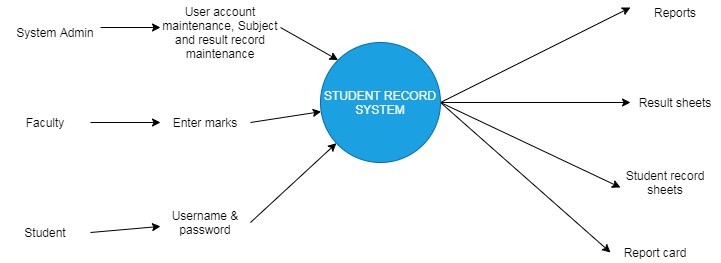
The “flow” of data in a Student Information System can be graphically represented using a Data Flow Diagram (DFD). Data processing can also be depicted with a flowchart. The DFD illustrates how the system interacts with its environment (Chung et al., 2019). More information about the modeled system is revealed after the “explosion” of this context-level data flow diagram (DFD).
A data flow diagram can represent data movement through an information system (Chung et al., 2019). Data Flow Diagrams depict the flow of information as it undergoes the various operations that make up the system, and this is well shown in Figure 3 below, which represents the context diagram.
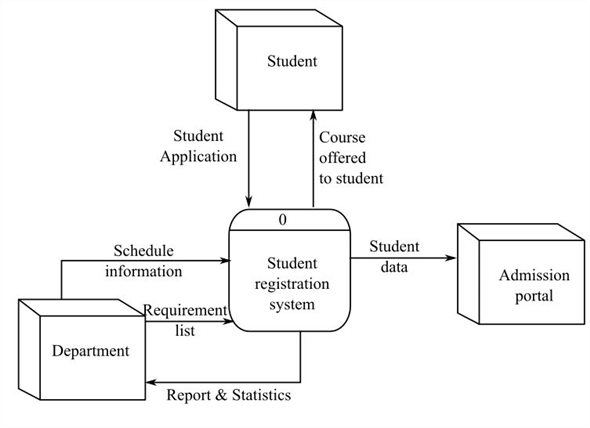
Diagram 0
A student’s application includes information on who they are and what they hope to study. Before allowing a student to enroll in a course, universities ensure they meet the prerequisites and other requirements (Akçapınar et al., 2019). If offered, the student enrolls in the class, and the institution verifies the enrollment by mailing a verification letter. The student will be informed through the letter if the desired course is complete, as shown in Figure 4 below, showing diagram 0.
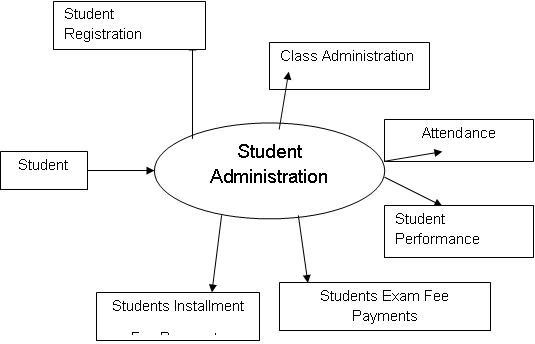
Diagram 1
Enrolling in a college course is a shared experience across students at different institutions. For the course registration data flow diagram at the first level of detail, there is only one sheet and all the columns (Akçapınar et al., 2019). Dig deeper into the sub-steps that comprise one of the original data flow diagram processes by adding new data flows and data stores. Identify the assumptions made to complete the second-level graphic and the “hidden” aspects of the registration process.
Outputs/Inputs/Performance/Security
The system’s primary purpose is to provide a practical means of locating train information and routes within the existing infrastructure. First, the user inputs the desired train and origin/destination codes to obtain the desired information. Second, the data is processed to extract train information (Foster et al., 2020).
Third, space is needed to store the data retrieved from the database. Administrators are the only ones who can sign up new students for classes. They can edit a student’s profile and delete or reactivate their account at their discretion (Foster et al., 2020). It is important to note that only students can edit their profiles and will not be allowed to alter any other data, either their own or another student’s.
Phase 2: System and Database Design
User Interface
To conceptualize a commercial relationship, one must first gather information, assess that information, record it, and then verify it. It identifies the application’s users and their needs, as well as the business needs of the program, and ultimately results in a solution for the business (Foster et al., 2020). There should be a strong focus on the idea that business needs drive application development, as all applications are created to address business challenges. Any design decision can be traced back to a real-world business issue and set of criteria.
The creation of these usage scenarios is what drives the conceptual design process. These examples illustrate how a user envisions a business issue being resolved. From a conceptual perspective, the focus is on identifying the underlying cause of a business issue and then deducing a course of action that addresses that issue while also satisfying the end users’ expectations (Zhang et al., 2019). The solution’s behavior is derived with the end-user in mind first and foremost.
The reality that systems exist to support the business is emphasized from the outset by focusing on the activities of the business rather than on features of software development. It will be easier to keep the correct viewpoint throughout the development lifecycle if the user is the primary emphasis from the start of the project (Foster et al., 2020). Examples of such documents include grades, transcripts, class lists, student course schedules, medical records, financial information, and disciplinary files.
Data Design
Data Design is a method for deriving business organizational objects and supporting services from the context of actual user interactions. A Gravity Forms submission form may be used to enter data into the system, and WordPress has a custom post type for storing student data. The student database will subsequently be shown on the front end of your website in a table (Juhaňák et al., 2019).
In addition, this method provides a codified solution to the project team. The application is predicated on the idea that logical design must come before the system can be considered complete. Definition of the system, including its scope, the business entities involved, and other relevant components (Oates et al., 2022).
During the logical design phase, the interfaces to users and other systems are specified and designed. Defined are the boundaries that separate the many subsystems that can be found inside a system (Juhaňák et al., 2019). For the sake of decoupling system behavior issues from system implementation issues, rational design should be as technology-agnostic as possible.
Database Design
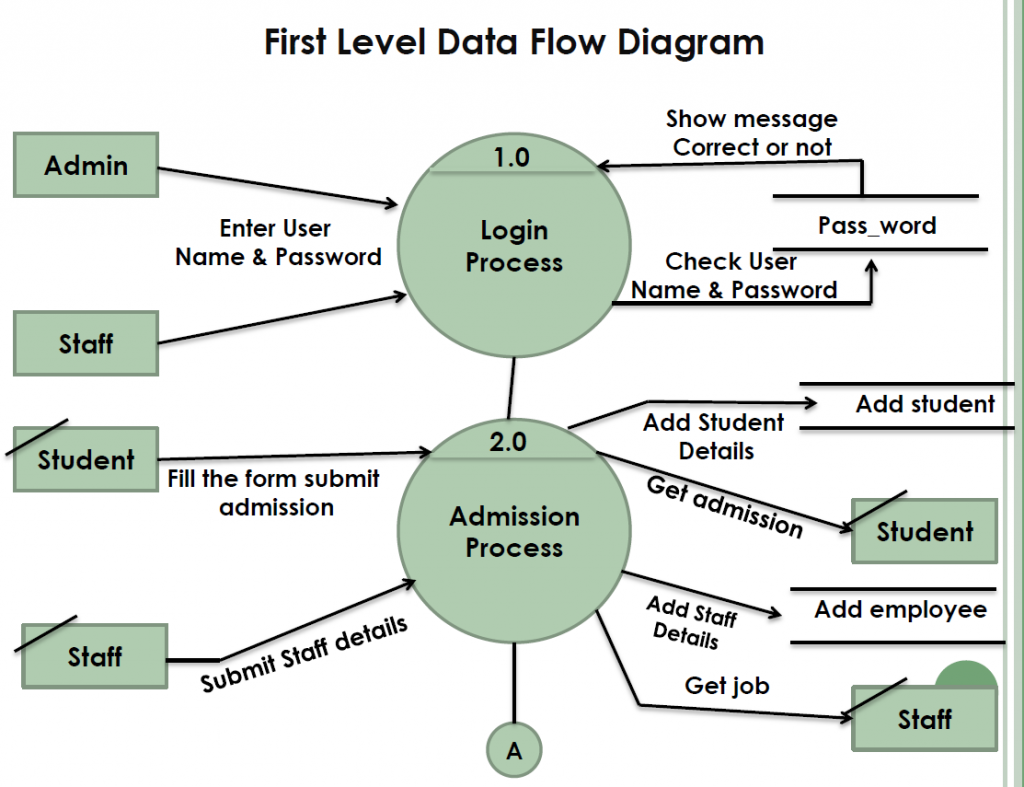
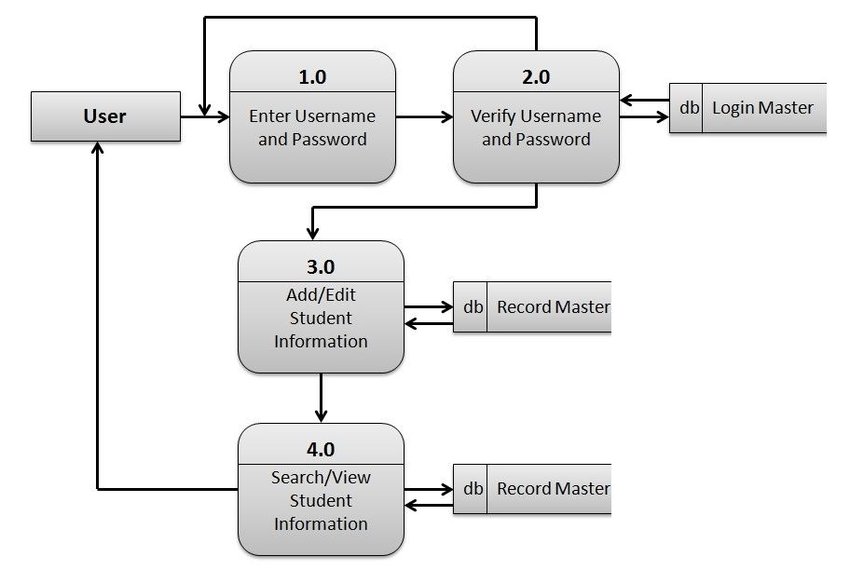
One way to visually depict the “flow” of information within a computer system is with a data-flow diagram (DFD). DFDs are not only useful for data modeling but also for visualizing data processing (structured design). Data flows from an external source or an internal store to an internal or external sink via an internal process on a DFD (Juhaňák et al., 2019). To know when something will happen, in parallel, or even if it happens, data will not find such information in a DFD.
A data flow diagram, unlike a flowchart, displays the types of data that will be input into and produced from the system, as well as its sources, destinations, and storage places. Figure 6 below shows the user database diagram and the flow of the user, technique, and student report, and Figures 6 and 7 below represent the student database.
User
Database table


- The first step in normalization is to create new files for each set of duplicate fields and give them unique keys.
- At this second normalization step, any non-key components completely characterized by means other than the complete key are moved to a new table. These non-key components often rely on a single digit of a compound key.
- Third-stage normalization allows for the removal of subset tables and duplicate data fields. Non-key data elements that appear in many virtual data element tables are considered redundant.
Normalization procedures
Unstandardized data: Student#
No recurrent subgroups; first normal form. In a table, each dimension should be a maximum of two cells wide.
Reduce redundancy as part of the second normal form.
Data that is not key-dependent is removed in the third normal form.
Student
Entity-Relationship Diagram
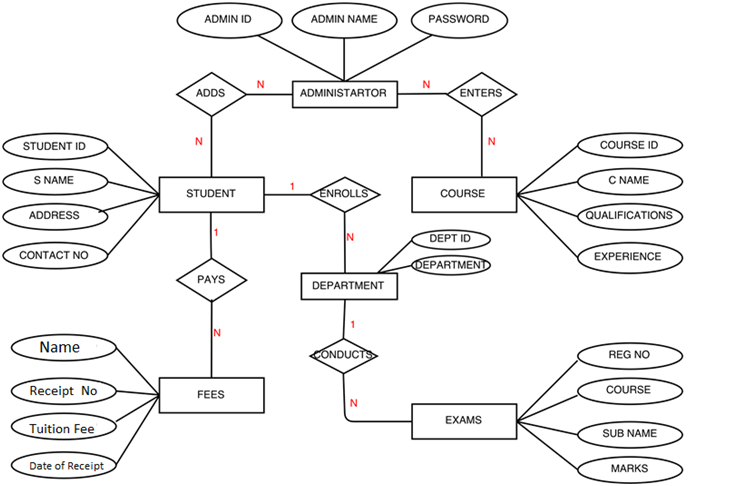
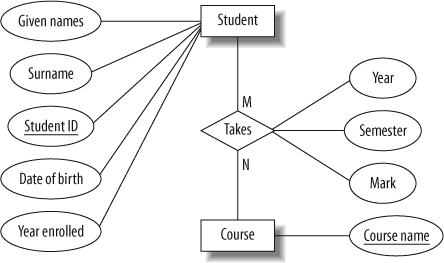
The Entity-Relationship data model is grounded in the idea that the real world can be broken down into a collection of more essential items or entities. The connections (or “relationships”) between them are such that an entity is a conceptually significant object within an organization; it is anything that exists and can be distinguished from other items (Azzahra et al., 2022).
Primary keys are attributes that, when combined, provide a unique identifier for each entity in an entity collection, as shown in Figure 10 below, showing the entity relationship diagram.
System Architecture
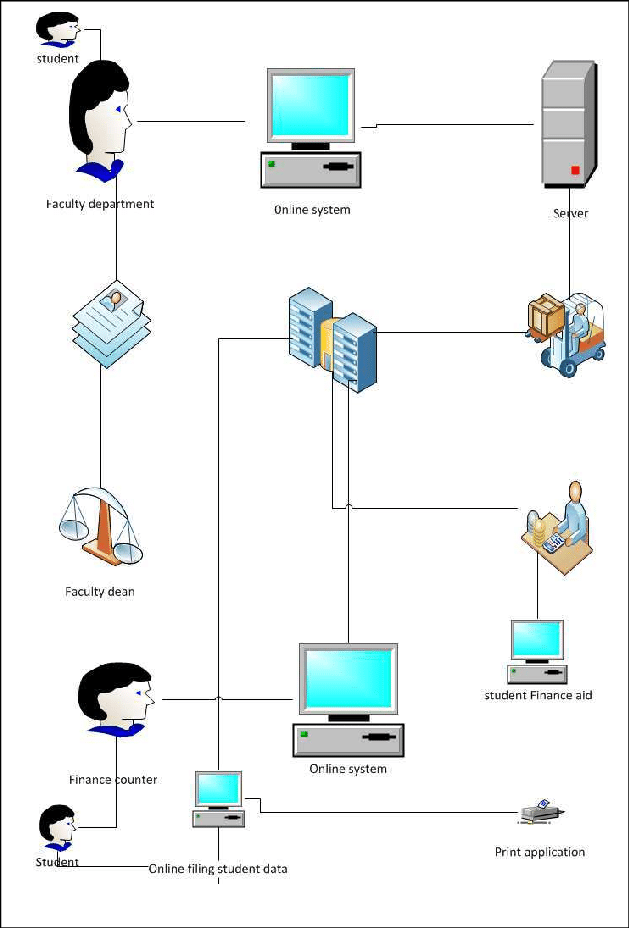
Regarding serving multiple users promptly, nothing beats the speed and efficiency of a well-organized database that stores related data with as little duplication as possible. The primary objective is to simplify and expand access to user data in a timely and flexible manner (Azzahra et al., 2022). When constructing a database, one needs to consider several different aims. The presence of redundant items perfectly illustrates an inefficient use of space.
The system can deliver contradictory results if multiple data versions simultaneously undergo various update stages (Oates et al., 2022). The capacity of a database to store data just once is a critical feature that helps eliminate data duplication and boost overall performance, shown in diagram 11 below, representing the system architecture.
Phase 3: Project Plan
Students’ academic records are accessible to approved staff through a centralized database and management system. It streamlines operations at the College and can be adopted by other educational institutions (Azzahra et al., 2022). The system keeps track of enrolled students, the courses and modules they are taking, and their final grades.
The registration database administrator maintains the data centrally and is accessed by academic staff and administrators across the event’s workforce, making this application a distributed application (Azzahra et al., 2022). The existing system would be service-oriented, creating a subset of its services available to external applications.
Activities
- Add Student Information: Collect information from the user and add a student to the roster. Each student’s roll number must be unique before they may be added to the list.
- Using the provided roll number, this function will retrieve the corresponding student record and display relevant information.
- Please search for a student using only their first name. This function will search for all students who share the specified first name and print their information.
- The purpose of this feature is to retrieve a list of all the enrolled students in a specific class.
- This feature outputs the system-wide tally of registered students, or “count of students.”
- A student with a specific roll number can be found using this function.
- This feature is used to update information about students. This feature does not require the user to enter new data into all fields; instead, they can update only the relevant information.
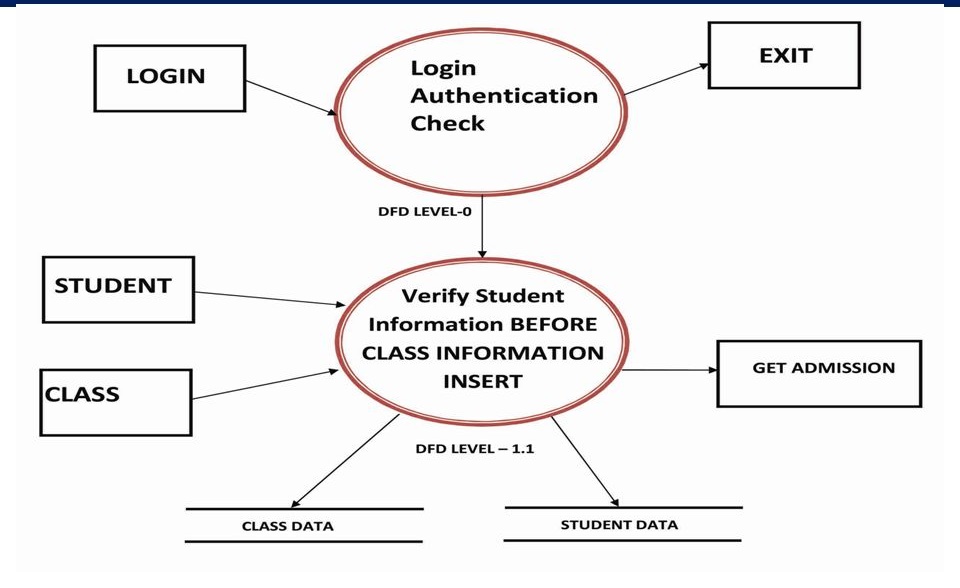
Figure 12 below shows the students’ project plan for the design.
Database Schema
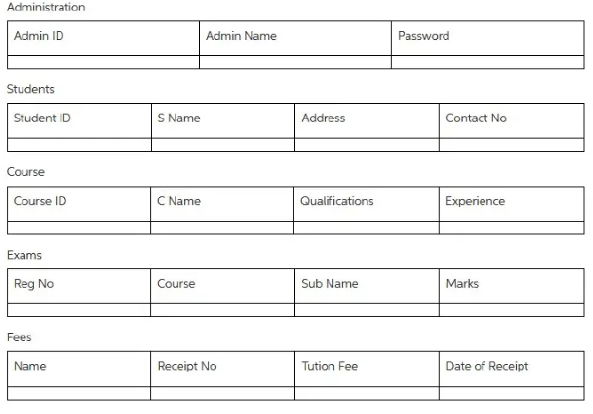
Figure 13 below shows the database schema of the project students’ record system.
Gantt Chart
An additional course can only be added for a student by the admin after the present study has ended. The administrators will be the only users who can manage the classes and other data (Azzahra et al., 2022). Only the student’s information can be changed, not any shared information. Other student accounts are hidden from view. All pages require authentication, so only logged-in authorized users will be able to access them. At a minimum, three reports should be accessible to the administrator.
Conclusion
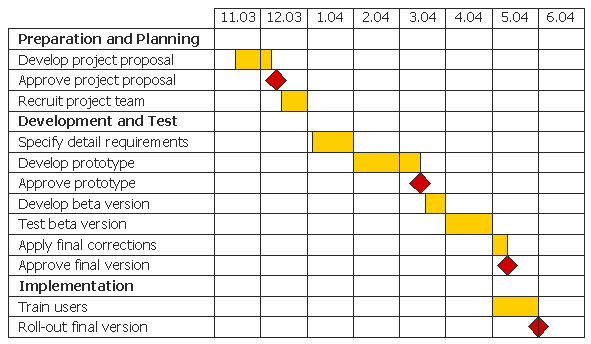
Student enrollment, course enrollment, module enrollment, and course completion are all tracked by the system, as well as final grades. This program is a distributed application since it relies on a central data administrator to manage data accessed by faculty and administrators across the event’s workforce. Students can use the strategy to evaluate their progress. At the outset of a software project, the manager must make educated guesses about how long it will take to complete the project.
References
Akçapınar, G., Hasnine, M. N., Majumdar, R., Flanagan, B., & Ogata, H. (2019). Developing an early-warning system for spotting at-risk students by using eBook interaction logs. Smart Learning Environments, 6(1), 1-15. Web.
Azzahra, Z. F., & Anggoro, A. D. (2022). Analisis Teknik Entity-Relationship Diagram dalam Perancangan Database Sebuah Literature Review. INTECH, 3(1), 8-11. Web.
Chung, J. Y., & Lee, S. (2019). Dropout early warning systems for high school students using machine learning. Children and Youth Services Review, 96, 346-353. Web.
Foster, E., & Siddle, R. (2020). The effectiveness of learning analytics for identifying at-risk students in higher education. Assessment & Evaluation in Higher Education, 45(6), 842–854. Web.
Juhaňák, L., Zounek, J., & Rohlíková, L. (2019). Using process mining to analyze students’ quiz-taking behavior patterns in a learning management system. Computers in Human Behavior, 92, 496-506. Web.
Medlock, S., Ploegmakers, K. J., Cornet, R., & Pang, K. W. (2023). Use of an open-source electronic health record to establish a “virtual hospital”: A tale of two curricula. International Journal of Medical Informatics, 169. Web.
Oates, B. J., Griffiths, M., & McLean, R. (2022). Researching information systems and computing. Sage. Web.
Ogundepo, O. Y., Omeiza, I. O. A., & Akpojaro, M. A. (2019). Development of a real-time fingerprint authentication/identification system for students’ records. Nigerian Journal of Technology, 38(1), 212-222. Web.
Rajaram, A., Hickey, Z., Patel, N., Newbigging, J., & Wolfrom, B. (2020). Training medical students and residents in using electronic health records: a systematic review of the literature. Journal of the American Medical Informatics Association, 27(1), 175–180. Web.
Samadbeik, M., Fatehi, F., Braunstein, M., Barry, B., Saremian, M., Kalhor, F., & Edirippulige, S. (2020). Education and Training on Electronic Medical Records (EMRs) for health care professionals and students: A Scoping Review. International Journal of Medical Informatics, 142. Web.
Zhang, X., Gossett, C., Simpson, J., & Davis, R. (2019). Advising students for success in higher education: An all-out effort. Journal of College Student Retention: Research, Theory & Practice, 21(1), 53–77.
Zhang, Z., Cao, T., Shu, J., & Liu, H. (2022). Web.
Zhang, Z., Cao, T., Shu, J., & Liu, H. (2022). Identifying key factors affecting college students’ adoption of the e-learning system in mandatory blended learning environments. Interactive Learning Environments, 30(8), 1388–1401. Web.