Abstract
An investigation of the Trackare information system for the provision of health care services was conducted to address the research objectives. A research study was conducted within the Sharjah hospital environment consisting of staff members with different qualifications and working for different departments. The objectives of the study included assessing the health care services provided on the system, technical analysis of the usability of the system, assessment of the interactive nature of the system components, and assessing the usability of the components.
Both the qualitative and quantitative paradigms were employed in data collection with the administration of the questionnaire used to collect quantitative data that was statistically analyzed using SPSS software to determine the mean, kurtosis, Standard Deviation, and other statistical values. The results showed a high level of accessibility, efficiency, usability, and a highly interactive system. However, it was recommended that further research on other information systems should be conducted to compare them to determine the best system to adopt.
Introduction
In the recent past, many hospitals in the UAE have adopted and integrated information systems into their daily operations in the provision of health care services. One such situation is found in Sharjah hospital, which is a health care institution that uses the Tracker information system in the provision of health care services to its large customer base. Tracker is a unified information system configured to capture a wide range of data belonging to patients from different parts of the world that provides doctors and nurses the necessary information to act on in the provision of a wide range of health care services to patients from inside and outside of the United Arab Emirates (UAE) (Intersystems, 2015).
The information system enables coordinated care among the different hospital departments using administrative, clinical, and departmental modules. Using Tracker enables the health care service providers to void making errors, expedite billing, duplicate tests, and optimize resource utilization (Aggelidis & Chatzoglou, 2012). Despite the benefits that the hospital gains by providing a wide range of health care services to customers from different parts of the country in the Middle East, not much research, with statistical evidence has been conducted to determine the functionality and related issues, leading to the problem that the use of information systems within the institution has not been studied (Li, Ge, Zhou, & Valerdi, 2012). Despite that, empirical evidence suggests that information systems play a significant role in the provision of medical health care services both to inpatients and outpatients besides offering support for the health caregivers such as doctors, nurses, and support staff to perform their tasks with efficiency and effectiveness.
Objectives
- Investigate the health care services provided on the TrakCare information system
- Technical analysis of the usability of the hospital information system components using UML diagrams
- Establish the interactive nature of different system architecture components and sub-components
- Evaluation of the ease of interacting with the Tracker information system user interface design
Significance of the Study
The study elucidated the need for an information system in a hospital environment for those who have not gained an insight into the benefits of integrating computers into the health care environment. Besides, similar organizations could learn the benefits of using an integrated information system to run their administrative activities.
Literature Review
The Health Care Services Provided on the TrakCare Information System
Evidence shows that the Sharjah Hospital provides efficient and effective health care services using TrakCare health care information system to fulfill patient management objectives such as managing medical operations, administrative, and financial tasks in a fully integrated computerized environment (Feng, Siu, & Zhang, 2013). The study shows that over 70% of the employees including nurses, doctors, and those who provide support services are satisfied with the use of the system. TrakCare health care information system provides the best evidence-based clinical health care services with patient involvement.
According to Feng, Siu, and Zhang (2013), the hospital uses TrakCare to ensure integrated solutions are achieved for efficient and effective access, processing, and storage of patient data and information for the management of inpatients and outpatients. The management of the hospital considers cost-effectiveness as the prime component by automating various processes within the hospital. The information systems enable doctors, nurses, and those working in the hospital environment to store, retrieve, and update the patient’s medical records in real-time. One of the critical features that make the information system to be widely accepted is that it has a user-friendly interface that electronically routes diagnostic information.
Support Services
Among the services supported on the TrakCare health care information system are end-to-end enterprise-level medical administration and the generation and provision of patient data to stakeholders such as the government. That is besides automating the hospital’s routine workflow tasks (Intersystems, 2015). The system is based on the client-server architecture which enables users to perform different services on the platform such as requesting patent information, updating client records, and securing the storage of patient data at the click of a button. Each user can access information about the patient with the desired level of detail depending on the system and sub-system components.
The system generates a view of a patient’s history in real-time besides providing secure access to patient data. It also provides a good framework for the interoperability of legacy systems to enable informed decision-making. Besides, the system provides multilingual and multicurrency support to meet the logical requirements of different customers.
Modularization of Information System
A technical review of the system by Kuperman, Gardner, and Pryor (2013) shows that TrakCare is divided into different modules as shown in figure 1. The components include policy and procedure management modules, laboratory information reporting and storage modules, and Radiology information components for the storage of patient images.
The modules support the facilitation of the workflow of radiological services. Besides, some additional components that make the information system complete include the human resource department for the management of the medical and on-medical staff, pharmacy information system for the dispensing requested drugs and for over the counter transactions, rooster management system that enables the management to schedule hours of the nursing staff, maintain shift rotation and support inventory of the patient information (Intersystems, 2015). The proposed system is based on a distributed architecture that utilizes industrial and market standards such as the TCP/IP protocol, UNIX operating systems, Windows operating system, and related products.
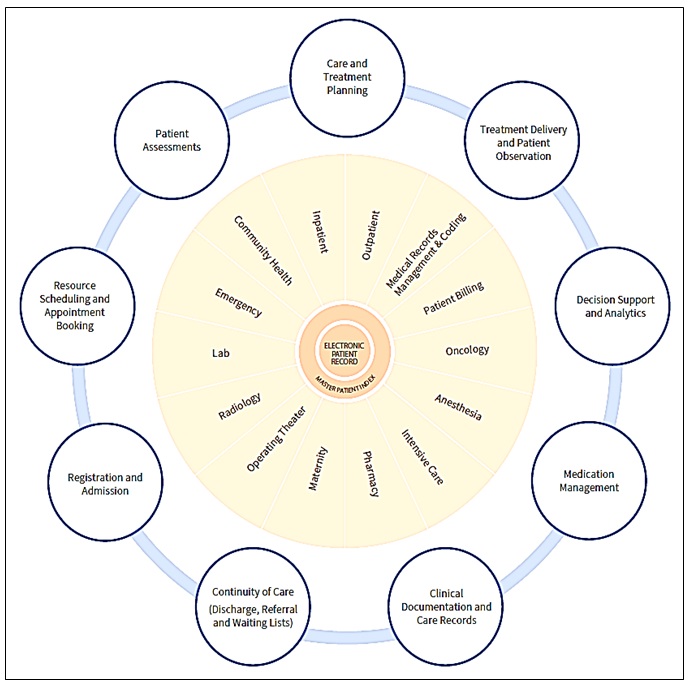
Figure 1 shows the several modules such as registration of the TrakCare information system.
Technical Analysis Using UML Diagrams
Technically, the usability of the system is a key component that makes the system acceptable among the doctors and other users. An analysis of the system using UML diagrams shows that by establishing a strong relationship among the hospital information system components, the division and inter-connectedness of different departments decomposed into several class diagrams makes the flow of data and usability flexible. The information system class diagrams are connected with the constituent components of the information system based on the way different departments interact with each other (Kuperman, Gardner, & Pryor, 2013). That is besides the abstract classes consisting of standard class stereotypes, class stereotypes that are not up to standard, and the type of data processed for use in the system.
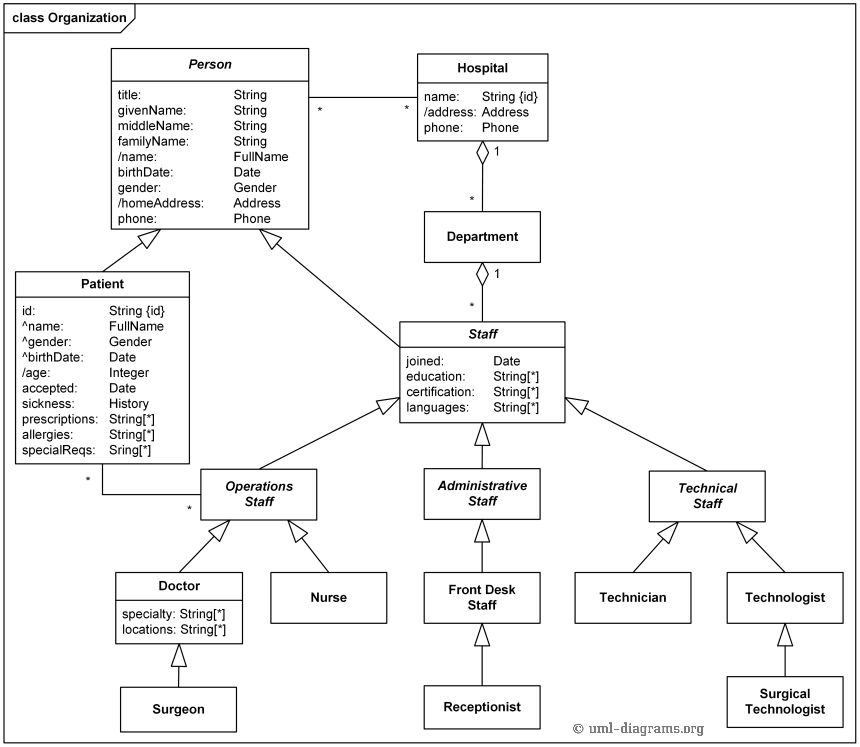
Figure 2 shows the interrelated components, which include the hospital, patients, doctor, nurses, receptionists, technician, technologist, and surgical technologist. The operations, administrative, technical, and the staff in general are indicated in the diagram.
Class Diagrams of the Relationship Among the Components
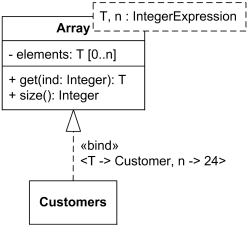
A typical example of the class diagram is shown in Figure 3 above consisting of a description of the array of integrated elements that make a technical link between the customer/patient (Haux, 2006).
Interactive Nature of System Architecture Components
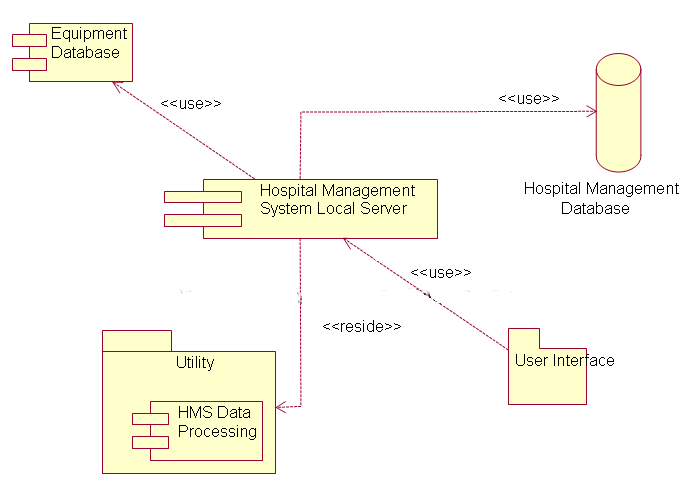
The components in figure 4 are modeled in such a way that they interact with each other in a centralized system. Investigations show that the architecture consists of the HRM utility for data processing, a user interface, the hospital management database, the equipment database, and hospital management system local server (Pedersen, Schneider, & Scheckelhoff, 2012). Besides, each element has relationships with other elements as shown in figure 4, which includes the user database, hospital management system, user interface, and human resource data processing utility.
Ease of Interacting with the Trackare Information System
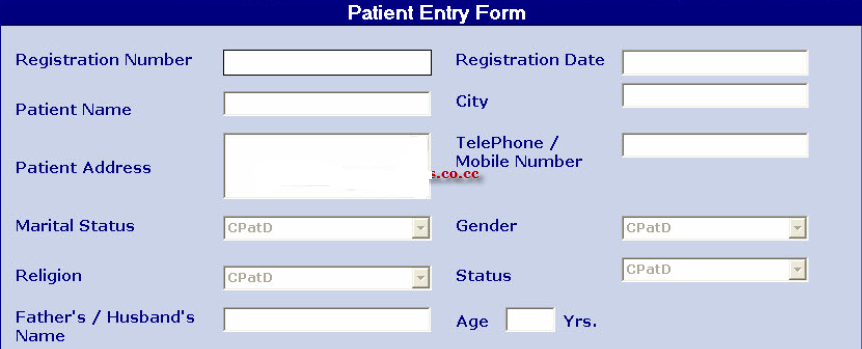
The ease of use when interacting with the Tracker information system user interface is demonstrated in figure 5. Forms are designed in such a way that they easily capture patient information, which includes registration number, name, marital status, address, registration date, telephone number, gender, and religious status (Intersystems, 2015). The level of usability is statistically acceptable with 78% of the respondents showing positive feedback.
Description
The Tracker information system consists of various components that support the provision of health care services to the people within the United Arab Emirates (UAE) and other countries in the Middle East (Locatelli, Restifo, Gastaldi, & Corso, 2012). It provides a platform made of different modules as shown in figure 1 that support administrative, clinical, and departmental services integrated into a single information system. The study was based on the system theory of thinking that deviates from seeing a system as a linear model to viewing the information system in the context of goal directness.
Scientific Background
Here, nursing informatics is based on the scientific background of merging technology with health care service delivery. According to Staggers and Thompson (2002), the scientific foundation of nursing informatics is a professional vocabulary that derives its definition from the use of information technology to offer health care services, support education, collect and analyze patient data, and enable decision making.
Advantages and Disadvantages
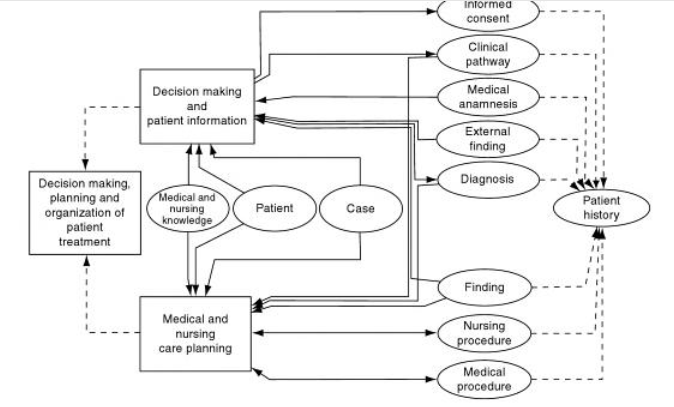
The research established various advantages and disadvantages of using computerized information systems with a specialized focus on the use of Tracker information at Sharjah hospital. Staggers and Thompson (2002) note the advantages include real-time access to patient data, effective decision making, secure and centralized data storage, and better administration of hospital activities. The disadvantages include insecure patient data and the need to study the system before using it. Figure 6 is a typical presentation of the flow of services within the information system
Methodology
According to Kumar and Phrommathed (2005), the research was based on both the qualitative and quantitative paradigms that involved an extensive literature review on the use of TrakCare information system within Sharjah Hospital and the statistical analysis of quantitative data obtained by issuing questionnaires to different respondents to address the research objectives (Bernard & Bernard, 2012). SPSS software paradigm was used to analyze the data that was collected from different participants, employees of the Sharjah Hospital staff. An appropriate research design answered was used to fulfill the purpose of the research. A stratified sampling method was used to collect the data from the participants for analysis within the set time frame.
Validity
Content validity was ennobled by involving professional information system developers to review each element of the questionnaires to ensure that the responses were measured correctly. Each questionnaire was checked for consistency with the objectives and errors detected were corrected to maintain reliability.
Data Collection Procedure
Prior arrangements were done with the hospital administration for data collection. Employees of various departments who participated in the study were informed in advance and prepared to participate in the study. Questionnaires were issued to each respondent and collected after completion to ensure high turnover.
Data Analysis
The questionnaires were first checked for any errors and those found with mistakes were removed while those that were complete provided the data that was subjected to SPSS statistical analysis.
Results and Conclusions
Respondents Distribution
Table 1: Statistics of respondents.
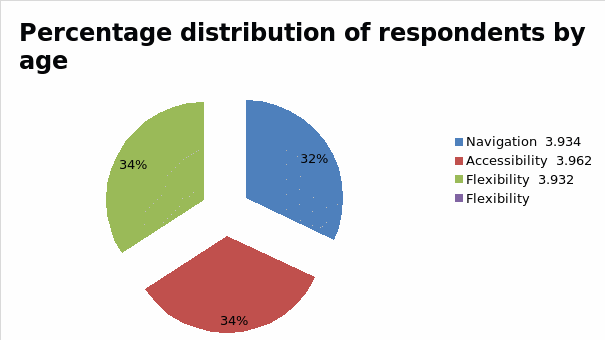
Table 1 shows the respondents by age, educational levels, marriage, and gender. A summary of the table and the chart in figure 2 shows the distribution of respondents by age who participated in the study. A critical analysis of table shows a fair distribution across gender, age, and educational qualifications.
Use of TrakCare Information System for Health Care Service Delivery
Table 3: Use of TrakCare information system for health care service delivery.
Table 3 shows the services that are offered on the TrakCare information system enable the doctors to perform their services better and in real-time. For instance, administrators such as the human resource manager provide find the use of the system feasible. The mean score for administrative use of the system is 2.0077, showing that the operational, finances, and support departments have adopted the systems to support service delivery in real-time. Besides, the system provides support for analyzing and providing evidence-based health care services.
There are no significant variations among the mean values of different service components, which show that the system has been adopted throughout the hospital as the main information system for performing a significant number of electronic-based transactions. Again, the skewness is either negative or positive on either side, showing that the distributions of the responses about the use of the information system are skewed. However, the skewness does not show that different users have negative opinions, but show that the users have their own opinions on how the system should be designed to enhance its usability. In addition, the standard deviations for each component are.36294,.32026,.0877,.08771, and.35184, showing small deviations among the values.
The standard deviations show that the results were highly consistent with the conclusion that the system components were highly modularized and provided a good framework for service delivery. The conclusion was based on the rationale of the system, consisting of patient assessments, care and treatment planning, patient observation and treatment delivery, resource scheduling and appointment booking, registration and admission, clinical documentation, medication management, decision support, and analysis provide the desired modules for health care provider services. It is important to note that the Std. The error of Skewness is 0.100 with all positive values.
Table 4: Percentage responses.
Table 4 shows the percentage responses on those who agree or disagree that the system has the features that makes them perform their respective functions. Those who strongly agree represent 79.2% consisting of 171 respondents, while 14.6% agree consisting of 19 people, 3.1% disagree consisting of 4 people, and 3.6 % disagree consisting of only 5 people. Overall assessment shows that a greater percentage supports the use of the information system.
Technical Analysis Components Using UML Diagrams
Table 5: Technical analysis of the usability of components.
Technical analyses of the responses shown in table 5 indicated the mean values of 3.934, 3.962, and 3.932 for navigation, accessibility, and flexibility respectively, showing that the information system is highly flexible, accessible, and navigable. The results were consistent with the findings in the literature review, which show that different modules that make the information system are highly interactive and provide user support when navigating to access the system. Based on the 0.341 standard error of kurtosis and a low Standard Deviation that is below 0.854, it is evident that the components can be accessed easily for administration and patient service delivery.
Table 6: Technical usability of the system.
It is important to note from table 6 that 71.5% strongly agree that the system is usable, 16.2% agree on its usability, 8.5% do not agree, and 3.8% strongly disagree. The results indicate that the user interface cannot be easily manipulated to suite the user needs because of the high level of flexibility and accessibility into the information system. Small variations occur among the values of the mean, standard deviation, kurtosis, skewness, and Std.
Interactive Nature of System Architecture and Sub-Components
Table 7: Interactive nature of the system.
The interactive nature of the system components and sub-components based on a technical analysis of the design shows that each component in the system functions according to the desired level of service. A critical review show that the mean for each component to be above 3.650 and below 3.812, showing small deviations from the mean for each component.
Table 8: User support features.
A statistical analysis of the responses on the interactive nature of the hospital with specific focus on support features are shown in table 6 shows that 87.5% are for the features who consist of 175 respondents, and 5% agree with the rest being a small percentage that disagree as shown in table 8. Overall assessment of the response shows that the users find it interactive and supportive of their functions and it shows a higher level of stability with other system components.
Ease of Interacting with the Trackare Information System
Table 9: Ease of interacting with the Trackare information system.
The usability of the system was investigated and the results showed the mean values to have small deviations for visibility, input and output controls, recognition, flexibility and efficiency as shown in table 9. However, the mean skewedness is negative showing that there is a lack of symmetry if the results were plotted on a graph. However, the results show that the system was rated as highly visible because it allowed input and output to be captured without the need to remember the input or output fields.
A summary statistical analysis of the ease of use of the system shows a Pearson correlation coefficient of.725 on a two tailed test showing strong positive correlation among the items that were tested and a p value less than 0.01 as shown in table 10. The results of the p value show that the results were consistent with the desired outcome of a highly interactive system that has the features, which supports the users when navigating through the system.
Recommendations
The study was confined to Sharjah hospital, which uses the Trackare information system to capture, store, process, and present patient information when needed. The results were limited to the characteristics and functionality of the subject of investigation. However, the Trackare information system was not compared with other information systems that have been used in similar environments creating a gap in knowledge that needs to be addressed. However, the results were valid because of the high levels of satisfaction noted among the users of the information system. Despite that, it is critical to conduct further studies in different hospital settings to determine the best information system to use in the hospital environment.
References
Aggelidis, V. P., & Chatzoglou, P. D. (2012). Hospital information systems: Measuring end user computing satisfaction (EUCS). Journal of biomedical informatics, 45(3), 566-579.
Bernard, H. R., & Bernard, H. R. (2012). Social research methods: Qualitative and quantitative approaches. New York: Sage.
Feng, D., Siu, W. C., & Zhang, H. J. (2013). Multimedia information retrieval and management: Technological fundamentals and applications. New York: Springer Science & Business Media.
Haux, R. (2006). Health information systems–past, present, future. International journal of medical informatics, 75(3), 268-281.
Intersystems: TrakCare You’ll make breakthroughs in patient care. (2015). Web.
Kumar, S., & Phrommathed, P. (2005). Research methodology (pp. 43-50). New York: Springer US.
Kuperman, G. J., Gardner, R. M., & Pryor, T. A. (2013). HELP: a dynamic hospital information system. New York: Springer Science & Business Media.
Li, L., Ge, R. L., Zhou, S. M., & Valerdi, R. (2012). Guest EditorialIntegrated Health care Information Systems. Information Technology in Biomedicine, IEEE Transactions on, 16(4), 515-517.
Locatelli, P., Restifo, N., Gastaldi, L., & Corso, M. (2012). Health care information systems: architectural models and governance. Innovative information systems modelling techniques, 73-98.
Pedersen, C. A., Schneider, P. J., & Scheckelhoff, D. J. (2012). ASHP national survey of pharmacy practice in hospital settings: dispensing and administration-2011. American Journal of Health-System Pharmacy, 69(9), 768.