Introduction
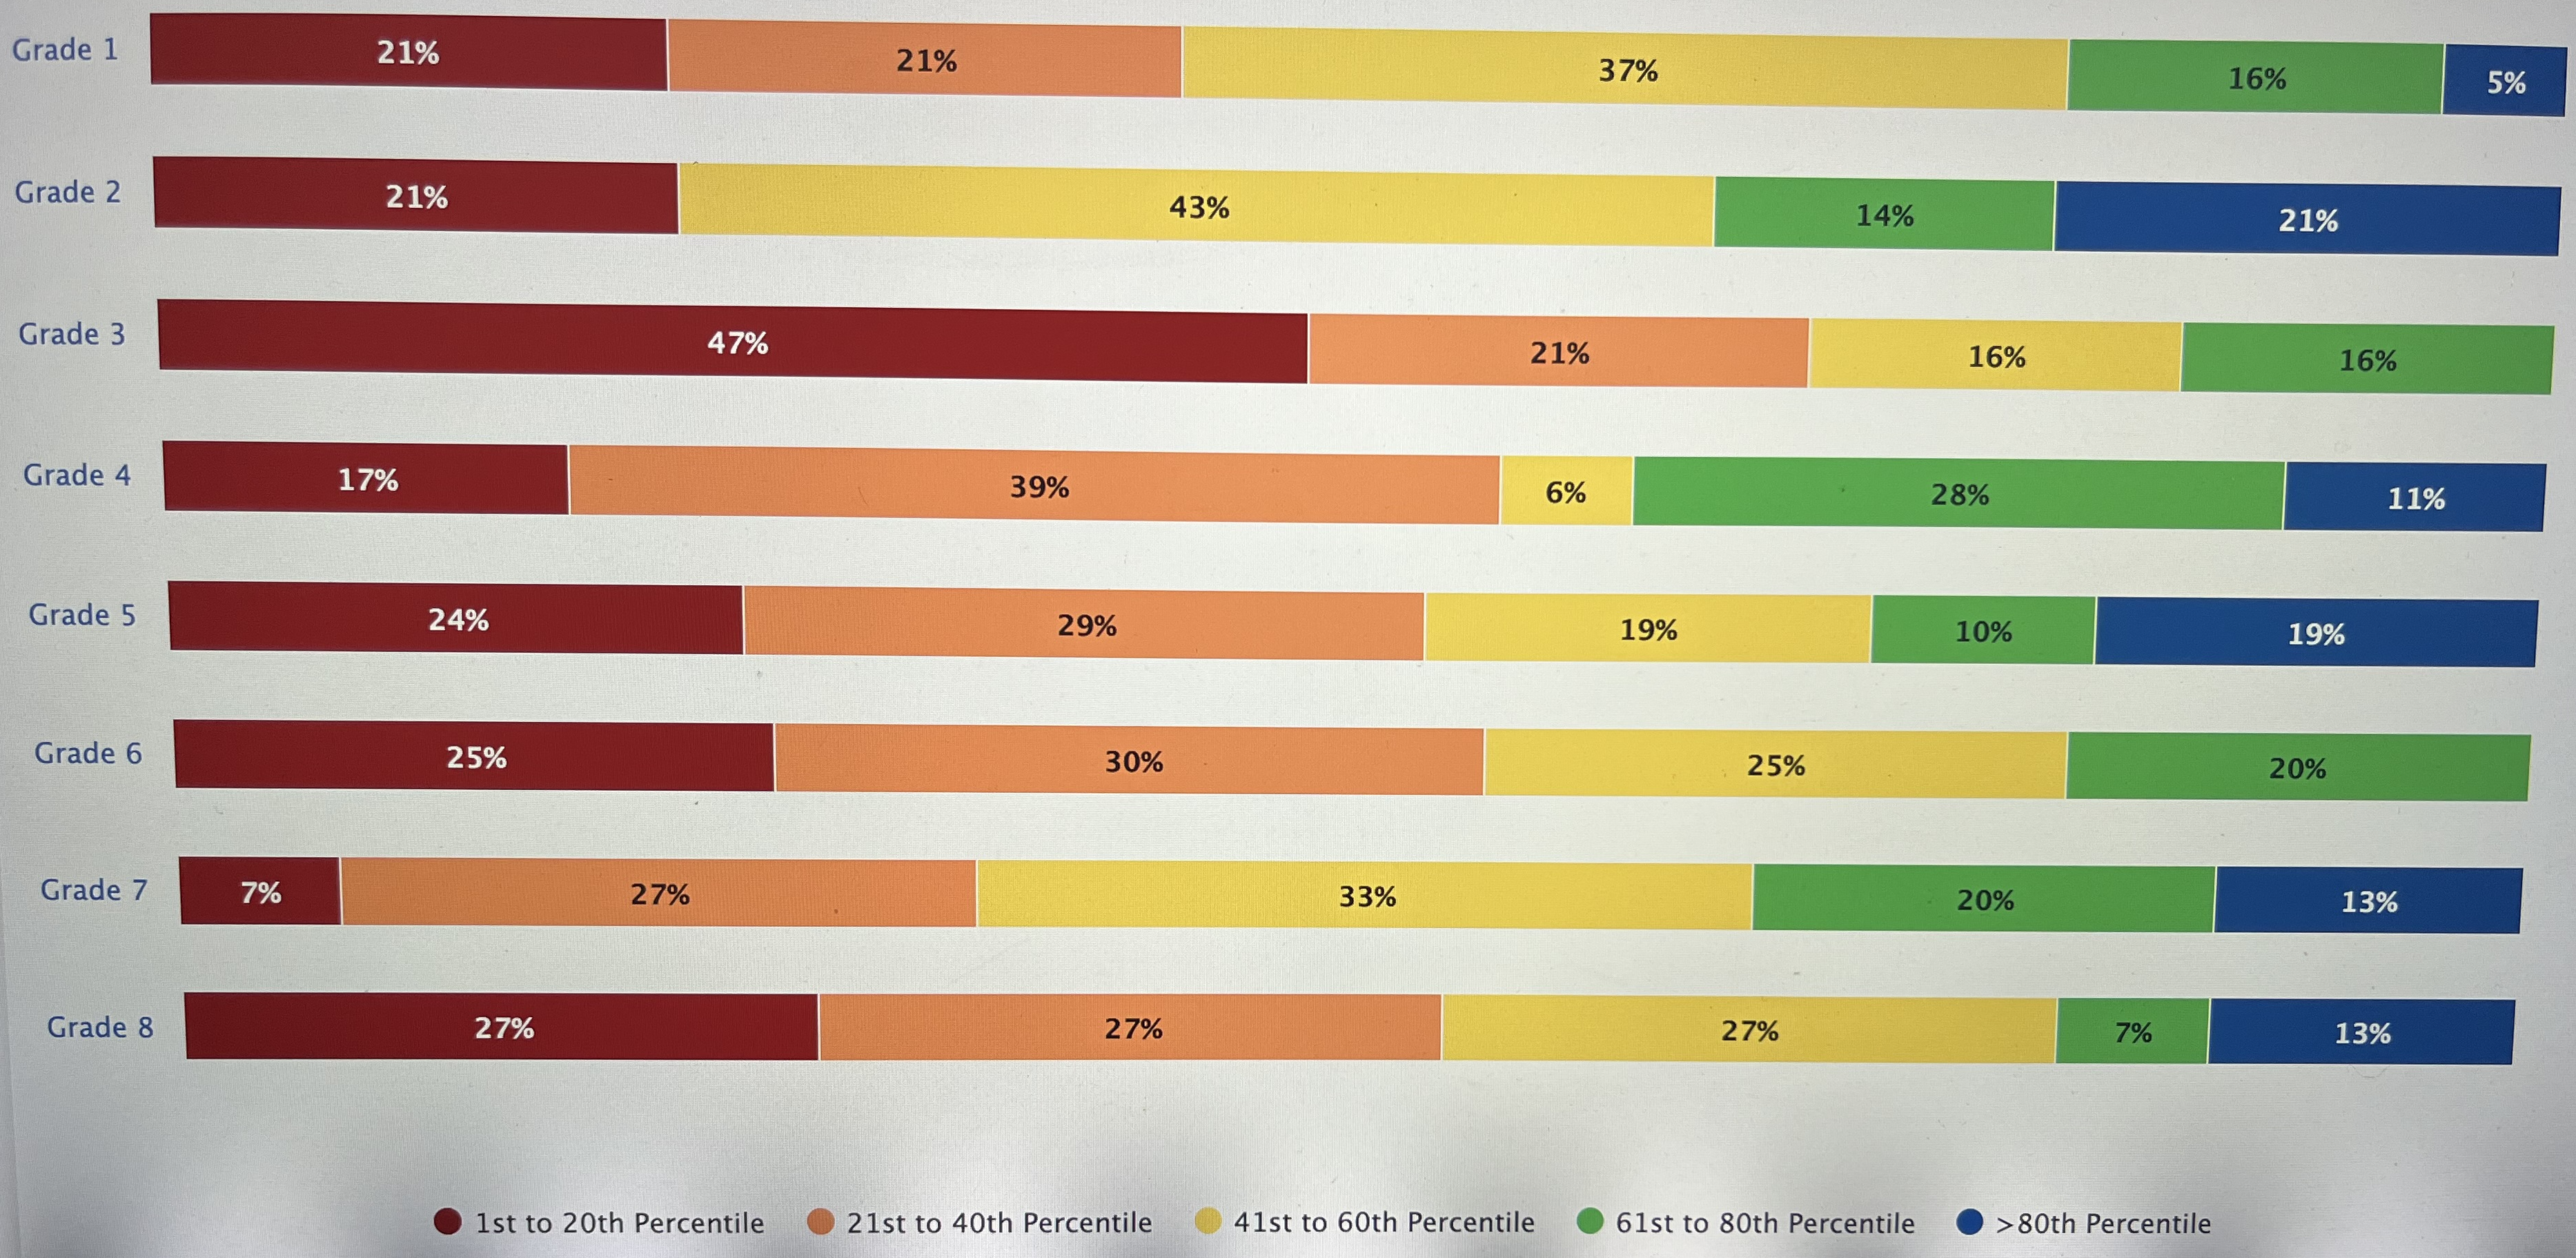
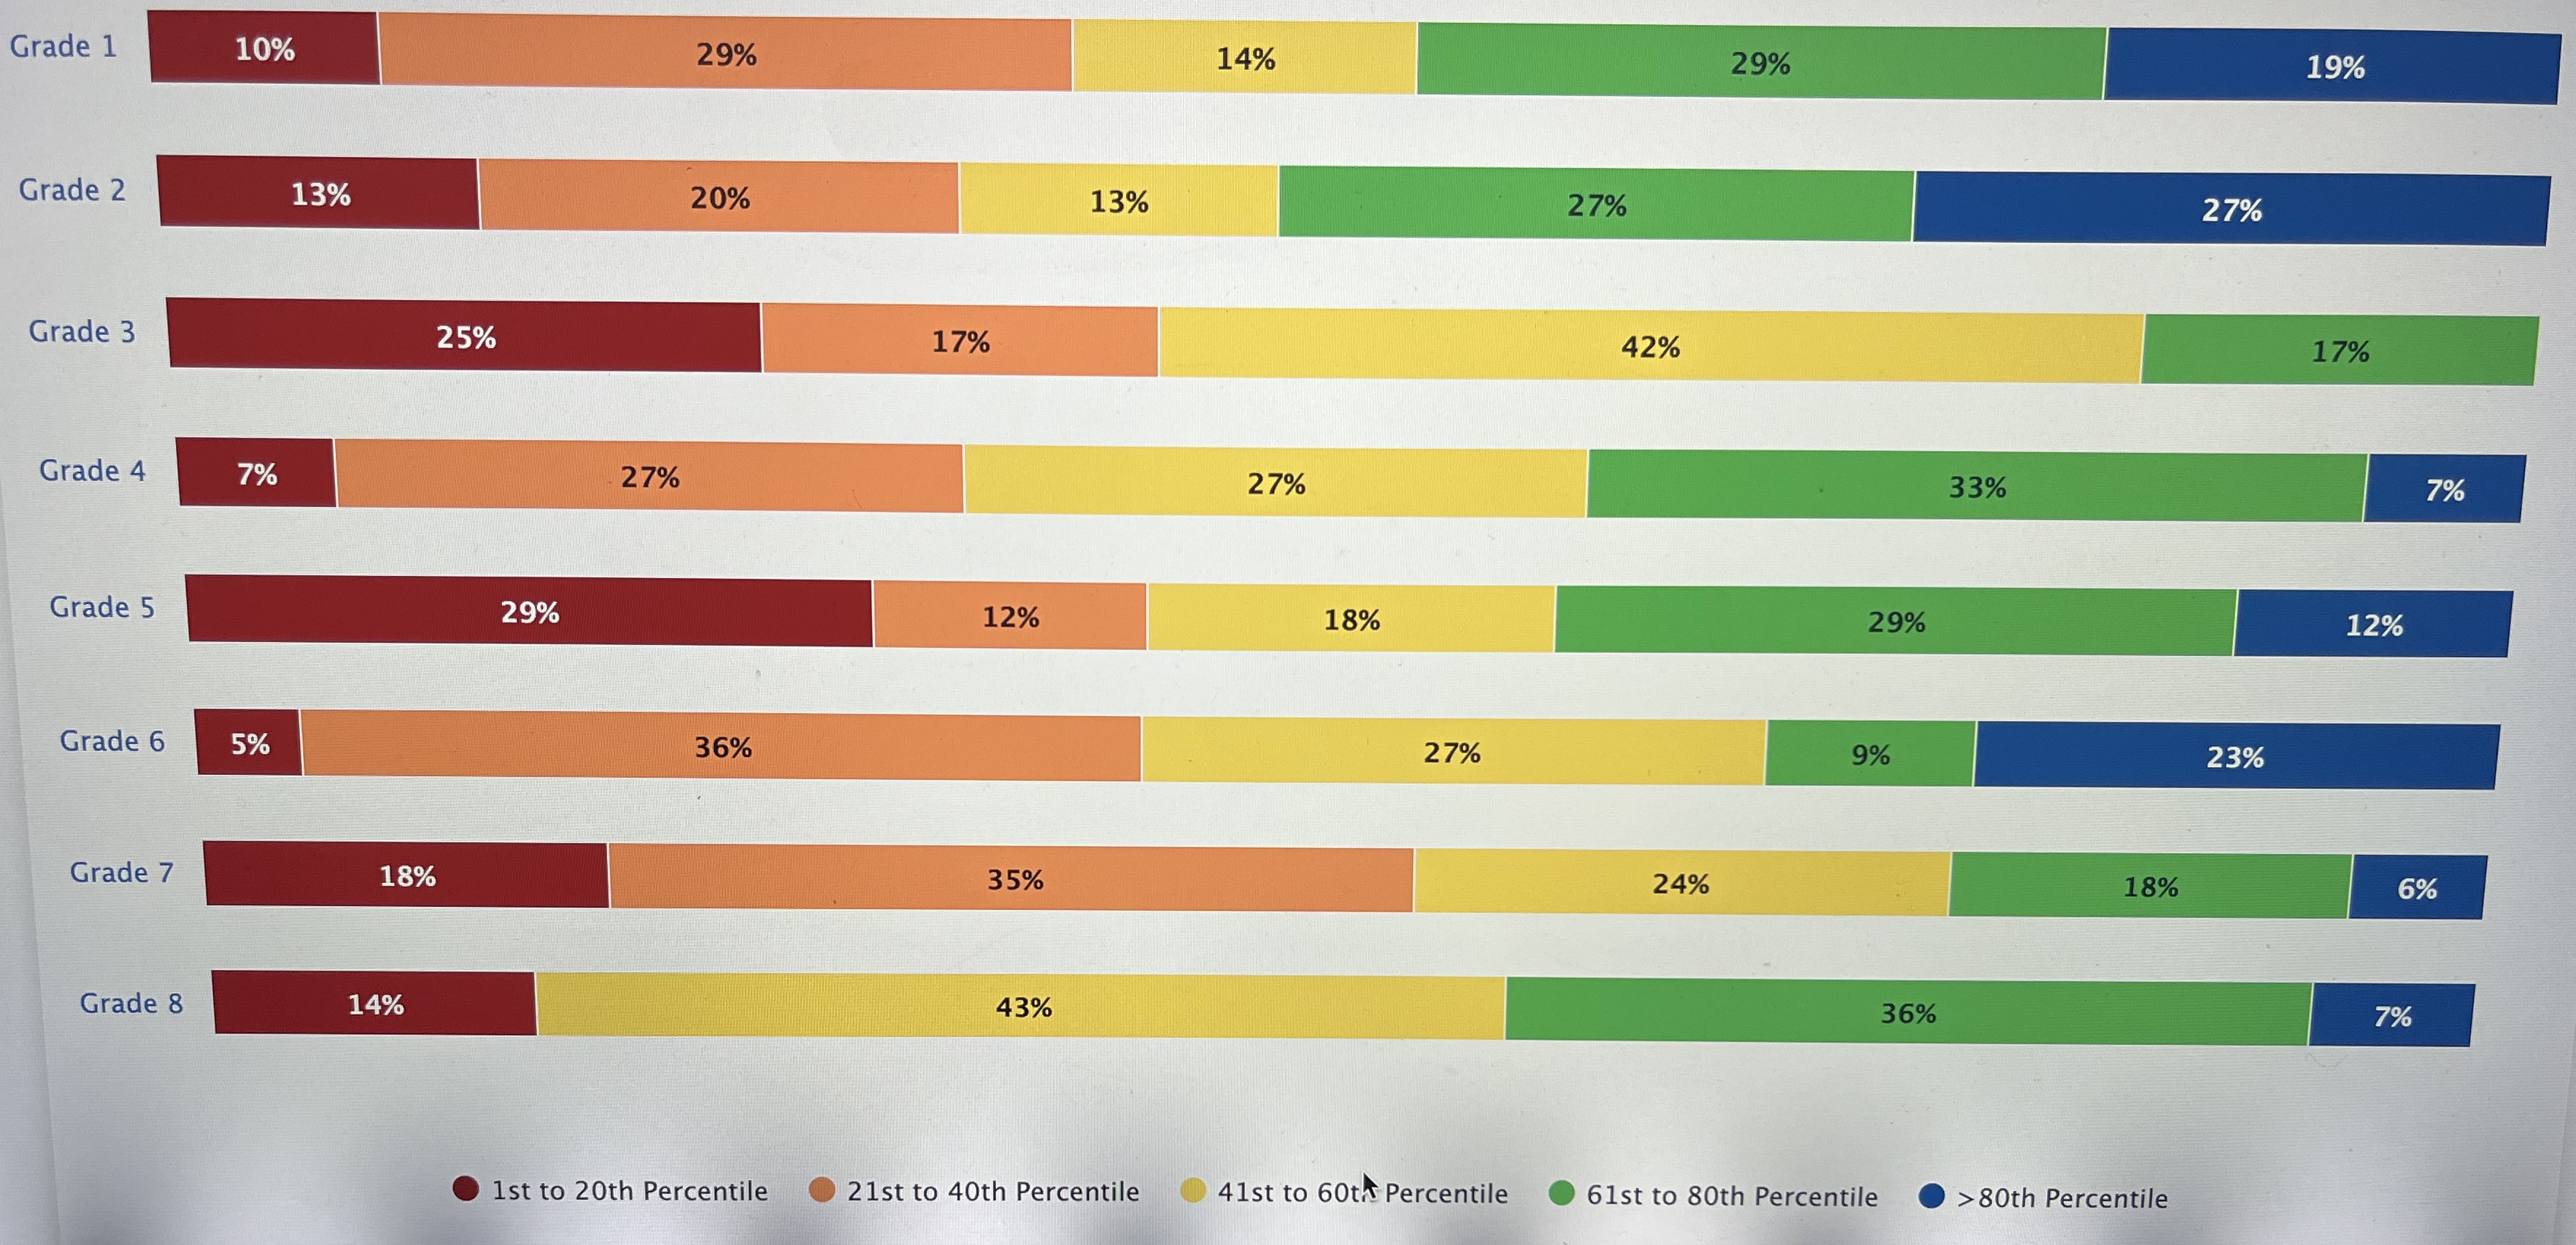
Student performance data for Math K-12 is assessed as a percentage of performance in percentiles. The data (see Figures 1 and 2) demonstrates the performance of students by the criterion of achievement over the general sample, demonstrating the general and particular level of success in learning. The data obtained helps give recommendations to students for further education and determine the complexity of the program for mastering by a student with average academic performance.


Grade 1
In the period 2020-2021 and 2021-2022, there are trends of a strong drop in the percentile above the 80th. If the first period shows a result of 19%, then in the period 2021-2022, this figure drops to 5%. This trend may associated with the complication of the material. There is a significant increase in the category from the first to the twentieth percentile: a much smaller number of students demonstrate indicators that would be at least a percentage higher than the rest. This trend can be associated with a positive phenomenon: the material being passed becomes clearer to more students. However, for a larger number of students, the program has become more difficult than it was in the past. The performance criterion for the 20-40th percentile does not show major changes. A much larger percentage of students began to demonstrate results from 41 to 60%, and a much smaller number reached the mark of 60th. In general, the majority of students began to master the program better; however, a smaller number reached high levels.
Grade 5
In 2020-2021, students equally showed average results, and many were well above the general sample. In 2021-2022, the percentage of students who did not demonstrate high performance remained almost unchanged, but the high-performance indicator fell significantly. With a general drop, the number of students doing better than 80% of the sample increased by 2 percent. The overall performance trend declined, showing a 17% increase in the 20th to 40th percentile group. The program becomes too complex for more students to succeed.
Grade 6
The sixth assessment shows the largest gap in students’ results. In 2020-2021, only 5% of students had poor academic performance; a large number showed average results. 23% of students showed the highest achievements. In 2021-2022, none of the students performed above 80% better than the sample. The smallest number of students demonstrate high performance, while the group of students with low performance has increased by a quarter. The data suggests the overall grade point average has become less than satisfactory.
Strengths and Opportunities for Improvement
A larger number of students began to demonstrate an average result. This may indicate that the program has become clearer and more accessible to the students. The downside is that the vast majority of students are not capable of performing well above average. An opportunity for improvement may be to stimulate outstanding students while maintaining the overall focus of the program for each student to learn.
Ideas for Better Learning
There is a need to increase the number of outstanding students in the math class while maintaining the overall number of average students. To increase the motivation of students, a system of rewards for particularly outstanding results can be introduced. To help underachieving students, additional time should be given to questions regarding the assimilation of the program. Regular assessment can be a stressor in the math class. Stress reduces academic performance because it negatively affects higher-order thinking, problem-solving, memory, and strategy development (Pascoe et al., 2020). It is necessary to talk about methods of dealing with stress for each student.
Conclusion
The complication of the program is an inevitable process in which it is necessary to ensure good overall academic performance. The data obtained in 2020-2021 and 2021-2022 show a significant decrease in the number of outstanding students while maintaining a high level of program completion. It is necessary to motivate outstanding students further and make sure that others have enough time to master the program. It is essential to develop a methodology for dealing with stress since negative emotions affect mathematical abilities.
Reference
Pascoe, M. C., Hetrick, S. E., & Parker, A. G. (2020). The impact of stress on students in secondary school and higher education. International Journal of Adolescence and Youth, 25(1), 104-112. Web.