Executive Summary
This technical note is based on a statistical analysis of selected data derived from a 75-item self-administered work-study and study-work conflict survey questionnaire. A total of 218 RMIT University Property Construction and Project Management students accomplished the study instrument validly and completely enough to be included in the instant database.
Among the first of the core, findings is that being married or a single parent does not seem to raise the odds of work-study conflict though this conclusion may have been weakened by the fact that more than 95% of the sample were single and even those already ‘burdened’ by housekeeping chores may still be in the throes of the honeymoon years. Second, delight at learning much more as one advance at university ought to moderate work-study conflict but the evidence is too weak to support this hypothesis. Thirdly, the available data do not permit one to predict student burnout (or at least the feeling of being emotionally drained) on the basis of three selected IVs: hours worked per week, whimsical priority-setting and success at hurdling academic problems. On the other hand, maturing to a hardnosed sense of priorities is evidently associated with facing up to academic challenges better.
Empirical evidence supports the distinct possibility of work-study and study-work conflicts, especially since nearly all the survey participants needed to work. To that extent, more extensive analysis of the entire database needs doing. Suggestions are also made to remedy methodological, validity and sampling flaws.
Research Questions and Hypotheses
In general, we posit that perceived stress and work-study conflicts are greater for students who are married and full-time workers. However, coping and adaptation improve as students reach the midpoint or end of higher education.
For research question 1 (RQ1), the operative question is: do students experience more work-study conflict if they are married or are single parents? The null hypothesis may then be stated as follows:
- H01: there is no difference between single and married students in work-study conflict;
- P1 = P2,
where…
- P1 = the proportion of students who are married or raising offspring as single parents and who agree with statement 4/1 “the demands of my work interfere with my study.”
- P2 = the proportion of single students who agree with statement 4/1 “the demands of my work interfere with my study.”
Research question 2 (RQ2) investigates whether self-reported coping with study-work conflict declines as students progress through university. One null hypothesis that can be tested is:
H02: there is no difference by academic level in engagement with university study;
- μ1 = μ2 = μ3 = μ4
- μ1 = mean ratings on “having learned many interesting things during the course of my studies” among freshmen
- μ2 … μ4 = mean ratings on “having learned many interesting things during the course of my studies” among upperclassmen
Research question 3 (RQ3) asks whether there is a relationship between successful coping with study-work conflict and completing priority tasks as a time management strategy. One null hypothesis that can be tested is:
- H03: there is no relationship between successful coping with study-work conflict and seeing to priority tasks first;
- μ1 = μ2
- μ1 = mean ratings on “I can effectively solve the problems that arise in my studies.”
- μ2 = mean ratings on “I complete priority tasks.”
Research question 4 (RQ3) investigates whether student burnout can be predicted by the extent of workload.
H04: student burnout cannot be predicted by hours worked per week, attending to tasks by whim, and successful coping with academic problems:
- Yburnout = a + b1 (X1) + b2 (X2) + b3 (X3)
- Yburnout = “I feel emotionally burned out by my studies”
- X1 = “I organize tasks by preference”;
- X2 = “I can effectively solve the problems that arise in my studies.”
- X3 = total hours worked per week
Research Method
Participants
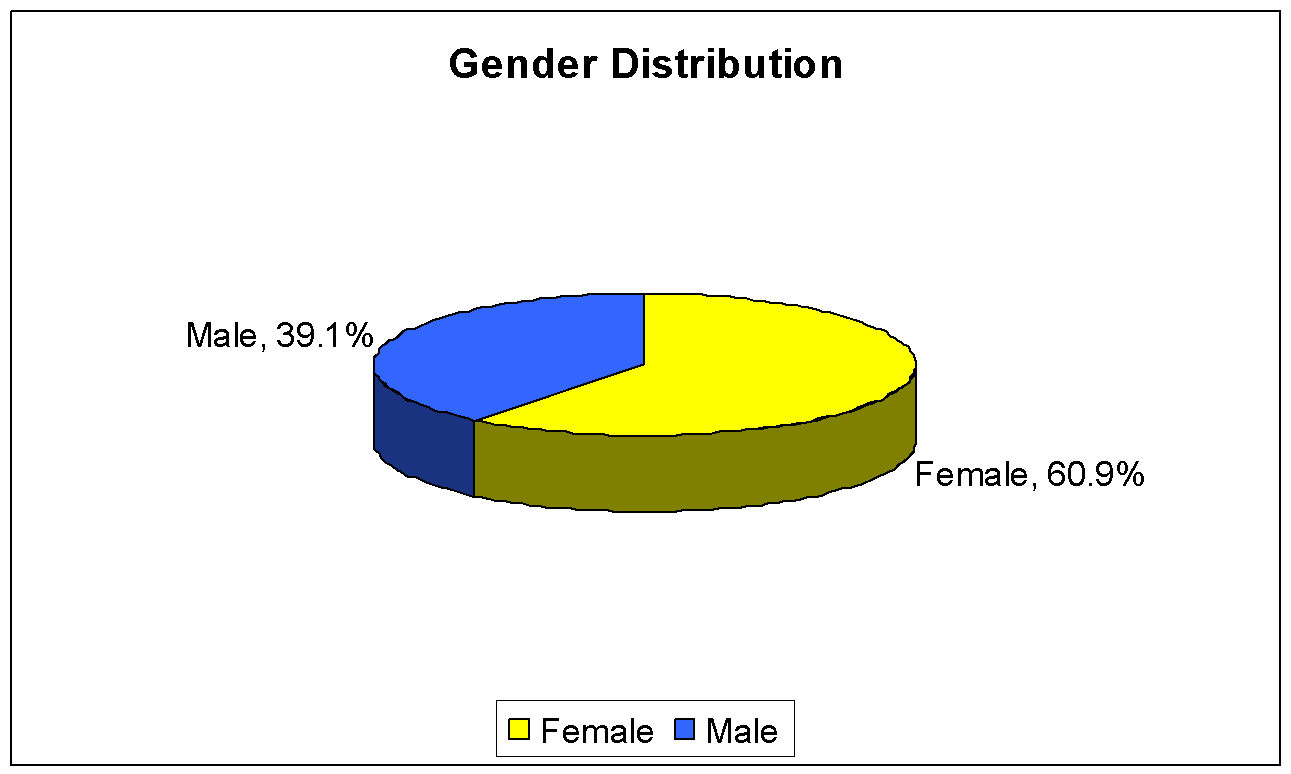
This report is based on responses by 218 RMIT University, Property Construction and Project Management students. Women accounted for nearly two-thirds of questionnaires returned in this voluntary survey (see Fig. 1 below).
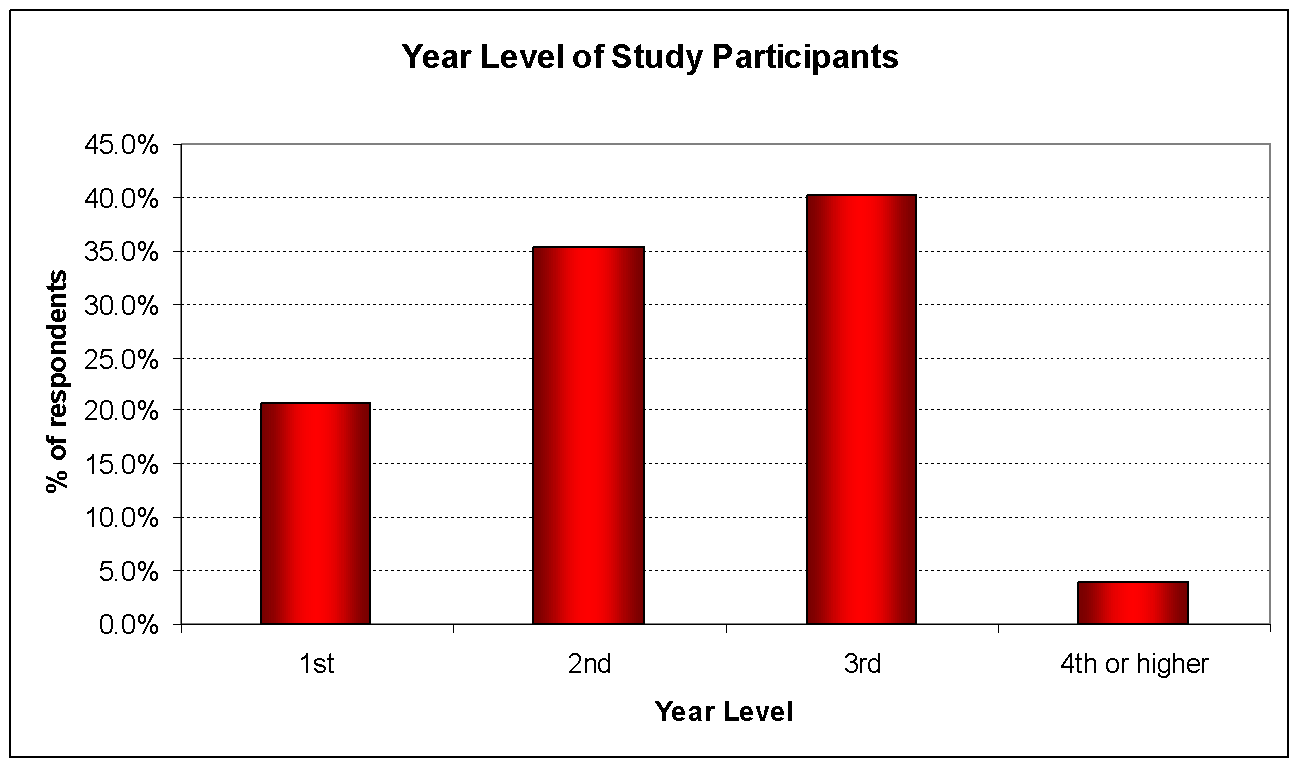
The lion’s share of survey participants came from sophomore and junior years (Fig. 2 overleaf). Unless the Property Construction and Project Management (PCPM) student body experiences marked erosion in the 4th and 5th years, it is likely that this year-level distribution reflects distinct disinterest by graduating batches for the purposes of a work-study balance project.
Consistent with the reported year level, the ages of study participants approximated a normal curve around the modal age of 19 years (Fig. 3 overleaf). By course of study, Table 1 (overleaf) shows Human Resource Management and Accountancy/Finance majors more than any other. Since it is unlikely that the “interest” in HRM is reflective of the RMIT/PCPM universe, one may hypothesize a bias by future HR professionals for participating in this and similar surveys.
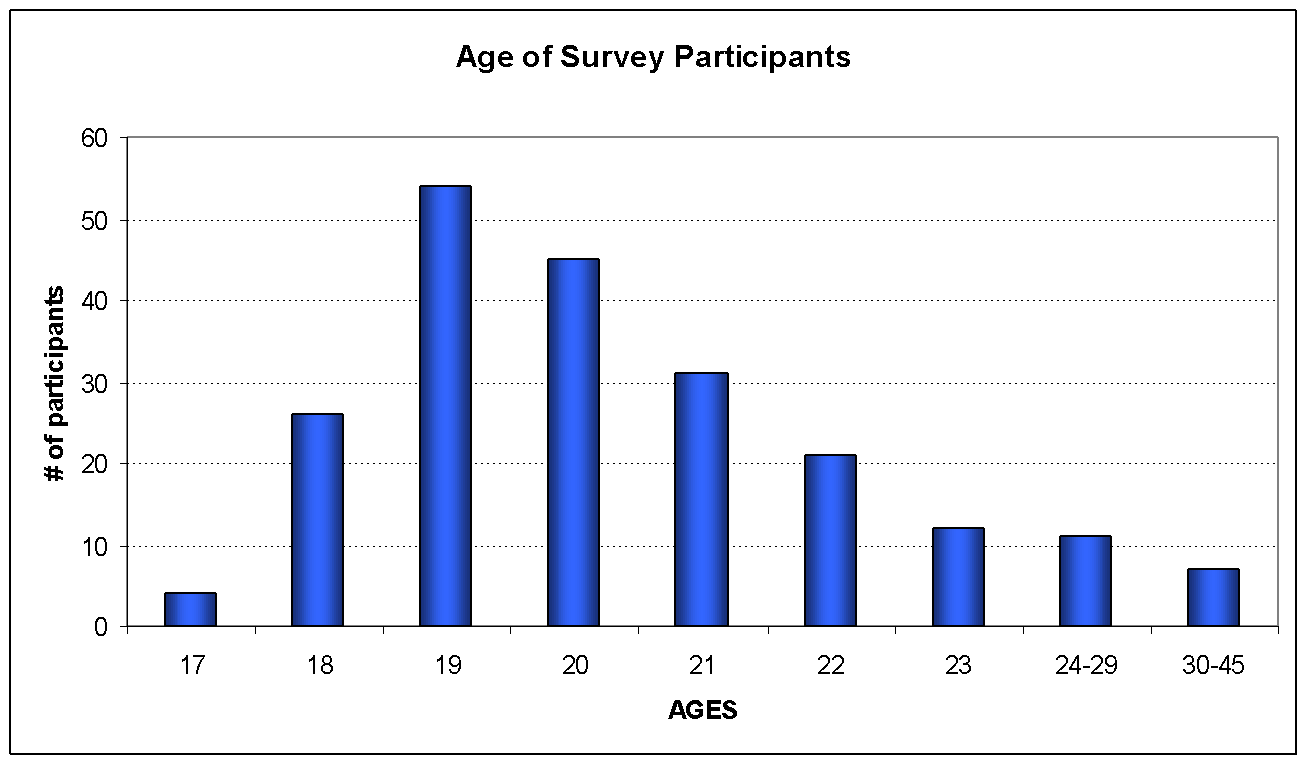
Table 1: Major/Course Profile.
Procedure
The survey took the form of a self-administered questionnaire distributed via course coordinators to the aforementioned student body. Accomplishment and returns into a closed box were entirely voluntary. No personal or identifying information was collected except for student ID numbers, explained as an aid to matching at a subsequent stage of the study. In any case, participants were notified that the ID numbers would be obliterated at the study’s end.
Instruments (Measures)
The study employed a hard-copy, self-accomplished questionnaire concerning the degree of enthusiasm for, or engagement with university studies; perceived work-to-study or study-to-work conflict; self-reports on burnout; and estimated time spent each week on work, study and home upkeep. In all, the questionnaire consisted of 74 close-ended items, chiefly of the continuous or seven-point scale type. By way of example, the items measuring engagement with university studies and vigor asked students to rate the frequency of experiencing the feeling with this instruction:
‘If you have never had this feeling, cross the “0” (zero) in the space after the statement. If you have had this feeling, indicate how often you feel it by crossing the number (from 1 to 6) that best describes how frequently you feel that way.’
Some open-ended items accounted for such widely-variable information as student ID, course, and job designation, obviously not amenable to pre-listing.
Whilst random checks were undertaken to weed out ‘halo’ and non-response bias, it could not be helped that a very small proportion of data cells were intentionally left blank. This is a fact of life in most field surveys.
The composition of the study instrument rests on:
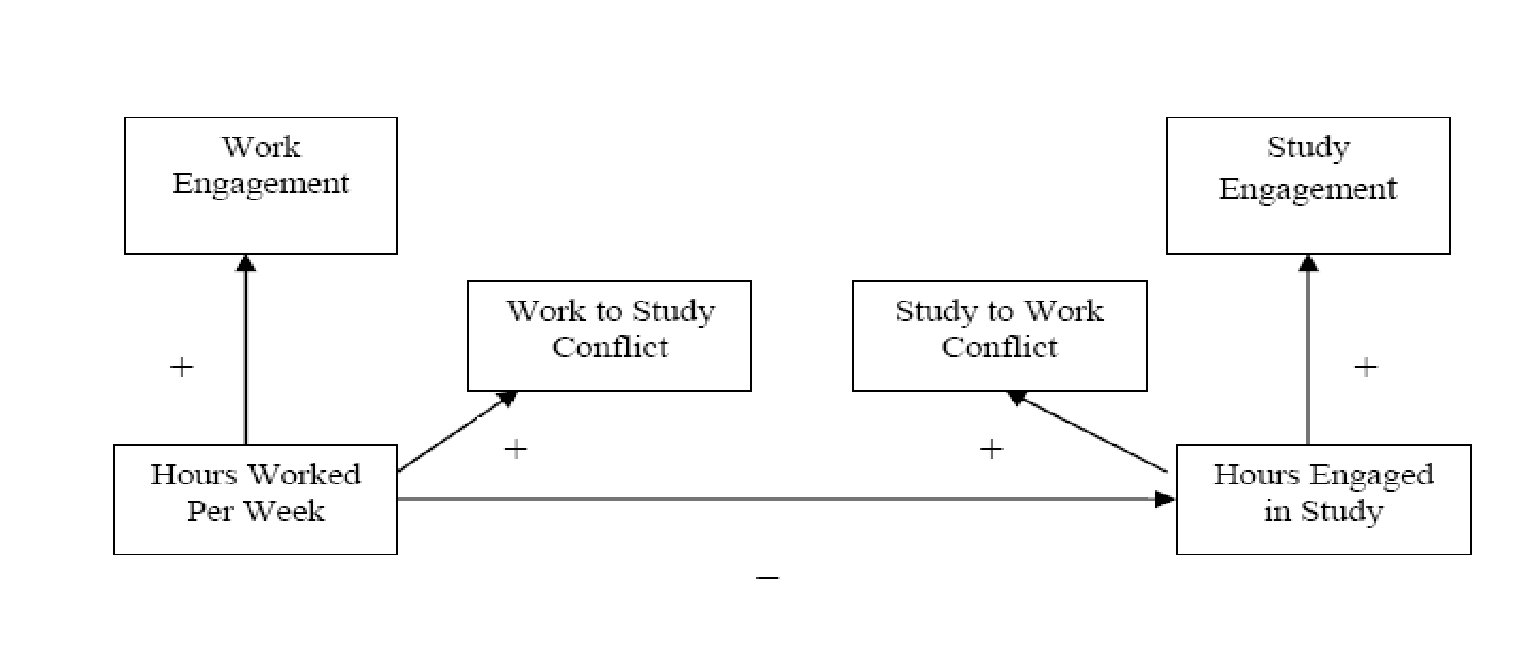
- Theory-building contextualizing work-family conflict as a matter of irreconcilable pressures from “work and family domains” (Greenhaus & Beutell, 1985, p. 77) and the dichotomy proposed by Mills, Lingard, and McLaughlin (2007) between work-to-university conflict and university-to-work conflict.
- Models positing work-study conflict as the central mediator for the conflicting demands felt by students between their work and university requirements, a modifying variable were satisfaction with job and school life is concerned, and a key influencing variable for the burnout outcome (Frone, Yardley & Markel 1997).
Given the negative sign at the bottom of Fig. 4 (overleaf) that predicts an inverse relationship between time available for study and required for work, the Mills, Lingard, and McLaughlin model, therefore, predicts, among other things, increased work-to-university conflict when demands at work rise or are scheduled in unpredictable fashion (2007). Conversely, given the researchers’ hypothesis that time spent at university bears a positive relationship with university-to-work conflict, it stands to reason that a detailed analysis of time allocations made by students is central to the present study instrument.
Findings
Data Management
Concern for data quality impelled both visual inspection and frequency counts in Excel to a) recode information that had been entered as text (e.g. “Fourth-year”) when the variable had been mostly encoded in ordinal and numeric form; b) take the midpoint when time spent at work was expressed as an interval; and, c) eliminate outliers that could not be construed as sensible answers. Visual inspection, concededly cursory, did not reveal any significant ‘halo bias’ in the form of serial answer duplication (Trochim & Donnelly, 2006). The marital status item was recoded by combining all non-single responses (a distinctly small number) into the new variable “Married/Childrearing”. Finally, blank data cells occurred only sporadically and not inconsistent fashion (all across one row, for example). These were considered tolerable and retained.
Descriptive Statistics
All six scale items used in this analysis show means no lower than 4.4 (see Table 7 in Appendix II), meaning that study participants tended to respond above the mid-point of the seven-point agreement or frequency scale. As standard deviations go, SDs of from 0.96 to 1.50 for the same six items impress as average to fairly high in scatter.
The inter-item Cronbach’s alpha of 0.35 (Table 8 in Appendix II) does not meet even the relaxed 0.60 thresholds for reliability. This stands to reason given the mix of items. From the viewpoint of attaining academic goals, the six items are a mix of encouraging and distressing statements (see Table 2 below). Secondly, the scales involved are a mix of agreement and frequency ranges which means consistency is not to be expected.
Table 2.
The correlation matrix also reveals that enthusiasm about academic performance (question 3, item 15 in Table 2 above) is substantively and positively associated with completing priority tasks first (question 6, item 6) and the satisfaction that one is able to accomplish much (“effectively solve many problems,” question 3, item 1).
Hypotheses Testing
Null Hypothesis 1
Recall that H01: there is no difference between single and married students in work-study conflict. The independent samples t-test is suitable because we wish to investigate differences between single and married/child-rearing couples in mean frequency of experiencing “the demands of my work interfere with my study.”
Table 3.
The fact is that only 3.2 percent of the student sample were married or single parents (Table 9 in Appendices II). Secondly, the difference in mean frequency of experiencing work-study conflict is marginal at 4.2 for single students and 4.0 for married or single parents. It stands to reason, therefore, that the independent samples t-test yields at value of 0.21 (taking the unequal variances assumption) that, at 6 degrees of freedom, is associated with a significance statistic p = 0.84. Since this is a far cry from the α < 0.05 confidence level hurdle, we must accept the null hypothesis and conclude that marital status or parentage has nothing to do with the likelihood of work-study conflict. Or that the character of the sample does not warrant the conclusion.
Null Hypothesis 2
H02: there is no difference by academic level in engagement with university study (μ1 = μ2 = μ3 = μ4) or mean ratings on “having learned many interesting things during the course of my studies” (a scale variable). Since differences across three or more groups are being explored, the ANOVA suits.
Table 4: ANOVA Result, Hypothesis 2.
Between-groups variation is so minimal that the generated F value bears an associated significance statistic equivalent to p > 0.05. Since we cannot rule out chance variation, we reject the null hypothesis and conclude that the multiple-learning aspect of resolving work-study conflict does not materially change as one stays longer in university.
Null Hypothesis 3
Recall that RQ3 investigates whether a positive relationship exists between two signposts of academic accomplishment: successful coping with study-work conflict and completing priority tasks as a time management strategy. H03 denies that there is a relationship between coping with study-work conflict successfully and seeing to priority tasks first.
Since both variables are scale items and the research question is about a relationship, one analytical option is a correlation test. The result (Table 5 below) is a correlation coefficient of 0.27 that SPSS reports as significant at p < 0.001. Since such an association can occur by chance less than once in a thousand samples taken, we reject the null hypothesis and accept the alternative. There is a positive correlation between managing tasks according to real, not preferred or convenient priorities, and being an effective problem-solver as a student. In other words, coping with academic challenges is apt to go hand in hand with a correct sense of priorities.
Table 5: Correlation Result.
**. Correlation is significant at the 0.01 level (2-tailed).
Null Hypothesis 4
We test H04, that student burnout cannot be predicted by hours worked per week, attending to tasks by whim, and successfully coping with academic problems, with linear regression. In equation form, the expectation is that (note the negative signs):
Yburnout = a + b1 (X1) – b2 (X2) – b3 (X3)
Where:
- Yburnout = “I feel emotionally drained by my studies”
- X1 = “I organize tasks by preference”;
- X2 = “I can effectively solve the problems that arise in my studies.”
- X3 = total hours worked per week
Inspection of the descriptive statistics (Table 13 Appendices II) and correlation matrix (Table 14 in the Appendices) for all four variables show, first of all that the means for the scale variables are just above the mid-point of the respective seven-point scales. Paid hours per week amounted to just under 20. Dispersions were rather large, ranging from 0.98 to 1.5 for the scale variables and 10 for hours worked per week. The latter means that close to two-thirds of working students were on the job from 10 to 30 hours weekly.
Visual inspection of scatters plots suggest that the feeling of being emotionally drained may rise sharply as hours worked climbs toward even the mean of 20 hours but have no meaningful relationship with self-reported ability to effectively solve problems that come up in school or with whimsical priority-seeking (Figs. 5 to 8 in Appendices II).
This impression of tenuous relationships between the DV burnout and the hypothesized IV’s is borne out by the correlation findings (Table 14, Appendices II). The best that can be said is that there is a 0.11 correlation with organizing tasks according to one’s own preference but this result does not bear the expected sign and the associated significance statistic of p = 0.07 suggests that chance occurrence is at work beyond the preferred value of α = 0.05.
Table 6: The Model Coefficients, Hypothesis 4.
Deriving from the above, the model is expressed as follows:
Yburnout = 4.2 + 0.11 (Organise) – 0.02 (Solve problems) – 0.03 (Hours worked)
The signs are as expected but the β values are so low they fail to hurdle the possibility that the IV’s vary (directly or inversely) with the DV on more than chance variation alone. Moreover, the model explains very little of the average variation in self-reported burnout, if R2 of zero (Table 15, Appendices II) is anything to go by.
Conclusion
Being married or a single parent does not seem to raise the odds of work-study conflict though this conclusion may have been weakened by the fact that more than 96% of the sample were single and even those already ‘burdened’ by housekeeping chores may still be in the throes of the honeymoon years.
Delight at learning much more as one advance at university ought to moderate work-study conflict but the evidence is too weak to advance this hypothesis.
Thirdly, the available data do not permit one to predict student burnout (or at least the conviction of being emotionally drained) on the basis of three selected IVs: hours worked per week, whimsical priority-setting and success at hurdling academic problems.
On the other hand, maturing to a hardnosed sense of priorities is evidently associated with facing up to academic challenges better.
On even such an innocuous matter as study-work conflict, misreporting and outright deception is the bane of all self-report surveys based on voluntary participation, especially in the absence of an external validation measure or (something not available in the given database) an assessment of test-retest reliability. Despite the most neutral or carefully-worded introductions, students in the throes of work-study or study-work conflict essentially have little to gain from participation in this type of study. On the contrary, they may fear that their status at university will be adversely affected by coming under scrutiny. In this light, the inclusion of student IDs may assist with reliability measures in the future but represents a mortal drawback to this cross-sectional study.
Such misgivings are based on the fact that the failure to reject three out of four null hypotheses conceptually runs counter to the findings of Markel and Frone (1998), for example, that hours worked each week correlates positively with work-study conflict in precisely this age cohort. Such conflict extends to adults. Part of the solution, flexible time schedules, has already gained wide acceptance in the UK (Hooker, Neathey, Casebourne, & Munro, 2007).
Voluntary participation also introduces skewed profiles. The distribution of courses may not even be representative of the RMIT student population. Even more glaring, it does not make sense to gather data on marriage and child-rearing if there are too few such students in RMIT.
Reference
Frone, M R, Yardley, J K & Markel, K S (1997). Developing and testing an integrative model of the work-family interface. Journal of Vocational Behavior, 50, 145-67.
Greenhaus, J.H., & Beutell, N.J. (1985). Sources of conflict between work and family roles, Academy of Management Review, 10, pp.76-88.
Hooker, H., Neathey, F., Casebourne, J. & Munro, M. (2007). The third work-life balance employee survey: Main findings. Employment Relations Research Series No. 58. London: Institute For Employment Studies/Dept. of Trade and Industry.
Markel, K S & Frone, M R (1998). Job characteristics, work-school conflict and school outcomes among adolescents: Testing a structural model. Journal of Applied Psychology, 83, 277-87.
Mills, A., Lingard, H. & McLaughlin, P. (2007). A model of the conflicts between student work and study. Melbourne, Victoria (Australia): RMIT University.
Trochim, W. & Donnelly, J. P. (2006).The research methods knowledge base. Mason, OH: Atomic Dog Publishing.
Appendix I: Spss Outputs
Table 7: Descriptive Statistics for Items Used.
Table 8.
Table 9: Group Statistics for Null Hypothesis 1.
Table 10: Descriptives for ANOVA, Hypothesis 2.
Table 11: Levene’s Statistic for ANOVA, Hypothesis 2.
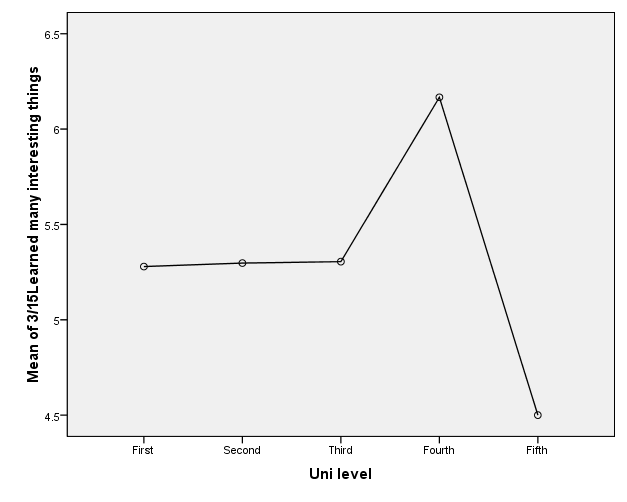
Table 12: Descriptive Statistics Preparatory to Correlation Run, Hypothesis 3.
Table 13: Descriptive Statistics, Hypothesis 4.
Table 14: Intercorrelation Matrix, Hypothesis 4.
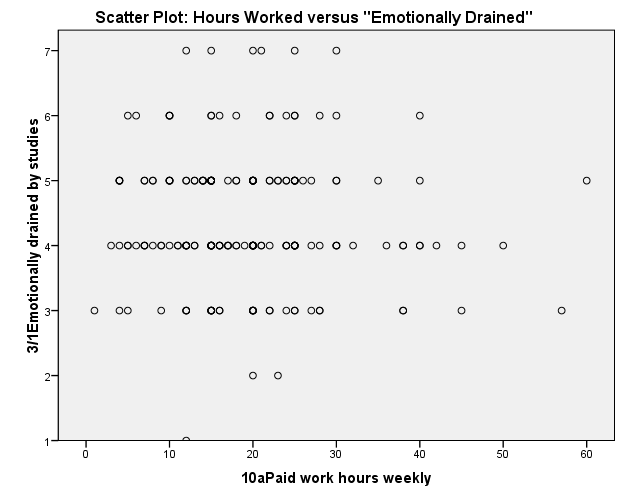
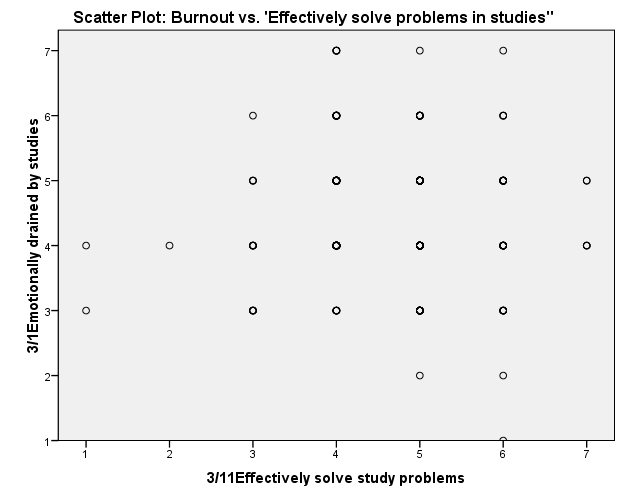
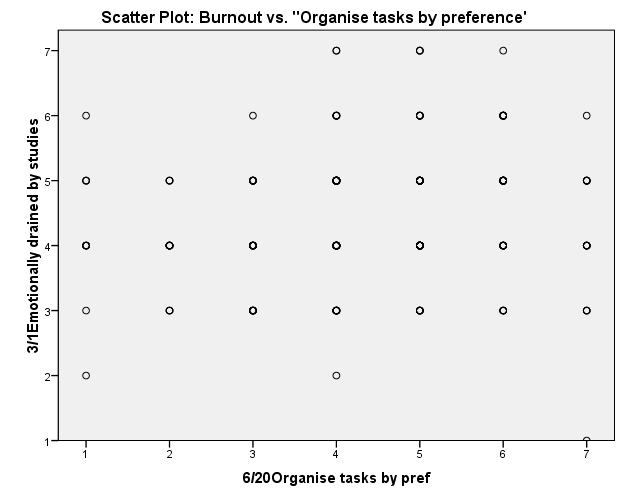
Table 15: Regression Model Summary, Hypothesis 4.
a. Predictors: (Constant), 10aPaid work hours weekly, 6/20Organise tasks by pref, 3/11Effectively solve study problems.