Introduction to Country Analysis
Demographics and Geography
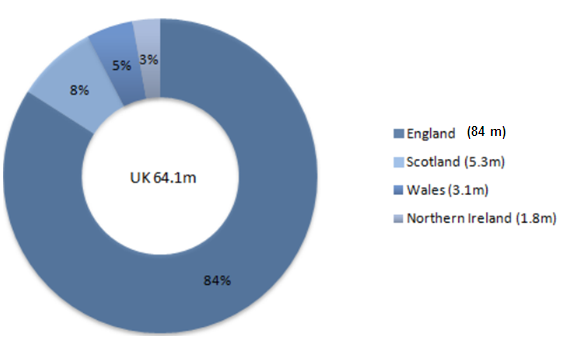
The UK (United Kingdom) is an autonomous state situated on the northwestern coast of Europe. It comprises four countries namely England, Northern Ireland, Wales and Scotland, and covers an area of approximately 243,000 km2. The population of the country is estimated at 64.1 million people (Kuper, 2013), which places it among the most populous countries. The ethnic makeup according to the 2011 census is 92.1% white (English 84%, Scottish 5.3%, Welsh 3.1%, Northern Irish 1.8%). The religious groups include the Christians (Methodist, Anglican, Presbyterian, and the Roman Catholic) that make 71.6% while Muslims consist 2.7%, the Hindus comprise 1%, and other religions constitute 24.7%.

Society and Culture
The UK culture entails the archetypes of human activities and representations accompanying the UK and its citizens. Christians dominate the state (Rey 2015). The four countries have distinct societal structures, customs, symbolisms, and culture that influence the culture of the state (Guidolin, Hyde, McMillan, & Ono, 2014). The geographical distinctions have brought about a strong sense of nationalism and identity that is portrayed by the citizens of these countries. Due to the accommodation of a large population of immigrants from former colonies, a previously homogenous society has become diverse. The immigrants are from countries such as West Indies, India, and Pakistan. Therefore, the cultural definition of the UK is a complex affair (Gopinath, Helpman & Rogoff, 2014).
Political System
The UK is a constitutional monarchy that employs a parliamentary system of governance. A monarchy is a governing system where dominion is embodied in several individuals (the monarchs) until they die or resign. In a constitutional monarchy, the ruling powers of the monarch are controlled by the constitution. The current monarch is Queen Elizabeth the second who has ruled since 1952. A parliamentary system, conversely, is a structure of self-governing control of a state wherein the decision-making office is accountable to and obtains its democratic legitimacy from the parliament. In such a system, the head of state and the head of government are two different people.
Corruption Ranking and Transparency
In 2014, the UK ranked 11th with a score of 78 in the corruption perceptions index, which was an improvement from position 14 with 76 points in 2013 (Transparency International, 2015). Despite the increased access and fairness to higher education, there is a variation in the distribution of wealth and evidence of class system (Giglio, Kelly, & Pruitt, 2015).
Monetary Policy and Macro Economic Indicators
Central Bank Policy and Stabilization
Economic policies refer to standards that govern the taxation processes, government budgets, and the supplies of money. It also includes the interest rates in the labor markets and other areas that require government interventions in improving and stabilizing the economy (Gopinath, Helpman & Rogoff, 2014). The Bank of England is the central bank in the UK. Monetary stability implies steady prices and certainty in the currency. Steady prices are determined by the government’s inflation goals, which the Bank of England tries to achieve by implementing the recommendations of the Monetary Policy Committee (MPC).
Fiscal Policy
Fiscal policies refer to the premeditated adjustment of government expenditure or taxation to aid in realizing anticipated macro-economic goals by altering the extent and constituents of aggregate demand. The common economic policies are categorized into two as discretionary and automatic. The UK government spent £673.9 billion in 2013 on welfare and pensions, which included expenses on health, edification, public organization and security.
The UK treasury obtains most of its funds from direct taxes including income and corporation taxes, as well as ancillary levies such as Value Added Tax. The central and local authorities impose levies on the usage of their facilities. National insurance and fuel duties are other revenue sources. In cases of deficits, loans are obtained from international organizations such as World Bank and International Monetary Fund (Rey 2015).
Taxes and Wages
The business and companies in the UK apply the trans-border rule to transact business across the four countries, which promotes the compliance with international tax rules such as transfer pricing rules and the cross-border transaction (Giglio, Kelly & Pruitt, 2015). All UK residents pay taxes on their income including wages, benefits, pension, and interest on savings (taxed at a basic rate of 20%). Self-employed people, conversely, have to fill a self-assessment tax returns form. Visitors on short visits such as business trips and training are exempted from paying income taxes. Additionally, no tax is paid on personal allowances, which is equivalent to £10,600.
Unemployment Rate
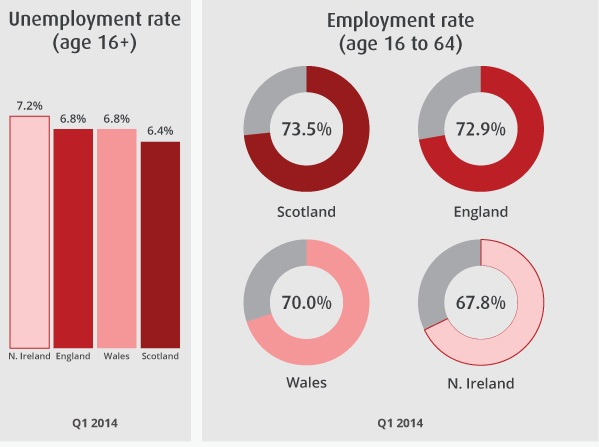
In the final part of 2013, the unemployment level in the UK for individuals aged between 16 and 64 was 6.8%, which translated to 7.2%, 6.8%, 6.8%, and 6.4% for Northern Ireland, England, Wales, and Scotland respectively.

Interest Rate
The Monetary Policy Committee has agreed to maintain the bank interest rates at 0.5%. The interest rate in the UK is an average of 7.91% between 1971 and 2015. The standard interest rate is established by Monetary Policy Committee while the rates used by the Bank of England is referred to as the repo rate, which affects open market processes of the bank with a group of other institutions such as depositories, building societies and securities companies.
CPI (Inflation Rate)
The UK has recorded a decrease in CPI inflation rate in the last three years. The rates were 2.71% in 2012, 2.00% in 2013 and 0.55% in 2014.
PPP and the Big Mac Index
The Big Mac Index is a casual way of assessing purchases. It provides an understanding of the purchasing power parity (PPP) that can exist between two currencies in the market. The measurements can provide the extent to which exchange rates in the markets vary and helps understand the costing of goods to the different countries. The UK government has reason to be optimistic because the sterling pound is trading right closer against the dollar in the market. The Big Mac Index indicates that the pound is within a deviation of 10%.
Debt to GDP ratio
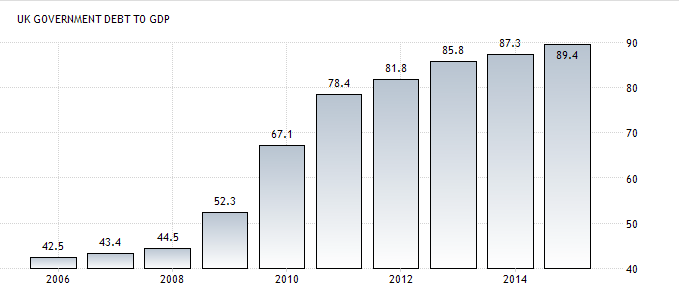
The UK documented a government debt to GDP ratio of 89.40% of the country’s GDP for the year 2014. The Government Debt to GDP in the UK is averaged at 49.48% since the year 1980 to the year 2014. It reached the highest score of 89.40% in 2014 (Gordon, 2012).

Production and Growth
Education and Human Capital
Human capital is a gauge of personal proficiencies, know-how, abilities, social traits, character and health features. These features influence an individual’s ability to work and produce an output of economic value. Human capital is estimated as the summation of the possible future earnings of all people within the labor market. The worth of employed human capital was £17.61 trillion in 2013. In the same year, the mean employed human capital reserve per head of employed age populace was £437,561, which was a slight drop by £2,756 in 2012. Individuals with GCSE scores A to C as their maximum qualification constituted 86.4% of employed human capital.
Property Rights
Property laws denote the rules regarding the acquisition, sharing and protection of valuable assets. The property rights vary in the four countries. In May 2014, a novel Intellectual Property Act was approved by the government to improve and protect the intellectual property rights of businessmen in and out of the UK. The property rights index evaluates the extent to which a country’s laws safeguard private property privileges and how far the government goes to implement those laws. The UK has a property rights index of 90, implying that it protects its citizens’ property rights to a large extent.
Infrastructure Spending
The UK government prides itself in an extensively developed, shared communication network and transport infrastructure among its countries. There is adequate connectivity of businesses and individuals within the UK. The UK economy has recorded tremendous growth since 2013. By the end of 2014, the overall infrastructure spending had reached £72 billion. Infrastructure contracts have increased in the recent months, which translates to a 71.7 % increase from 2014.
The UK’s portion of European infrastructure capital spending is anticipated to increase from 22% to 23% in 2025 when total expenditure is expected to reach £110 billion. The patterns of expenditure are expected to follow a different trend. Transportation and utilities infrastructure are going to be accorded more importance than extraction and telecommunications. The most recent infrastructure spending has been used on the Haverigg wind farm in Cumbria and the Swansea Bay Tidal Lagoon.
FDI and Ease of Doing Business
Foreign direct investment (FDI) denotes the flow of capital from one country to another. The UK is a chief investor overseas and a major receiver of incoming ventures. The UK constantly receives more than a fifth of inward venture capital into the EU. The UK has more than 18,000 different investors with 1.8m people receiving the direct backing of inward investment. Foreign companies constitute roughly 40% of the best 100 UK exporters.
The UK took the 9th and 8th positions in the ease of doing business index for 2013 and 2014 implying that the regulatory environment in the country is fairly conducive for business operations. The UK government has established laws that protect the consumers from the exploitative markets practices (Li & Mak, 2014). The privatization of industries has increased competitiveness and improved the industrial sector.
International Trade, Exchange Rates, and Capital Flows
Fixed or Floating Currency
The stability of the pound and the fiscal standing has enabled the UK government to attract investments from the foreign investors. Therefore, the UK is the second largest investment destination. About 30% of all the foreign investments directed to the EU end up in the UK. USA’s investments in the UK account for 44% of all the foreign investments. The foreign investors account for 5% of the GDP.
Main Imports and Exports
The UK is recognized as the primary trade partner in the European Union. According to Li and Mak (2014), approximately 58 percent of the exports from the UK are exported to EU nations. The largest market for UK’s exports is America. Similarly, UK imports from other countries. However, UK’s imports exceed its exports leading to a trade deficit, which is attributed to rising demand for consumer products, a plunge in UK manufacturing and a decrease in local oil and gas production.
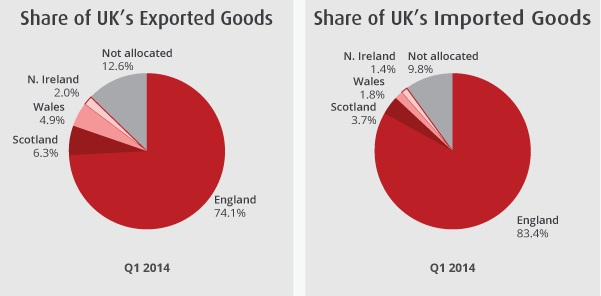
For example, in 2012, the total imports amounted to 646 billion US dollars while the exports were only worth 480 billion US dollars. America provides about 14% of the total imports to the UK (Gopinath, Helpman & Rogoff, 2014). UK’s main exports include manufactured items, fuels, chemicals, food, drinks, and tobacco. The main imports include manufactured goods, machinery sand food items. The distribution of imports and exports among the countries is shown in figure 3.

Openness to Trade
The economy of the UK is dependent mainly on foreign trading. Therefore, the state supports trade as seen in the state’s role international trading organizations such as the EU and the World Trade Organization (WTO). There are few restrictions on foreign trading and investments. 12% of the largest corporations in the UK are associated with America (Parutis, 2014).
Oil Exports as a Percent of GDP
The oil and the gas industry contributes 16.4% of the total tax collected and performs better than other industries like mining, manufacturing, and quarrying. Taxes are also generated from companies that use fuel. Therefore, the estimated Total Tax Contribution (TTC) is £30.1 billion that translates to 5.5% of the total tax and revenues.
Conclusion
Oil is the major foreign income earner in the UK. In addition, the environment is conducive for investment in terms of government and monetary policies. The economy of the UK has a bright future. However, there is a need to increase exports and reduce imports to lower the margin of trade deficits recorded.
References
Giglio, S., Kelly, B. T., & Pruitt, S. (2015). Systemic risk and the macroeconomy: An empirical evaluation (No. w20963). National Bureau of Economic Research. Web.
Gopinath, G., Helpman, E., & Rogoff, K. (2014). Handbook of international economics (Vol. 4). New York: Elsevier. Web.
Gordon, R. J. (2012). Is US economic growth over? Faltering innovation confronts the six headwinds (No. w18315). National Bureau of Economic Research. Web.
Guidolin, M., Hyde, S., McMillan, D., & Ono, S. (2014). Does the Macroeconomy Predict UK Asset Returns in a Nonlinear Fashion? Comprehensive Out‐of‐Sample Evidence. Oxford Bulletin of Economics and Statistics, 76(4), 510-535. Web.
Kuper, A. (2013). The social science encyclopedia. London: Routledge. Web.
Li, R. Y. M., & Mak, L. (2014). The Effect of the Global Subprime Financial Crisis on the Macroeconomy and the Housing Market in the UK. In Li, R. Y. M (Ed.). Law, Economics and Finance of the Real Estate Market (pp. 105-117). Berlin Heidelberg: Springer. Web.
Office for National Statistics. (2015). Economics. Web.
Parutis, V. (2014). “Economic Migrants” or “Middling Transnationals”? East European Migrants’ Experiences of Work in the UK. International Migration, 52(1), 36-55. Web.
Rey, H. (2015). Dilemma not trilemma: the global financial cycle and monetary policy independence (No. w21162). National Bureau of Economic Research. Web.
Transparency International. (2014). Corruption Perceptions Index. Web.