Introduction
This chapter contains the findings of the survey devoted to the cultural elements of teaching English as a Foreign Language in Libya. The results of the survey’s analysis with the help of SPSS software are offered in the form of tables and graphs. The findings are arranged into five key subtopics that the study intended to explore. Please note that some of the questions allowed choosing several options, which may have led to total numbers of responses that are greater than the sample’s size.
With respect to SPSS, the following facts are noteworthy. The analysis of the surveys involved gathering the results and arranging them into datasets, which were then entered into SPSS and processed. Descriptive statistics were used for all responses; in particular, frequencies of specific answers and their percentages were employed to demonstrate the most popular viewpoints. Furthermore, for some questions, the mean, median, and mode were used to indicate the average value of a specific variable; the three terms refer to the different ways of determining the average of a dataset. In particular, the mean is the typical approach to calculating the average (one which involves adding values and dividing them by their number). The median stands for the “middle” value (one that would appear in the middle of a list of values), and the mode signifies the most frequent value in a dataset.
Moreover, two of the variables of the survey (students’ attitudes to learning cultural aspects and their inclusion in lessons) were tested for a relationship between them with the help of inferential statistical tests. The variables were chosen because the survey intended to determine the relationship between the two phenomena. Finally, most of the responses received some form of graphical representation (for instance, histograms and pie charts). Graphs made the text more illustrative as opposed to the tables which offer more details and require closer attention to decipher.
Demographic Information of the Teachers
The present section aims to describe the sample of the survey and demonstrate the ability of the participants to present expert opinions on the topics of interest. The age, gender, and expertise of the teachers are examined; the latter includes qualifications and experience. The results show that the teachers, who are mostly female and older than 35 years, have the required experience and education to be able to respond to the questions of the survey.
Age
The age of the participants was determined to describe the sample. Question 1 was used for this section; it reads as follows: what is your age?
Table 1. Age of the Teachers: Mean, Median, Mode.
To be able to read table 1, please note that the data was coded. In particular, specific numbers (1, 2, and 3) were used to denote the categories under 25, 25-35, and over 35. The missing values may include the responses that were not provided (skipped), confounding responses (for instance, those that included opposing viewpoints), and, in some cases, technical failures. Table 1 contains no missing values, but they can be found in other tables.
As shown by table 1 above, the mean age of respondents fell in the category older than 35 years (number 3 was used to denote this group). In addition to that, the median age also falls into the same category. This information allows concluding that most of the individuals who participated in the study were older than 35 years.
Table 2. Age of the Teachers: Percentages and Frequency.
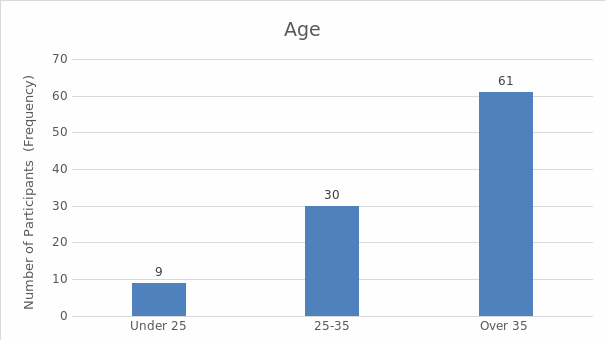
From frequency table 2, it can be seen that 9% of the research respondents were under 25 years of age. In addition to that, 30% of them were between 25 and 35 years while 61% of the research participants were above 35 years. The total number of respondents was 100 (see fig. 1).
Gender
The information about gender was also used to characterize the sample. Question 2 was used to that effect, and it reads as follows: what is your gender?
Table 3. Gender of the Teachers: Mean, Median, Mode.
Table 4. Gender of the Teachers: Percentages and Frequency.
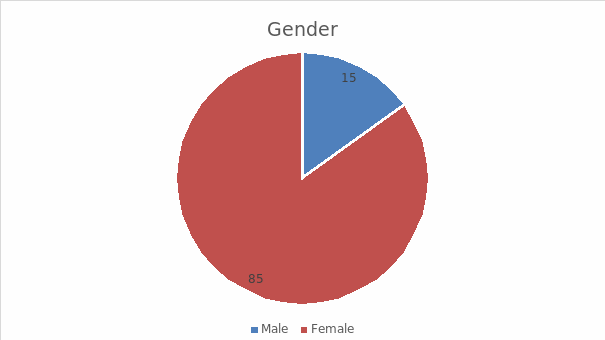
Since the majority of the participants are female, the mean and median gender fall in the same category (see table 3). As seen in table 4, 15 of the research participants were male. Therefore, men constituted 15% of the total number of people who agreed to respond to the questionnaire. The remaining 85 respondents were female, which was 85% of the total individuals who took part in the exploration (see fig. 2).
Highest Qualification
The qualifications of the participants directly demonstrate their ability to respond to the survey. Question 3 asked the participants to describe their qualifications; it reads as follows: what is your highest qualification?
Table 5. Qualifications of the Teachers: Mean, Median, Mode.
Table 6. Qualifications of the Teachers: Percentages and Frequency.
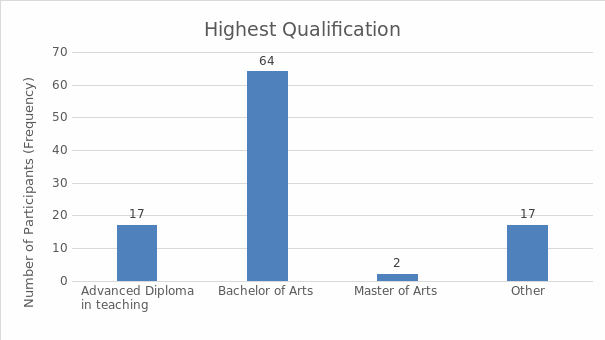
Table 5 uses coding for the categories that can be found in table 6. Most of the respondents fell in the category of those with a Bachelor of Arts degree; hence, the mean highest academic qualification was found to fall within this group (see table 5). According to the data that was obtained from the questionnaire, 17% of the participants had acquired an advanced diploma in teaching as their highest academic accomplishment. Apart from that, 64% of them had a Bachelor’s degree in Arts. In addition, two participants (2%) had a Master of Arts degree. The rest of the respondents had attained other levels of education that they did not specify (see table 6 and fig. 3).
Teaching Experience
The teaching experience of the respondents is another characteristic that proves their ability to respond to the survey. Question 4 was used in this section; it reads as follows: how long have you been teaching English?
Table 7. Experience of the Teachers: Percentages.
Table 8. Experience of the Teachers: Percentages and Frequency.
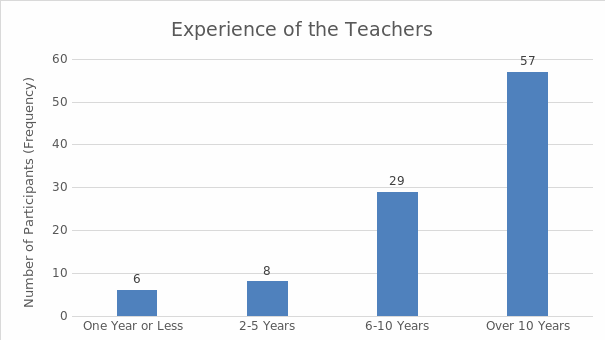
Table 8 uses codes once again. For categories one year or less, two-five years, 6-10 years, and more than 10 years, numbers 1, 2, 3, and 4 were used respectively. As a result, for instance, the category one year or less was labeled as 1. The median and mean of the experience parameter indicate that most participants were experienced: number 3 is used for the experience between six and ten years, and number 4 denotes more than ten years in table 7. As shown in table 8, 6% of the respondents had worked for one year or less in the teaching profession, 8% had worked for a period ranging between two and five years, and 27% of the participants had been in the teaching profession for between six and ten years. The remaining 59% had worked as teachers for more than ten years. Thus, most of the individuals who were chosen to participate in the research were experienced (see fig. 4). This way, it was possible to obtain reliable feedback as they have been staying in the field for a relatively long period of time. Therefore, they can have expert opinions on the process of teaching and, possibly, the challenges faced by both teachers and students with respect to cultural competency.
Teacher’s Perception of Culture and Teaching it
The second section focuses on the ideas, beliefs, and views of the teachers with respect to teaching cultural aspects. This part of the analysis includes multiple questions about the teachers’ perspectives on the importance of including culture in language teaching and the methods of achieving this inclusion.
What A Libyan Textbook Should Include
The first question in this section, (question 7), asks the participants to determine if Libyan textbooks need cultural elements. The question prompts the participants to finish the following sentence: Libyan English syllabus/textbooks should include (…).
Table 9. Question 7: Mean, Median, Mode.
Table 10. Question 7: Percentages and Frequency.
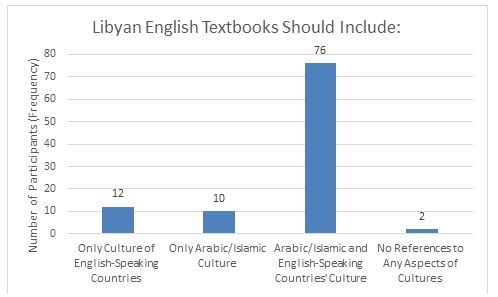
In table 9, number 1 is used to denote the answer which highlights the significance of introducing varied cultural elements in textbooks. It demonstrates that the average respondent views such cultural elements as important. Indeed, 76 of the respondents are of the opinion that English textbooks in Libya should include a mixture of aspects of Arabic/Islamic and English-speaking countries’ culture (see table 10). This figure amounts to 76% of the total responses obtained under this section. 12 of the research respondents suggested that the English textbooks should contain information about the culture of English-speaking countries only, accounting for 12% of the total responses. Only ten research participants felt that textbooks should include exclusively the aspects of the Arabic or Islamic culture, which is equivalent to 10% of the total responses. Notably, two of the answers indicated no reference to any of the cultures that were suggested in the questionnaire (see fig. 5).
Cultures that should be included and learned
Question 8 asks the participants which cultures should specifically be included. It names several cultures (British, American, Libyan, and so on) and offers to rate them to reflect their importance.
British Culture
Table 11. Importance of British Culture: Percentages and Frequency.
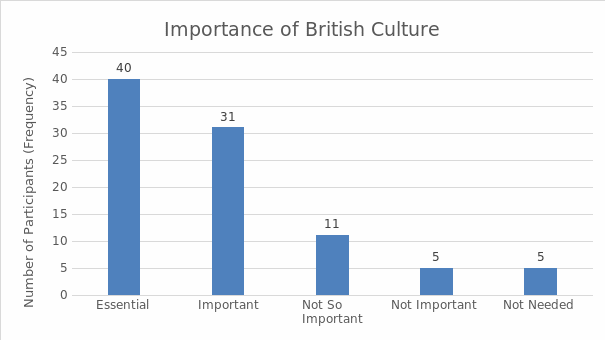
When reading table 12 and the following ones, please note that in the cases when total responses are greater than 100, some participants provided several responses, which affected relevant percentages. When asked to rate the importance of learning about British culture to the Libyan education curriculum, 40 of the respondents posited that it was an essential requirement for students and teachers in the country (39.2% of the total responses). Table 11 shows that 31 research participants suggested that it was important for the British culture to be incorporated in the Libyan English curriculum (30.4% of the total responses received).
In addition to that, 11 participants, which means 10.8% of the research respondents, felt that it was not so important to include the British culture in the learning activities of schools in Libya. Five respondents felt that it was not important to incorporate this culture, and five more were of the opinion that there was no need for the inclusion of this culture in the curriculum of the country. Fig. 6 uses numbers to denote the five described groups; number 1 is employed for the people who view the British culture as essential, and number 5 is for those who do not believe that it is needed.
Additionally, English-speaking countries were considered.
Table 12. Importance of English-Speaking Cultures: Percentages and Frequency.
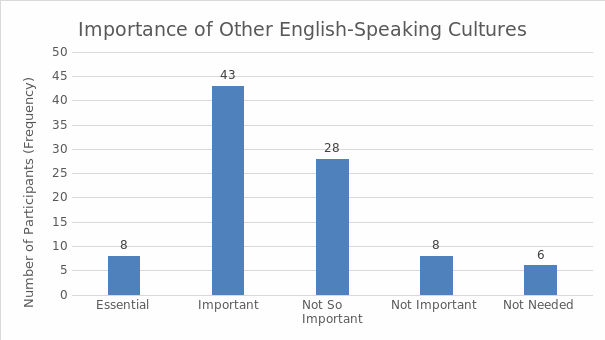
Eight of the research respondents were of the opinion that it was essential for other cultures of English-speaking countries to be incorporated in the Libyan education curriculum (see table 12). This number constituted 8.6% of the responses that were obtained under this section. In addition to that, 28 respondents (30.11%) felt that it was not so important for the cultures of other English-speaking countries to be included in the Libyan curriculum. Eight of them were of the opinion that it was not important at all: in other words, they suggested that it could be included but was not of any significance. Lastly, six research participants (6.45%) noted that there was no need for the inclusion of the cultures of other English-speaking nations in the curriculum of Libya, telling that it should not be used at all. Fig. 7 graphically represents these viewpoints the way fig. 6 does.
American Culture
The American culture was also reviewed in the same section.
Table 13. Importance of American Culture: Percentages and Frequency.
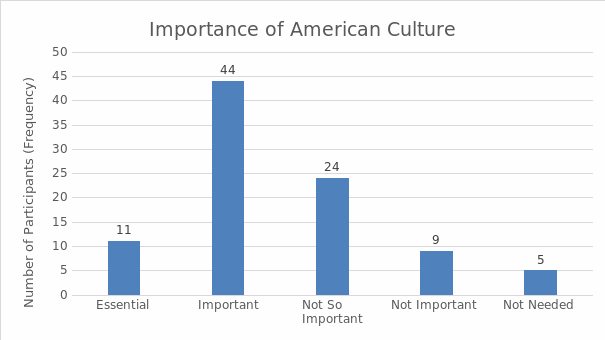
Eleven of the research participants were of the opinion that it is essential to include the American culture in the learning activities of the students in Libya. This number made up 11.83% of the total responses (see table 13). A higher number of 44 (47.31%) respondents felt that it was important to include the American culture, but 24 participants (25.81%) stated that it was not so important to consider the inclusion. Additionally, nine of the teachers (9.68%) posited that it was not important to incorporate this culture, and five more respondents (5.38%) were completely against the inclusion. See fig. 8 to find that the differences between the attitudes to the British and American cultures are rather notable. Overall, the latter appears to be viewed as important while the former seems to be perceived as essential.
Libyan Culture
The same question also required rating the significance of the culture of Libya.
Table 14. Importance of Libyan Culture: Percentages and Frequency.
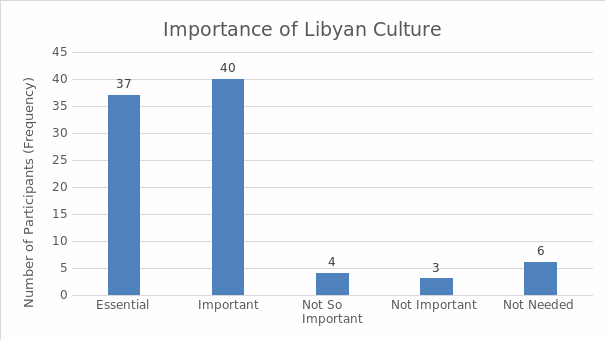
As shown in the frequency distribution table 14 above, 22% of the people who responded to this prompt felt that it was essential for the books and curriculum of Libya to be predominantly characterized by the Libyan culture. Moreover, 23.8% of them were of the opinion that the inclusion of the country’s culture in the education curriculum was important. Contrary to that, 2.4 % of the research participants felt that it was not so important to include Libyan culture. 1.8% of the participants posited that it was not necessary, and 3.6% felt there was no need for such inclusion (see fig. 9).
International Culture
Additionally, the same question suggested considering international culture, that is, the culture that cannot be viewed as characteristic of a particular country and appears to cross borders. An example is the marriage, which may change its forms but is still present in a variety of countries in the contexts of different beliefs and religions.
Table 15. Importance of International Culture: Percentages and Frequency.
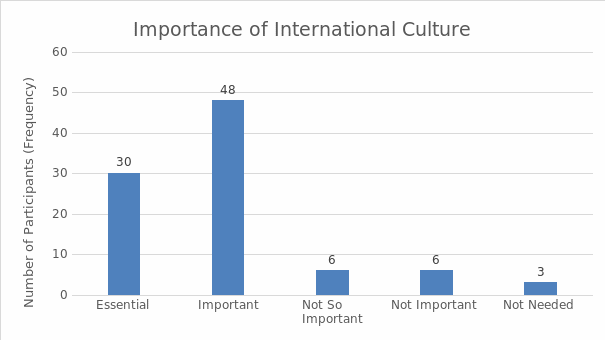
As seen in table 15, 17.9% of the research participants posited that it was essential for the stakeholders of Libya’s education sector to ensure that international culture was included in the country’s curriculum. Another 28.6% of them thought it is important for this intervention to be implemented. On the other hand, 3.6% felt that it was not so important or that was not important to incorporate international culture in the Libyan culture. 1.8% of the respondents felt that it was not necessary. Fig. 10 illustrates these views.
Effects of Teaching the Cultures of English Speaking Countries
Question 11 is used to determine the effect that teaching various aspects of culture has on learners. The prompt was phrased as follows: do you think teaching aspects of the culture of English speaking countries may affect the students’…? Note that the question did not focus on the negative or positive effects; it simply intended to pinpoint the fact of influence.
Table 16. Teaching ESC and Students.
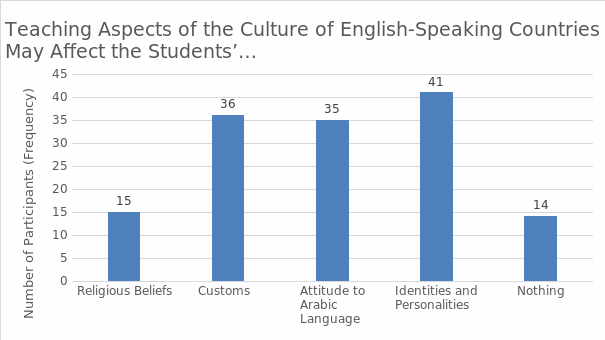
As shown in table 16, 8.9% of the research respondents are of the opinion that when teachers include materials about the cultures of the nations that speak English in their lessons, they impact the religious beliefs of their students. In addition to that, 21.4% of the respondents posited that teaching such cultures would have a significant effect on the learners’ customs. Besides that, 20.8% of the research participants were of the opinion that the kind of attitude that students have towards the Arabic language would be significantly affected by the discussion of the cultures of the countries in which most of the residents are English speakers. In addition to that, 24.8% of the research respondents felt that through the teaching of the cultures of English-speaking nations, the identities and the personalities of the students are affected. Lastly, only 8.3% of the research respondents felt that the teaching of English culture in Libyan classes would have no impact on students (see fig. 11).
Culturally Inappropriate Content
Question 12 prompted the discussion of the cultural appropriateness of the available textbooks. It was phrased as follows: do you feel there is any culturally “inappropriate” content in the textbook you use?
Table 17. Culturally Inappropriate Content.
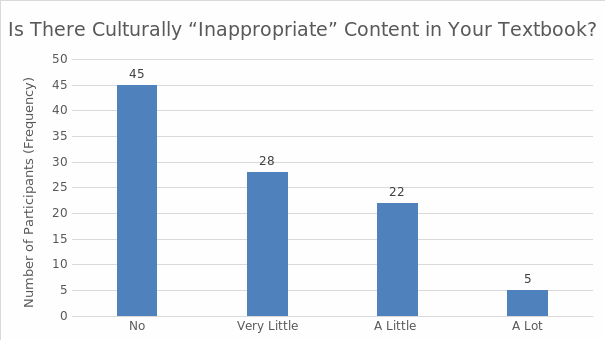
To this question, 26.8% of the research respondents said that there was no material in the books which was inappropriate. In addition to that, 16.7% of the respondents felt that there was very little content in the reference materials used in classes which was culturally inappropriate (see table 17). On the contrary, 13.1% of the respondents argued that there was a little content which was against the country’s culturally accepted code of behavior. Lastly, 3% of the participants were of the opinion that there was a lot of content in the reference materials which violated what was culturally accepted (see fig. 12).
Aspects of Language that Can be Developed through Culture Teaching
Question 13 was phrased in the following way: which aspects of language teaching can be developed while focusing on English culture in an EFL classroom.
Table 18. Culture and Language Teaching.
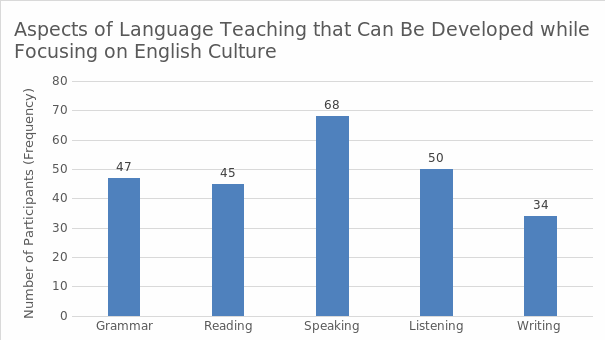
Out of the 245 responses that were received from the questionnaire (see table 18), 47 (19.2%) indicated that the grammar section could be developed while focusing on English culture in an EFL classroom. In addition to that, 18% of the responses pointed out the fact that the same was applicable to the reading section. Besides, 27.8% of the feedback focused on the speaking section. In addition to that, 50 responses (20.4%) noted the listening part of the Libyan curriculum. Moreover, 13.9% of the research respondents were in support of the idea that the writing part could be developed while focusing on English culture in an EFL classroom (see fig. 13).
Teaching Cultural Activities
Question 14 inquired about the approaches to teaching culture employed by the respondents. In particular, it was phrased as follows: what do you think is most useful for teaching culture?
Table 19. Tools for Teaching Culture.
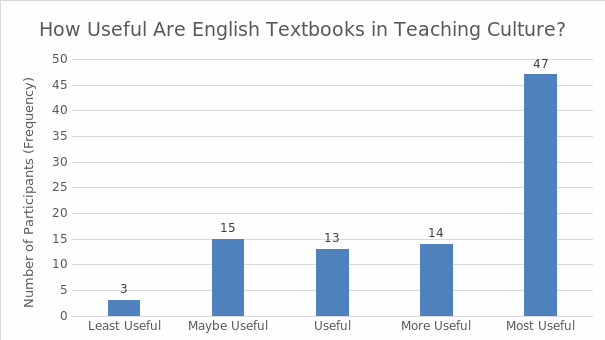
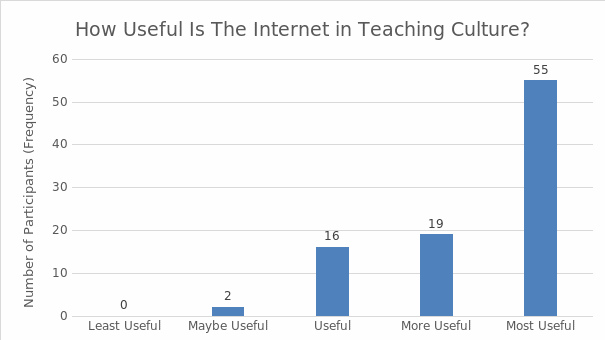
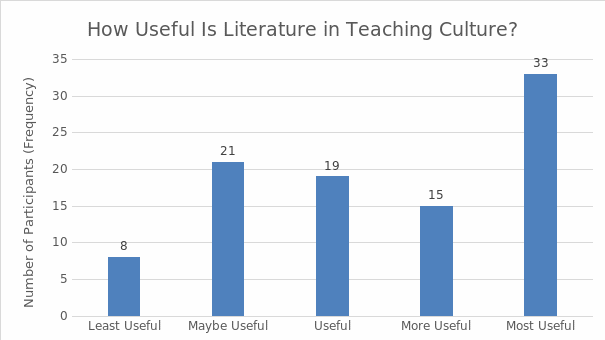
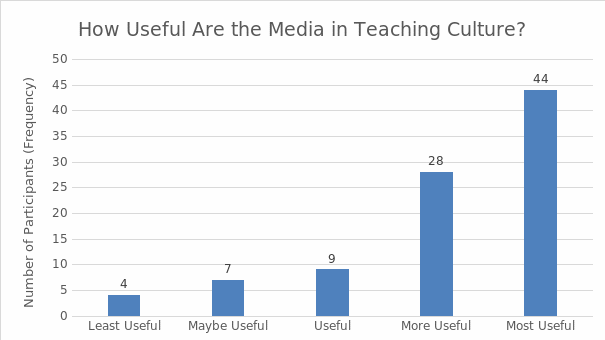
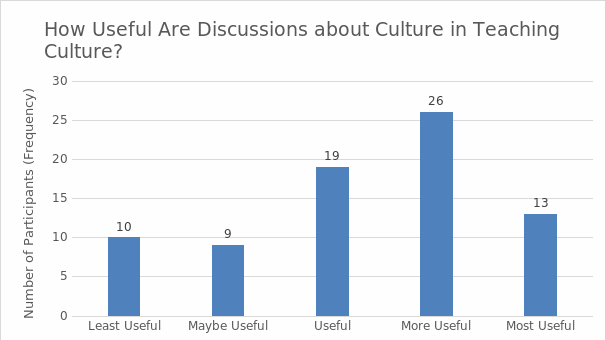
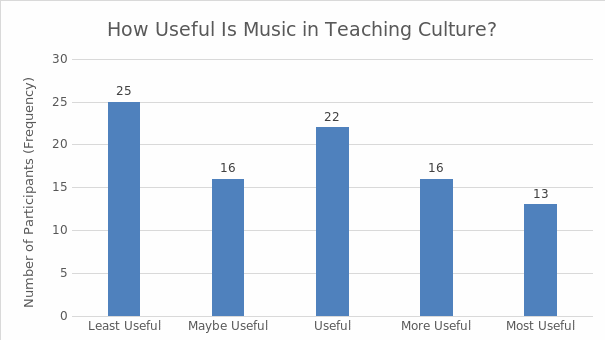
Table 19 displays the data that was gathered on teaching cultural activities; the first row indicates the number of valid responses while the mean, median, and mode demonstrate the answers themselves on a scale ranging from “least useful” (1) to “most useful” (5). The mean for Libyan English textbooks was 3.95 with a median of 5 and mode of 5. Hence, most of the respondents rated the use of English textbooks as useful (see fig. 14). The use of the Internet was also regarded as most important, followed by literature (see fig. 16) and other media (see fig. 17). Activities such as discussions (see fig. 18) and music (see fig. 19) were not described as most important. It is noteworthy that for the latter, the opinions were polarized. The graphs below illustrate the information.
Please note that the graphs do not use the means to describe the categories. Instead, the figures which indicate the general number of responses (that is, their frequencies) are employed.
Cultural Activities
Question 15 asked the participants to consider different aspects of culture. It was phrased as follows: in your opinion, what are the most important aspects of culture that should be emphasized?
Table 20. Aspects of Culture to be Emphasized.
Table 21. Aspects of Culture to be Emphasized (Continued).
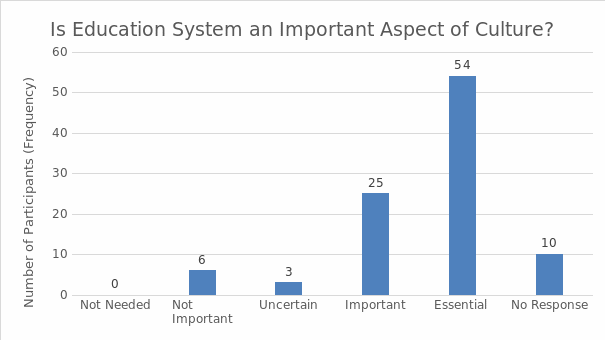
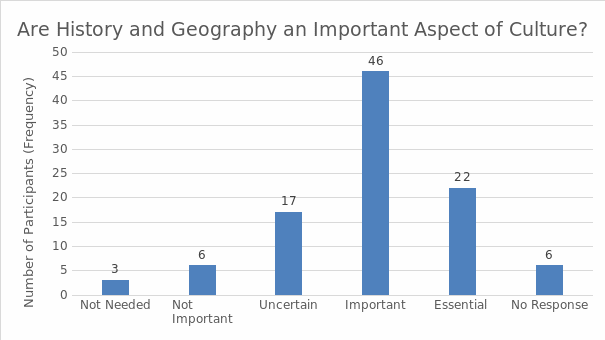
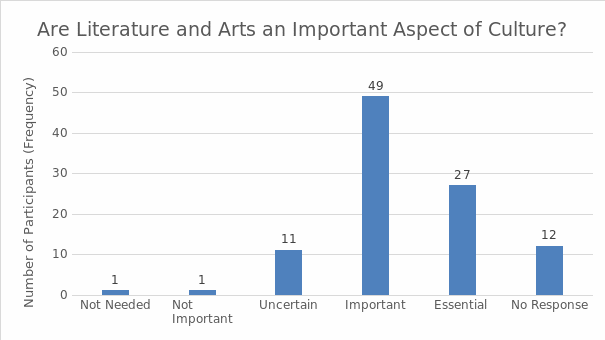
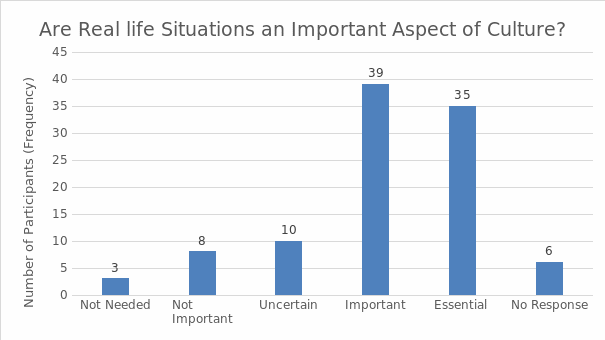
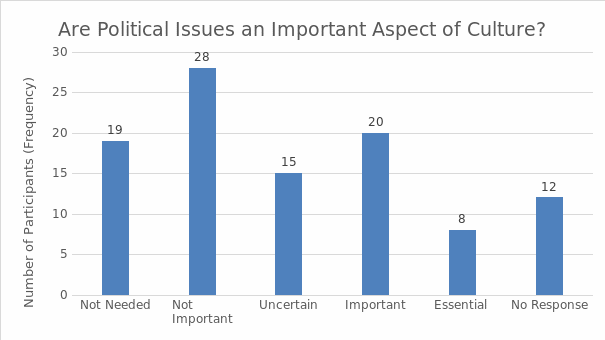
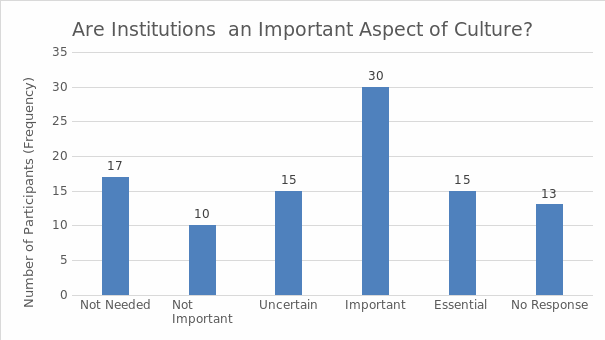
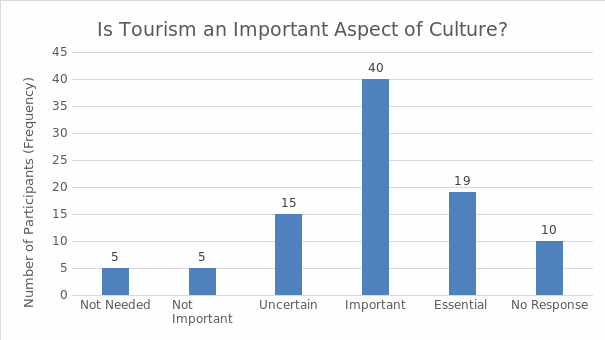
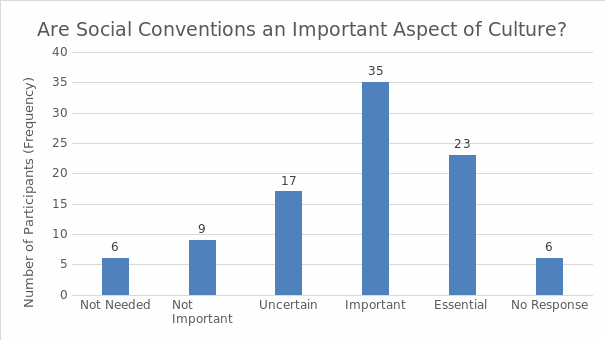
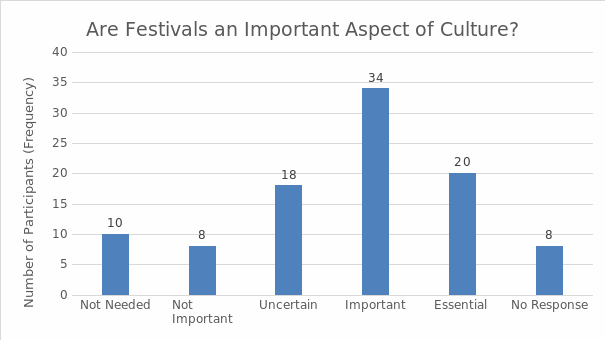
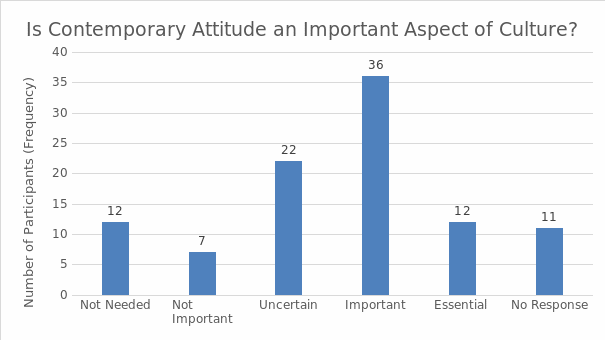
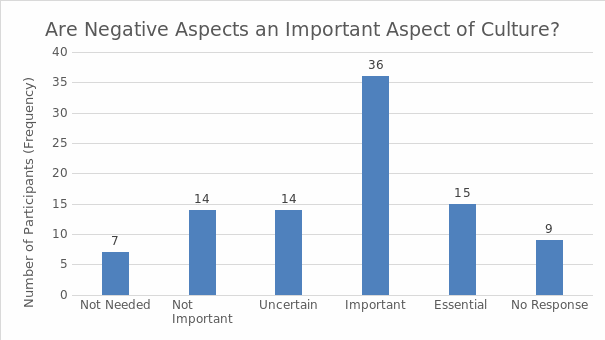
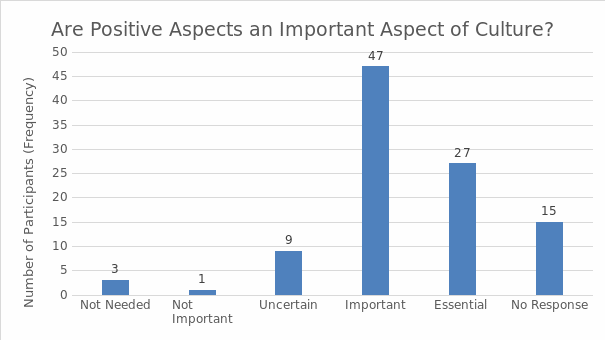
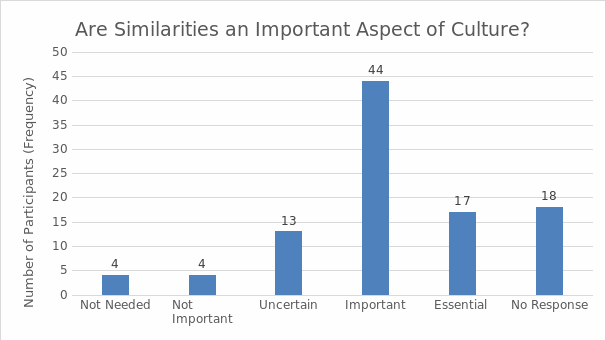
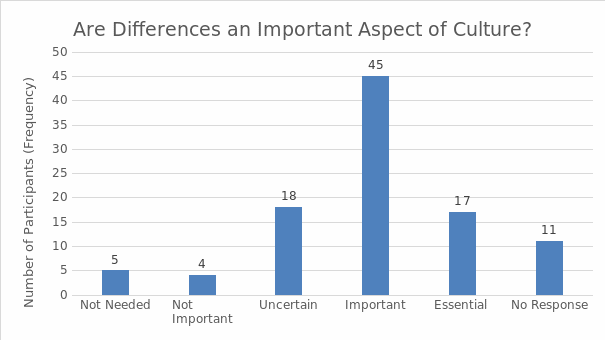
Table 20 and table 21 represent an analysis of the data that was gathered on cultural aspects. Table 20 shows that the only topic which was regarded as not important was political issues. All the other aspects had a mean close to 4, a median of 4, and a mode of 4. This pattern indicates that these topics were regarded as important by all respondents. The graphs below (fig. 20-33) represent the data gathered from respondents in greater detail. Again, they use frequencies to illustrate the responses rather than the average numbers.
Statements about Cultural Education
The questionnaire intended to determine the teacher’s ideas and beliefs about English language and culture teaching. Question 16 presented the participants with multiple statements that can be seen in table 22, table 23, and table 24 below. The question reads: please tick √ the number to the right that most appropriately answers how much you agree with the following statements. The answers (from strongly disagree to strongly agree) were labelled with numbers from 1 to 5, which were used to determine the average of the responses. Also, number 6 was employed to label the missing data. The answers would not be expected to amount to 100 in all situations because of the mistakes that were encountered for some statements (cases in which participants responded to one question twice).
Table 22. Teachers’ Statements.
Table 23. Teachers’ Statements (Continued).
Table 24. Teachers’ Statements (Continued).
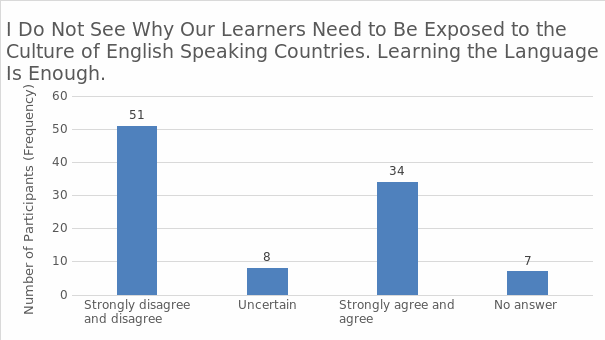
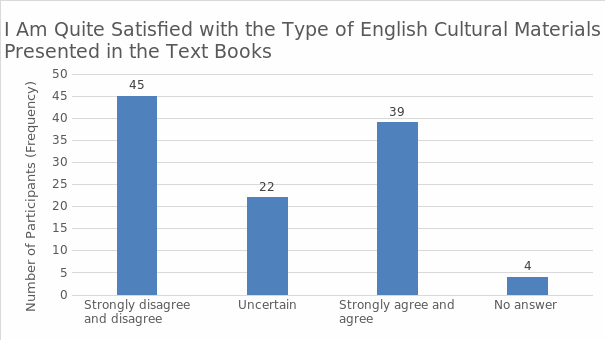
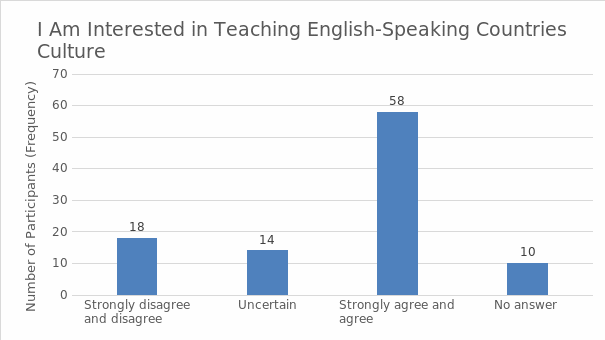
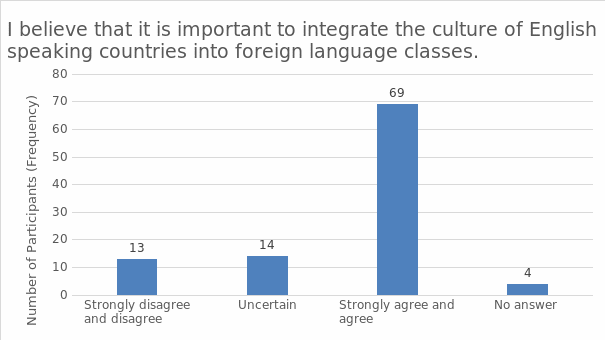
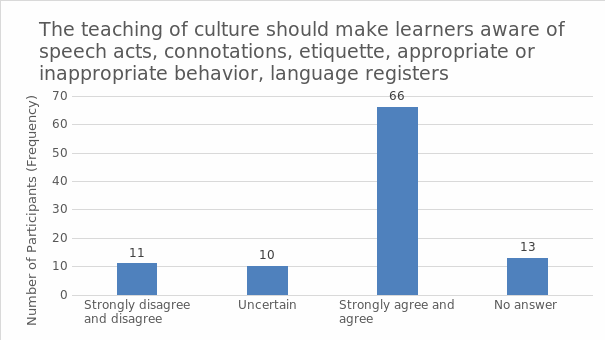
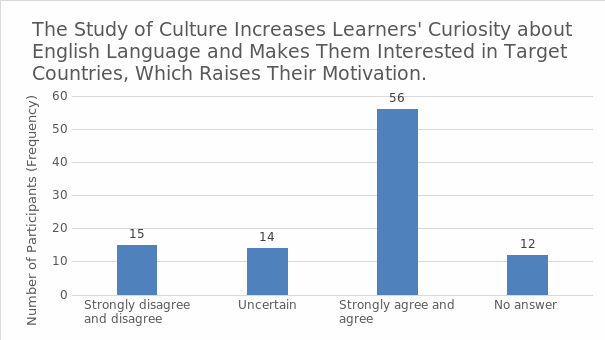
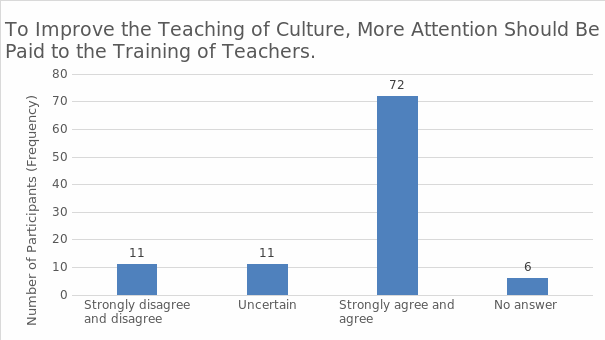
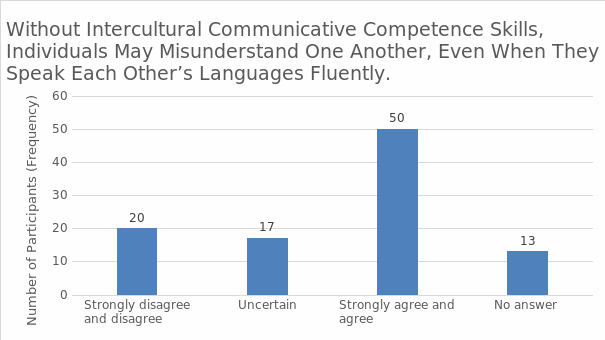
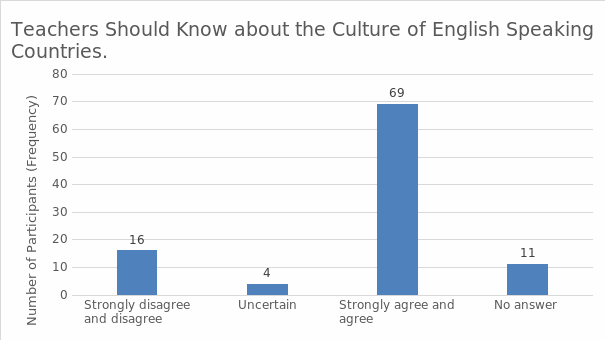
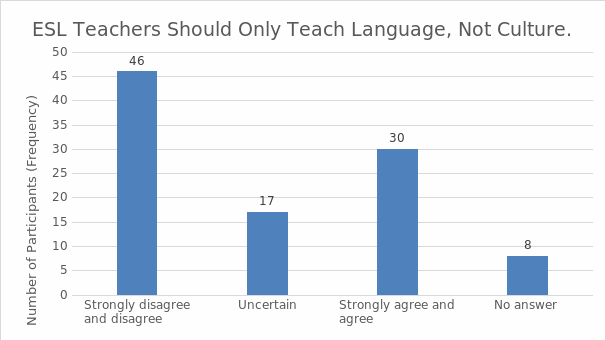
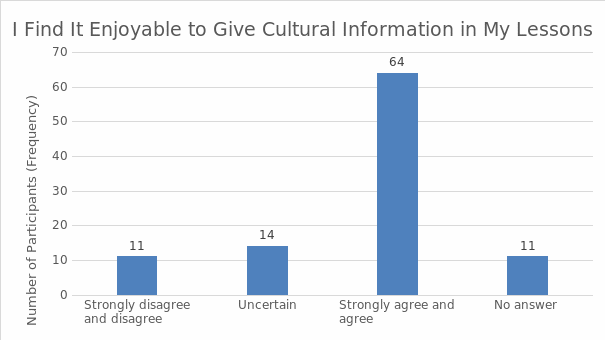
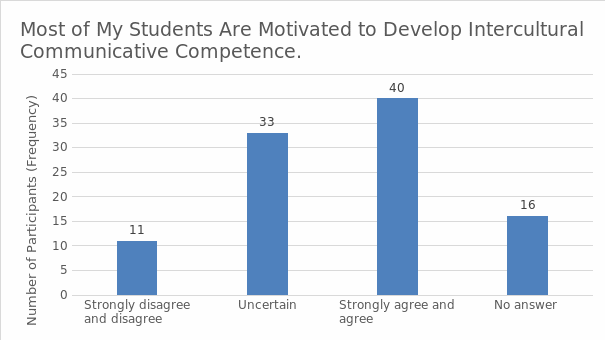
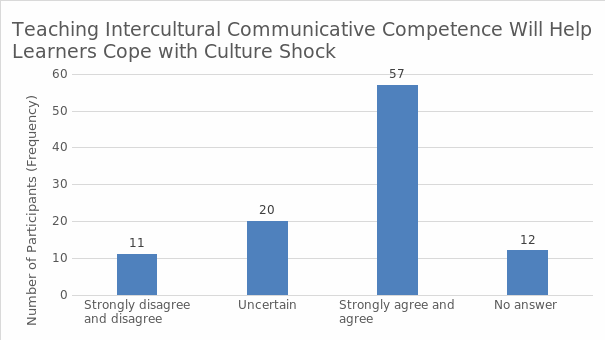
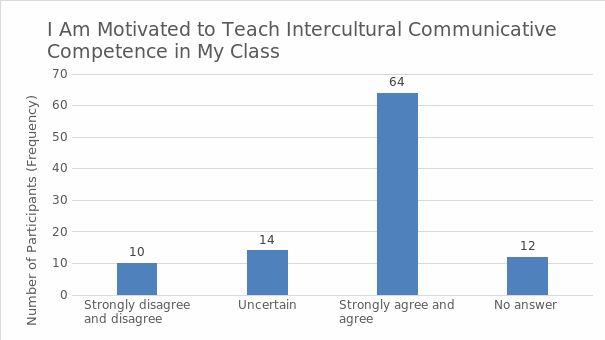
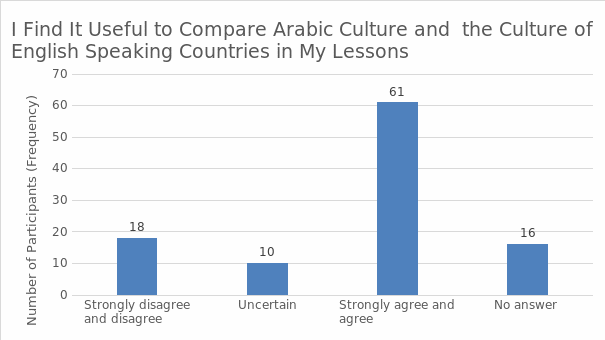
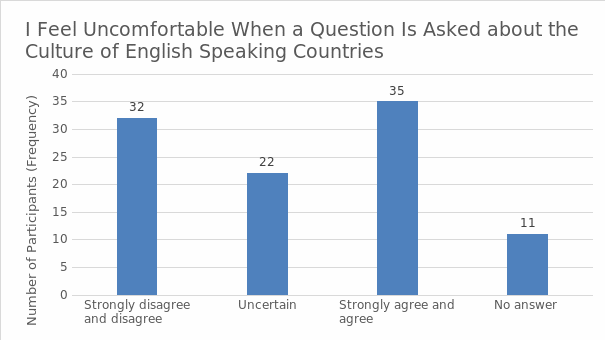
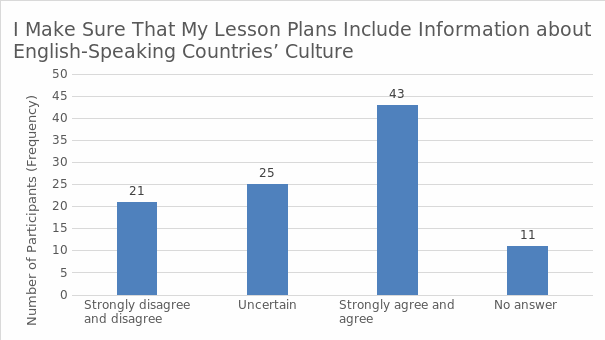
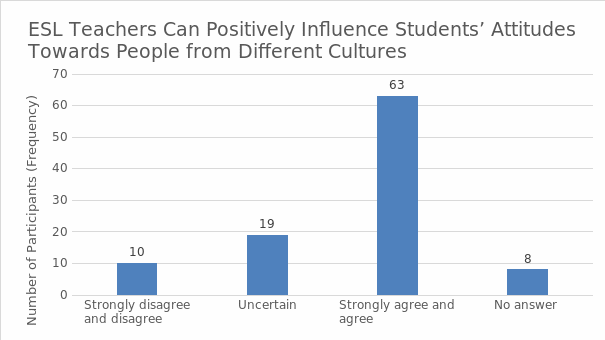
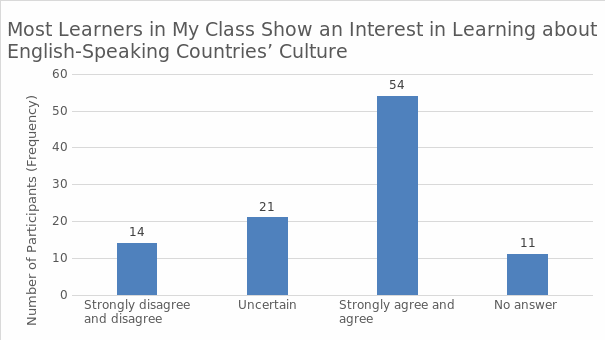
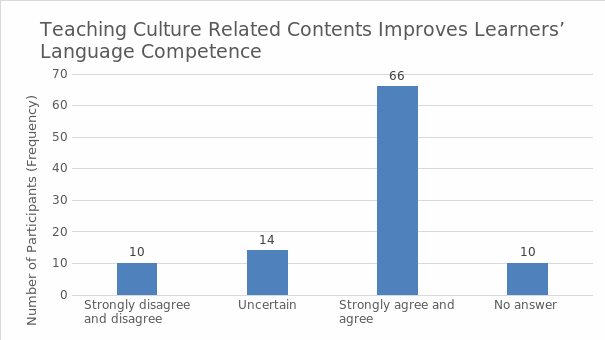
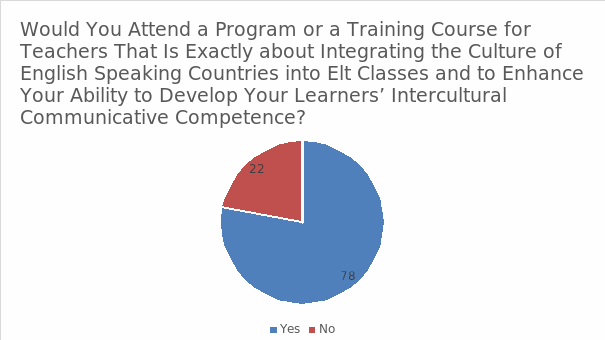
The three tables above represent the responses of the participants on various statements, and the graphs below (fig. 34-54) illustrate them. The scales in the graphs might change in their numbers (showing 0-40, 0-30, and 0-50 frequencies) depending on the maximum frequency of responses within a specific set. With some questions, the respondents showed substantial disagreement. Such statements included the ideas that “learning the language is enough” (fig. 34) and that “ESL teachers should only teach language, not culture” (fig. 43), the attitudes towards textbooks (fig. 35), and the knowledge of cultures (fig. 49). The teachers generally agreed and strongly agreed with all other statements.
Additionally, the teachers seem to be particularly uncertain about the motivation of their students to develop intercultural competence (fig. 45). This tendency might be connected to teachers being reluctant to make direct statements about other people’s perspectives. Also, a number of teachers (25) are not certain that they make sure to include the information about English-speaking countries in their lesson plans (fig. 50). Furthermore, a rather high variety of responses is shown for the following question: “I feel uncomfortable when a question is asked about the culture of English-speaking countries” (fig. 49). A total of 32 respondents disagree or strongly disagree, but 22 are uncertain, and 35 agree or strongly agree. These responses might indicate the need of teachers for more training on the topic or other interventions that would equip them with the necessary knowledge.
Teachers’ Experiences
This is the third section of the survey, which focuses on the experiences of teachers. The responses produced some information about the conferences that the respondents had visited, their traveling, and the integration of culture-related discussions that they managed to perform. The first and second topics can demonstrate the teachers’ competencies and opportunities for development, and the third one is important for the future statistical analysis.
Question 5 considered the teachers’ experiences of traveling. It was phrased as follows: have you ever traveled to a non- English-speaking country where you used English for communication? The pie chart seems to be an appropriate graph for this question because it is better than histograms at comparing the two groups of responses to their total number.
Table 25. Traveling Experiences.
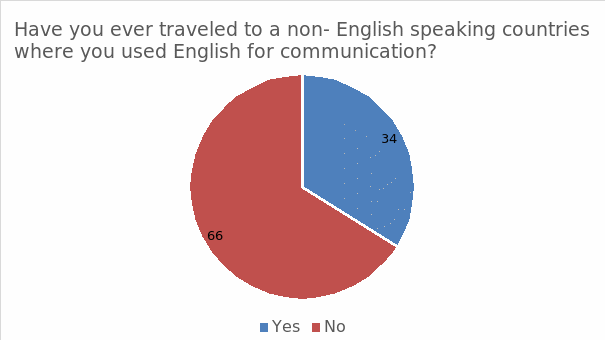
Table 25 and fig. 55 show that most of the respondents (66 of them) did not have a chance to travel to non-English-speaking countries and practice English there. However, some of them did, and they were asked to specify the regions that they had visited.
Table 26. Detailed Traveling Experiences.
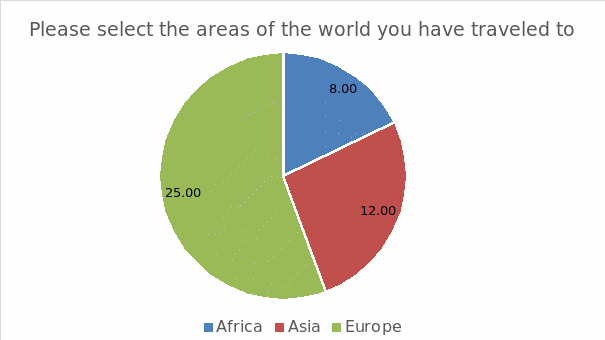
As can be seen from table 26 and fig. 56, some of the participants visited several regions, which is why their total is greater than 34; the percentages were counted with respect to the whole sample (100 people). However, many of the participants (25%) visited European countries, 12% of them traveled to Asian countries, and 8% practiced English while in Africa (see fig.).
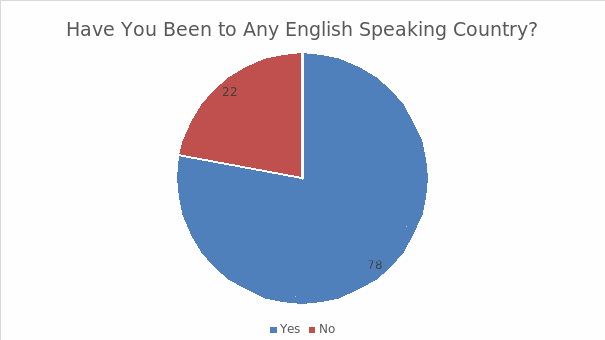
Additionally, the participants were inquired about their experience of visiting English-speaking countries. Only 18% of the respondents confirmed visiting an English-speaking country as shown by table 27 and fig. 57. It appears that the teachers from the sample are more likely to visit non-English-speaking regions.
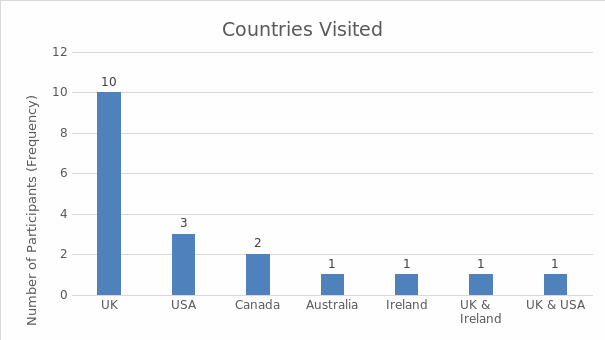
Furthermore, the participants specified the countries that they visited; mostly, they named the UK (10 people). Three more people came to the US, two people traveled to Canada, and Australia and Ireland were visited by one person each. Also, two people visited two countries each; one of them came to the UK and Ireland, and one traveled to the UK and US (see table 28 and fig. 58).
Question 17 was phrased as follows: have you attended any conferences, workshops, symposiums or courses on teaching English-speaking countries culture?
Table 29. Teachers and Conferences: Frequency and Percentages.
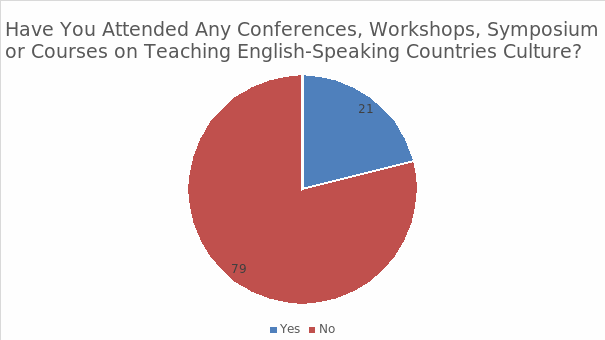
Out of the 100 responses that were obtained for this exploration, 21% indicated that respondents had attended a seminar or a symposium with a focus on improving the extent to which the culture of English-speaking countries was included in the Libyan curriculum (see table 29). The remaining 79% individuals indicated that they had never received an opportunity to attend similar meetings (see fig. 59).
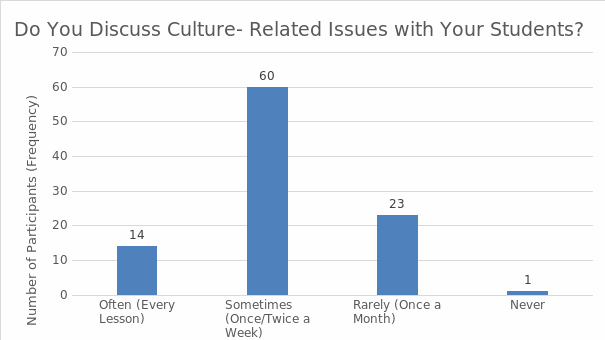
Question 10 also focused on teachers’ experiences and was phrased as follows: do you discuss culture-related issues with your students?
Table 30. Teachers Discussing Culture-Related Issues with Students.
As shown in table 30, 14% of the research participants indicated that they often talk to students about issues related to culture while 60% of them gave an indication that they sometimes include cultural topics in their classroom discussions. On the other hand, 23% of the respondents posited that they rarely include issues related to the culture of the students and that of the people around them in their discussions. Lastly, 1% of the teachers said that they have not attempted to include culturally relevant materials in their lesson plans (see fig. 60).
The Attitude of the Students towards Culture and How it Affects their Learning
The fourth part of the survey analysis is focused on students. While the questions were responded to by teachers, their perceptions of learners’ motivation and attitudes towards the cultural aspects of learning can prove to be important. As a result, the previous question is also of importance to the present section, but it mostly consists of question 9, which was phrased as follows: are your students interested in learning the culture of English speaking countries?
Table 31. Students’ Interest in Learning Cultures.
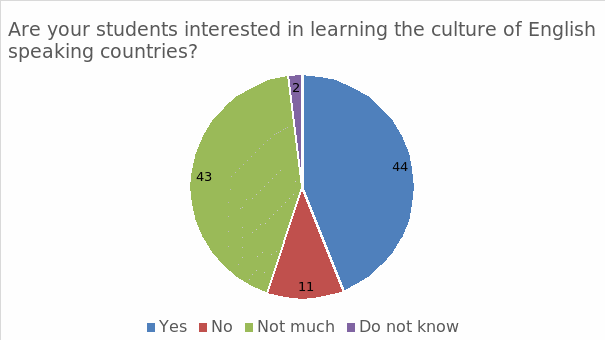
Table 31 and fig. 61 show that 44% of the respondents believe that their learners are interested in learning about cultures, and only 11 of them do not think so. However, 43% of respondents also think that the learners’ interest in various cultures is not great, and 2% of them are not sure about their view. The results of this question, as well as the previous one, were treated like as the independent and dependent variable (see table 30) in order to determine the effects that students’ interest in cultural studies can have on the frequency of discussions related to culture that are initiated by the teachers.
Table 32. Variables of the Analysis.
Table 33. Model Summary.
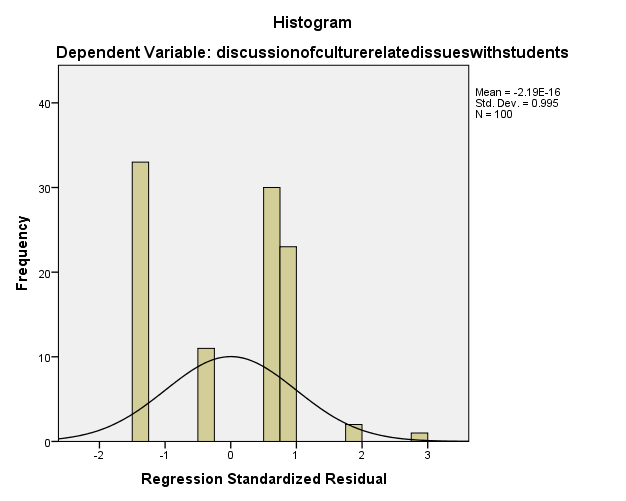
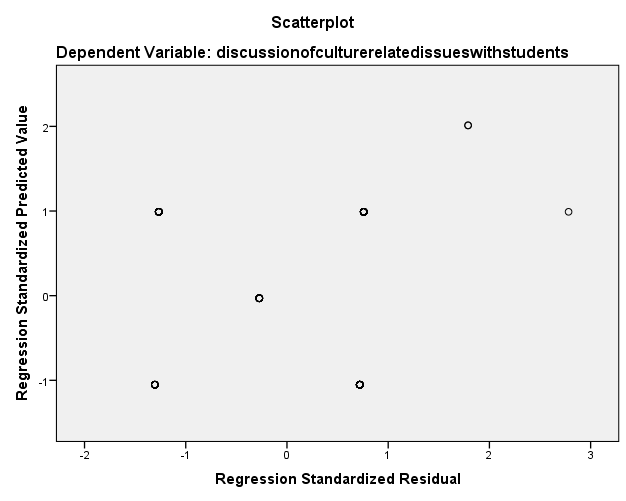
For the task, the analysis of variance or ANOVA was employed. It can be defined as a set of frequently used statistical models that generally target the differences and similarities in the mean values of groups, thus testing their statistical significance (Hanneman et al., 2013, 338-340; Raykov and Marcoulides, 2013, 269). In turn, regression analysis is used to “relate a continuous (quantitative) explanatory variable to a continuous response variable” (Raykov and Marcoulides, 2013, 291).
Table 32 presents the variables of the analysis, and table 33 is the summary of the model, which offers the key information about it as determined by SPSS. From the data provided in the model summary (see table 33), it can be stated that the correlation coefficient of the relationship is 0.699. Furthermore, the results of ANOVA are presented in table 34 with table 35 describing coefficients and table 36 focusing on residual statistics (which are the parameters that are used to check the model) (Raykov and Marcoulides, 2013, 244). The tables include the SPSS data about variables and predictors as well. The analysis is also displayed in fig. 62 and 63; the latter presents a scatterplot of residual statistics to determine their distribution. The results imply that there is a positive relationship between the independent and dependent variable. In other words, there is a positive correlation between the willingness of the learner to learn material which is related to the English culture and the frequency with which their teacher introduces such materials. Thus, it is prudent to conclude that the more willing the learners are, the higher are the chances that the instructor will include materials that are culturally relevant in their lessons as indicated by the analysis.
Table 34. ANOVA Results.
Table 35. Coefficients.
Table 36. Residual Statistics.
Cultural Competence
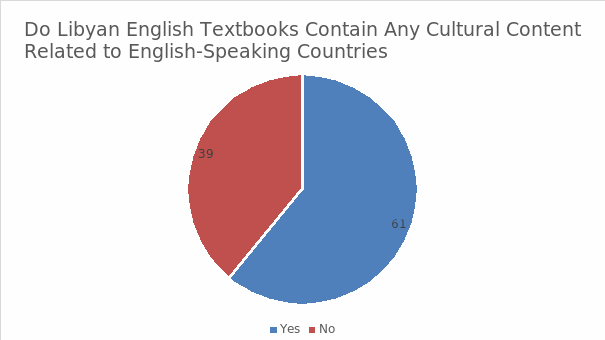
The final part of the survey analysis covers question 6, which has some sub-questions that are aimed at examining the textbooks that are available for the use of the respondents. The question itself was phrased as follows: do Libyan English textbooks contain any cultural content related to English-speaking countries?
Table 37. Cultural Content in English Textbooks.
55% of the respondents said that Libyan textbooks contained materials which addressed their culture and English-speaking ones (see table 37). However, the remaining 35.5% reported the opposite (see fig. 64).
Sections of the Textbooks which Contain Culturally Relevant Material
Question 6 also has an additional prompt aimed to gain more insights into the presence of cultural elements in textbooks. It is phrased as follows: if you answered “yes” what are they?
Table 38. Cultural Content in English Textbooks (Continued).
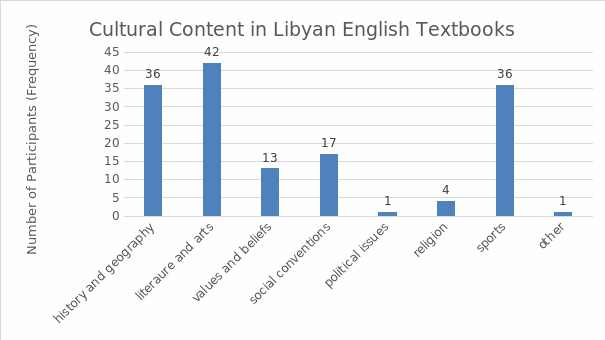
As can be seen from table 38 and fig. 65, 24% pointed to the fact that textbooks contained the materials which covered history and geography. In addition to that, 28% of the responses indicated that textbooks considered literature and arts. Moreover, 8.7% of the feedback suggested that there were textbooks which taught learners about values and beliefs. Notably, 0.7% of the responses indicate that there are textbooks which are dedicated to addressing cultural issues. Additionally, 2.7% of the feedback says that textbooks refer to the matters of religion. Furthermore, 24% of the responses state that textbooks contain some information about sports. Lastly, 0.7% of the feedback indicated that textbooks could include culturally relevant content from other fields.
Summary
The analysis of the survey devoted to the topic of culture in teaching was carried out with the help of statistical software SPSS, which allowed employing descriptive and inferential statistics and producing graphs to illustrate responses. Five key areas were covered, and they included demographics, teachers’ perceptions (ideas and beliefs), teachers’ experiences, students’ attitudes towards the cultural elements of teaching, and cultural competence. The final section focuses on the available textbooks and their content.
The demographics allow demonstrating that the respondents can present an expert opinion on the topic, which implies that their beliefs and experiences, as well as accounts of the available resources, are important to consider. The analysis allows determining that an average teacher tends to value the cultural components of teaching and suggests using specific strategies and tools to ensure their integration into lessons. Furthermore, the statistical analysis has found that the perceived interest of the students in culture affects teachers’ willingness to incorporate cultural elements and relevant discussions into lessons.
Bibliography
Hanneman, Robert A., et al. Basic Statistics for Social Research. John Wiley & Sons, 2013.
Raykov, Tenko, and George A. Marcoulides. Basic Statistics. Rowman & Littlefield, 2013.