Introduction
This paper focuses on investigating the technological use and support in the US retail industry by analyzing the industry’s general overview, its dependence on technology, IT expenditures, etc.
Investigation of the typical technology use and support in the industry:
Typical technologies used that give advantages to the retail industry
Table 1: Technology use and support
Source: Kulkarni (2014)
How technology makes retail businesses work facilitating them
It is hard to imagine a retail business today without the use of technology because it helps businesses to offer customers enhanced service quality, appropriateness, personalization, swiftness, and flexibility (Kulkarni, 2014).
General industry analysis overview:
Financial and other relevant business factors
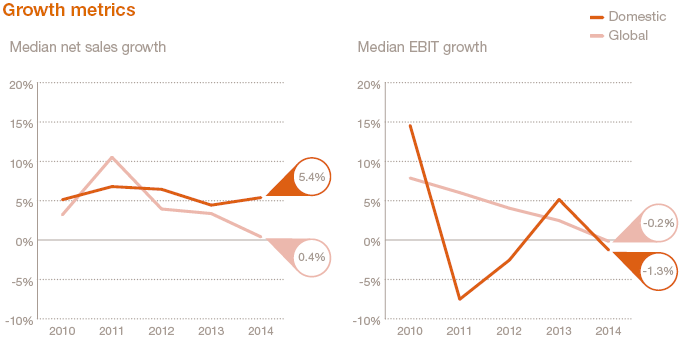
The charts below show the financial performance of the industry; it is notable that the net sales growth in the domestic market is showing an upward trend, but EBIT growth is falling down (PricewaterhouseCoopers, 2015):
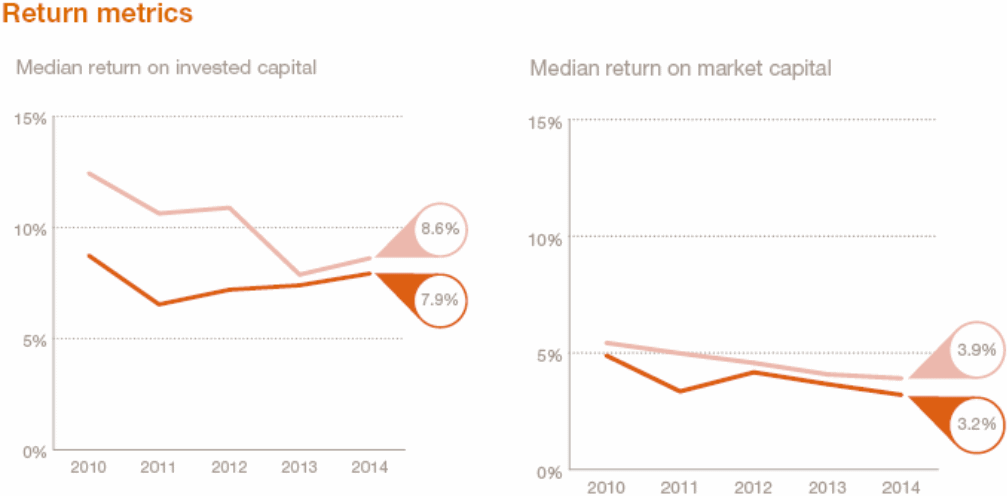
Return on sales remained quite stable until last year, but the gross margin has dropped on the domestic market; moreover, since 2013, return on invested capital is recovering, whilst return on market capital is dropping:
Competitive environment
The US retail industry confronts great competition, and the bargaining power of customers is huge because a large number of companies like Wal-Mart, Big Lots, Burlington Stores, Dillard’s, Cencosud, Costco, etc. persistently contest for market share.
The size of the retail industry
According to Farfan (2015), the size of the US retail industry has been boosted by four and a half percent from 1993 to 2015; however, such a conclusion has been drawn by considering the units of retail sales per month:
Table 2: Size of retail sales. Source: Farfan (2015).
Sales trends, seasonality, economic sensitivity
The sales trends of the retail industry from 2000 to 2014 demonstrate that gradually the amount of sales is increasing (Statista, 2015):
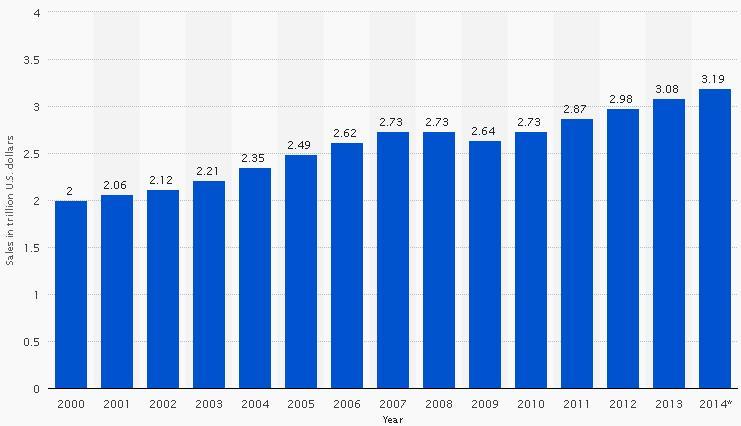
According to Hoovers (2015), the sales trends vary throughout the year, depending on different seasons to encourage customers to purchase all the time and especially in spring, summer, and winter. The industry is very much inclined to economic sensitivity; therefore, it depends on the economic conditions, with issues like employment trends, interest rates, taxation fluctuations, etc. determining its fate (Statista, 2015).
The sub-industries/ segments
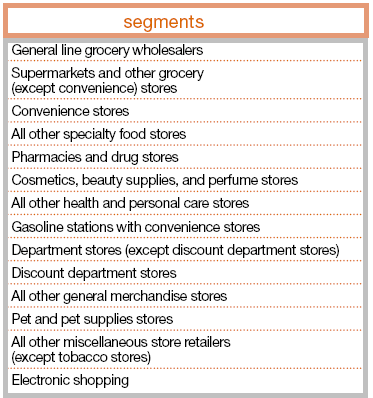
Food, beverage, and household products are some essential segments of the retail industry; however, retail businesses can be broadly classified into the following segments:
The roles in the market
Retail industry in the US has major roles to play in the market – it has great influence in lowering unemployment rates in the job market; for example, Bureau of Labor Statistics (2015) suggested that employments continued to rise in 2015:
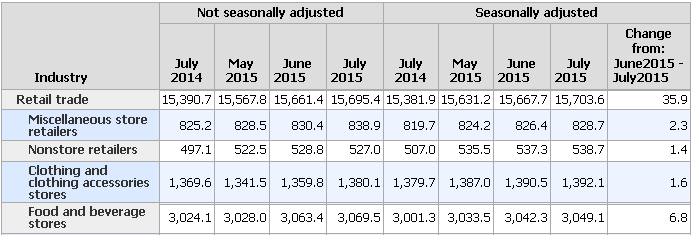
Source: Bureau of Labor Statistics (2015).
The leaders and their market shares
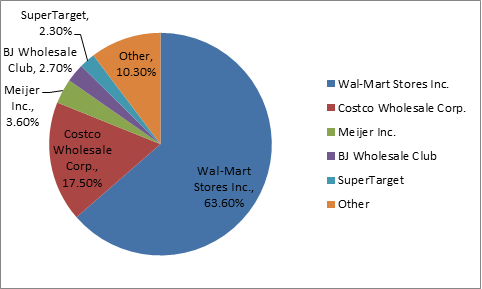
Catala (2012) stated that Wal-Mart is the market leader in the industry, whereas Costco, Meijer, and BJ Wholesale are also leading retailers in the US market; the pie chart below shows their relevant market shares:
Industry Environment
The primary customers
The retail industry fundamentally consists of companies that offer “Business to Consumer” services, and the principal customer bases are the common individuals.
Key suppliers
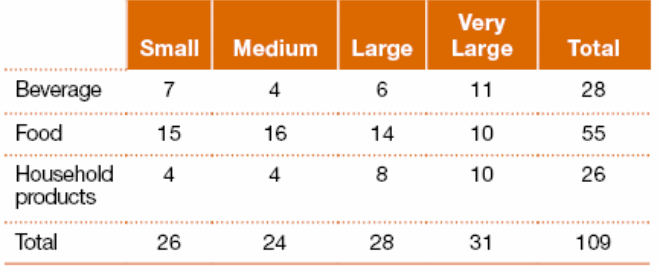
Suppliers tend to have low bargaining power in this industry; however, the foremost suppliers are the wholesalers of food, drinks, and domestic items:
The market stability
The retail industry is very susceptible to market conditions; therefore, PricewaterhouseCoopers (2015) noted that in 2014, the economic atmosphere further recovered from the recession and gained stable growth, which was advantageous for the industry.
Key issues and regulatory concerns and affects on technology
The retail industry constantly faces many regulatory concerns, which adversely affect its use of technology; for example, retailers use data storage software that raises customers’ data security and privacy concerns; moreover, if they build custom software for commercial use, licensing issues arise.
Financial Aspects
Average annual expenditures in the industry for IT
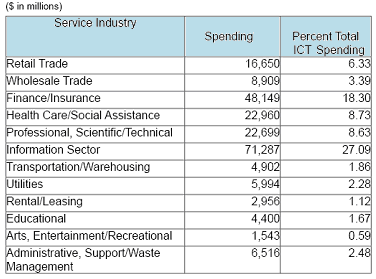
The table below demonstrates the IT expenditure of the retail trade industry in comparison to other industries:
Expenditures as a percentage of revenues
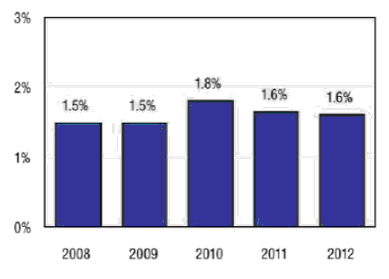
The IT expenditure of the retail industry slightly rose as a percentage of revenues in recent years:
Applications and technologies
It is notable that mobility-trade, such as WiFi, mobile applications, and social media, are highly familiar applications; however, smarter technologies are used in inventory-management, online payment, e-commerce sites, etc.
Commonly deployed systems
Email, SMS, social media (such as Facebook, Twitter, Skype) are the most commonly deployed systems; conversely, most retailers now own corporate websites, hybrid clouds, etc.
Industry-specific applications and technologies
Industry-specific technologies are those, which are used in inventory management, promotional tools, and supply chain; however, many companies are inventing customized technologies.
Leading developers of applications
Presently, Wal-Mart is the pioneering developer in the US retail industry to invent industry-specific applications with the help of in-house IT specialists; however, Costco is also trying to adopt the latest user-friendly applications.
Standards
Use of standards in the industry, standard bodies, and working groups
It is noteworthy that GS1 oversees buyers’ goods with Universal Product Code, which is a ubiquitous-barcode; moreover, ANSI ASC X12 is also responsible for constructing and improving the benchmarks of the retail trade; whereas eCOM includes a group of benchmarks, which keeps the supply chain in thorough check. On the other hand, GSMP (another forum) clarifies and manages the GS1 benchmarks, whilst EPCglobal offers supplementary data, which helps exclusive recognition and tracking of products easier; in addition, GDSN facilitates safe and incessant data-harmonization of manufactured goods. It must be noted that GCI, an international user-group, includes the largest transnational producers and retailers that help to maintain the industry standards; on the other hand, VICS checks and enhances the competence and efficacy of the distribution system of the industry.
Trends and innovation
The trends of technology usage in the retail industry have been discussed earlier; however, here, it must be stated that the largest US retailers are now endowing significant amounts of funds in research and development for innovation.
Recent innovations and game-changers
It is important to state that, according to Kulkarni (2014), ‘omnichannel buyer experience’ is one of the foremost disruptive-technologies used amongst the retail competitors, making trade between various channels easier; moreover, it also allows better orchestration throughout the industry and its tiny segments.
The hotspots
There are numerous hotspots in the retail industry, for example, slow growth of the market, strict laws and conventions, incapability to manage expenses, lack of ability to profit from e-commerce, disorders of distribution channel, failure to pierce the promising markets, and continuously changing buyer behavior.
Conclusion
Irrespective of the various troubles and challenges, the retail industry is gradually becoming increasingly dependent on the use of technology. This is not only benefiting the companies by giving greater efficacy and flexibility at lowers costs but also assisting customers in enjoying their buying experience.
Reference List
Bureau of Labor Statistics. (2015). Table B-1 Employees on nonfarm payrolls by industry sector and selected industry detail. Web.
Catala, R. (2012). Wal-Mart Market Share Analysis. Web.
Farfan, B. (2015). US Retail Industry Overview 2015 – Info, Facts, Research, Data, Trivia. Web.
Hoovers. (2015). Seasonal Trends of the Retail Industry. Web.
Kulkarni, G. (2014). Ten game changing technology trends revolutionizing retail. Web.
Platt Retail Institute. (2012). Retailers’ Investment in Technology: An Industry Perspective. Web.
PricewaterhouseCoopers. (2015). Retail & Consumer Insights 2015 Financial Benchmarking. Web.
Statista. (2015). Annual retail industry sales in the United States from 2000 to 2014 (in trillion U.S. dollars). Web.