Thai Airways is a public transportation company that provides airline courier services throughout the Thailand Kingdom. It provides a range of services, including domestic and regional flights, as well as intercontinental flights to African, European, and Western countries. The headquarters of the company, as well as one of the major airports is situated in Bangkok, from which it provides flights to all the major points of the country and around the world. Thai Airways was founded in 1960, and since then has undergone several major changes to be up to date with the contemporary standards and provide the required level of service to the customers. One of the most prominent turning points was the formation of a joint venture with the Scandinavian Airlines System (SAS).
This allowed Thai Airways to expand its area of influence by utilizing the additional resource base of the partner, as well as a managerial insight unavailable to TAC otherwise. The expertise of the staff was improved as well, resulting from the training exercises and assistance of more experienced pilots. Since the joint venture, Thai Airways has reached a new technical and economic level and continues to experience financial growth. Currently, the company is pursuing its long-term goal of becoming an independent national airline (Company Profile 2015).
This report aims at assessing the productivity and performance of the TAC in a time period of 2011 through 2014. To achieve a comprehensive result, it utilizes four parameters that are widely used to estimate the profitability of the airline companies: CASK (cost per available seat kilometer), RASK (revenue per available seat kilometer), fuel cost per ASK, and revenue per employee (Swan & Adler 2006). As the company is not known to undertake any radical moves or implement any major changes, the initial assumption is the stable performance characterized by little or no difference in any given parameter (Hong & Zhang 2010).
Cost per Available Seat Kilometer
Cost per available seat kilometer = Operating expenses/Available Seat Kilometer

The available seat kilometer is a parameter that describes the total number of seats available in an aircraft flown over a distance of one kilometer. The parameter is counted per seat. It is calculated by multiplying the number of seats available in a certain plane at any given time and distance covered by the plane in kilometers. The CASK can be perceived as a SI unit of seats. In other words, it approximates the carrying capacity by mathematically estimating the cost of every kilometer covered by each seat.
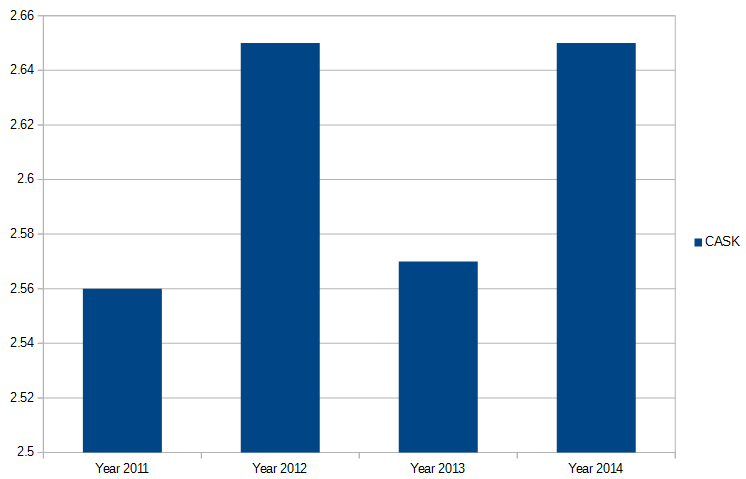
This parameter is useful for determining the losses as well as revenues of the airline more precisely. As such, dividing the company’s expenses by the ASK, we can estimate the likelihood of the company’s profitability. By looking at the bar diagram above, we can see that throughout the designated time period, the CASK was largely within the same range, with the biggest deviation of 0.09 million between 2011 and 2012. Additionally, no tendency of either growth or decline is observed.
Revenue per Available Seat Kilometer
Revenue per available seat kilometer = Total Revenue/Available Seat Kilometer

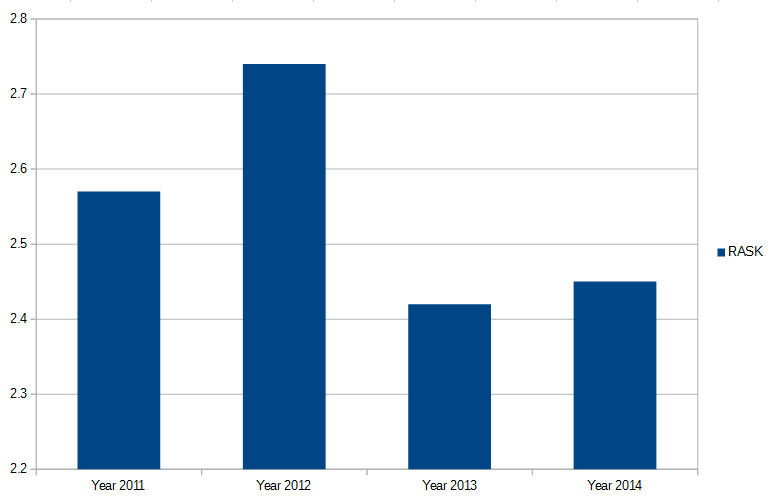
In the same vein as CASK, this parameter is used to assess the efficiency of the company. However, unlike the former, it estimates the revenue of each seat in a given plane, displaying the average profitability of the smallest unit of the airline. Consequently, the higher the number of the RASK, the more likely the fact that the company is making profit. In this bar diagram, the situation is different.
There is a noticeable peak in 2012, at 2.74 million compared to 2.57 the previous year and 2.42 in 2013. This implies that 2012 is the most profitable year for Thai Airways by a formidable margin. However, if we take a look at the CASK, there is no correlation: 2012 exhibits higher rate than that of the neighboring years, while the profitable scenario would result in the lower values. Thus, the data is insufficient for a conclusive correlation
Fuel Cost per Available Seat Kilometer
Fuel cost per available seat kilometer = Total Fuel Cost/Available Seat Kilometer

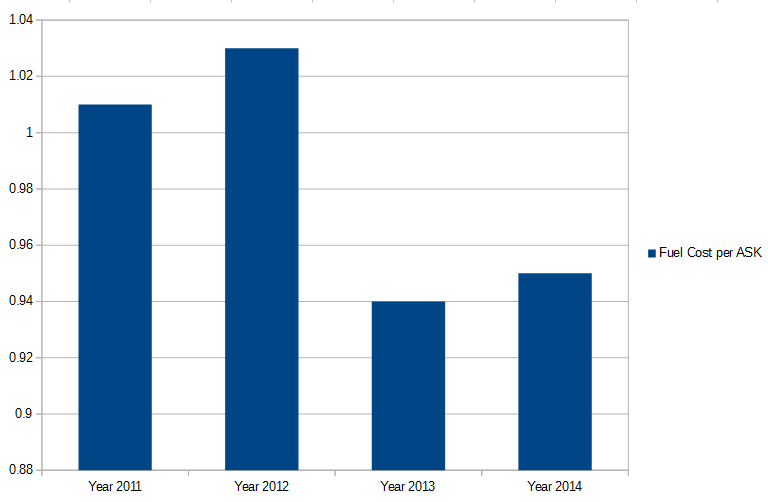
By calculating the fuel cost per ASK, the overall cost of the fuel per seat can be determined. In other words, this also is a SI unit of seats but is used to estimate the loss of profit from fuel expenses. The higher the loss, the less profit is expected from the company. In the bar diagram above, the first two years exhibit an estimated 5% additional loss in comparison to the latter two, with the small difference in-between in both cases, which can be ignored. This diagram allows us to conclude that the 2011 and 2012 were a little less profitable than the subsequent years, as the expenses connected to fuel were higher.
Revenue per Employee
Revenue per employee = Total Revenue/Total Number of employees (personnel)

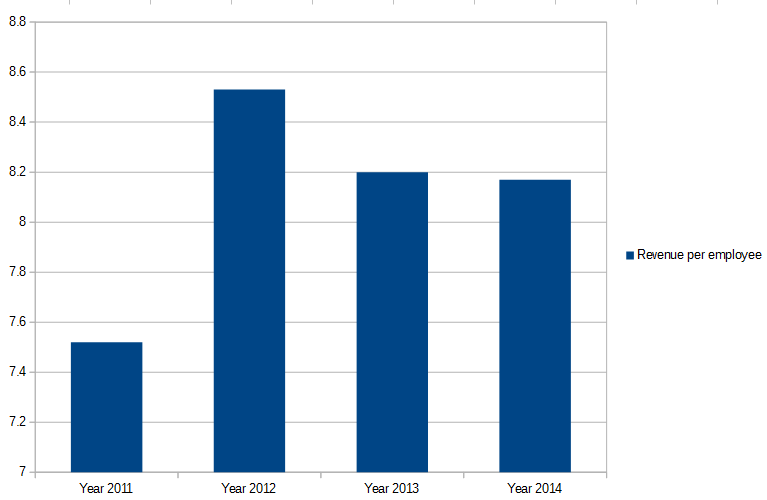
This final parameter allows us to estimate the income of every employee of the company by dividing the total revenue. Higher revenue means better income for each employee, and, as a result, better performance and satisfaction of the staff. Thus, the higher number can be correlated to the profitability of the company. By looking at the diagram, we immediately notice the huge difference between years 2011 and 2012 (about 12 percent). The difference is less noticeable between later years, but the decline is still visible, which directly points to the fact that 2012 was the most successful year for Thai Airways by wide margin. It is also important to note that these results are consistent with the RASK diagram, both in the dynamics and in the deviation between neighboring years.
Conclusion
Thai Airways is one of the leading companies in the Asian airline industry. Since its joint venture with the Scandinavian Airline Systems, it has experienced rapid growth. In the last decade, the company has not experienced any groundbreaking milestones, so the revenue, as well as all the parameters related to it, are expected to show little deviation. By reviewing the annual reports, and calculating CASK, RASK, fuel cost per ASK, and revenue per employee, the following conclusions can be drawn: the profitability of the company has been mostly unchanged throughout four recent years.
The RASK and Revenue per employee parameters both point to the peaked profits in 2012 and declining the next year. However, the difference is insufficient and, more importantly, is not supported by the CASK analysis. Fuel cost, another important parameter, shows weak correlation with CASK (pointing to 2012 as the least profitable year) and no correlation with the other two parameters. Thus, we can safely conclude that the analysis shows the stability in performance consistent with the expectations from the company such as Thai Airways, while all the deviations are within the expected norm.
Reference List
Company Profile 2015.
Hong, S & Zhang, A 2010, ‘An efficiency study of airlines and air cargo/passenger divisions: a DEA approach’, World Review of Intermodal Transportation Research, vol. 3, no. 1, pp. 137-149.
Swan, W & Adler, N 2006, ‘Aircraft trip cost parameters: A function of stage length and seat capacity’, Transportation Research, vol. 42, no. 2, pp. 105-115.