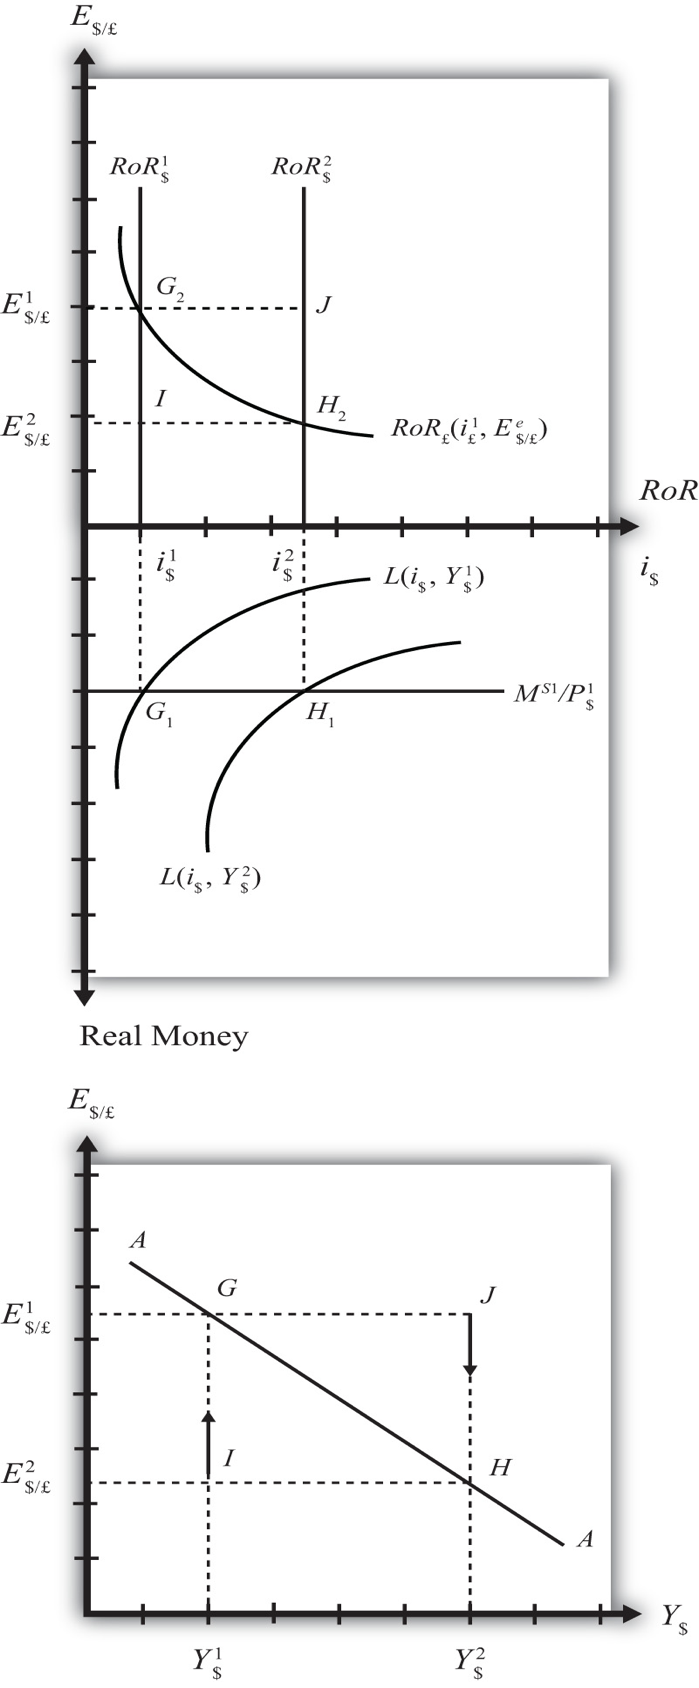
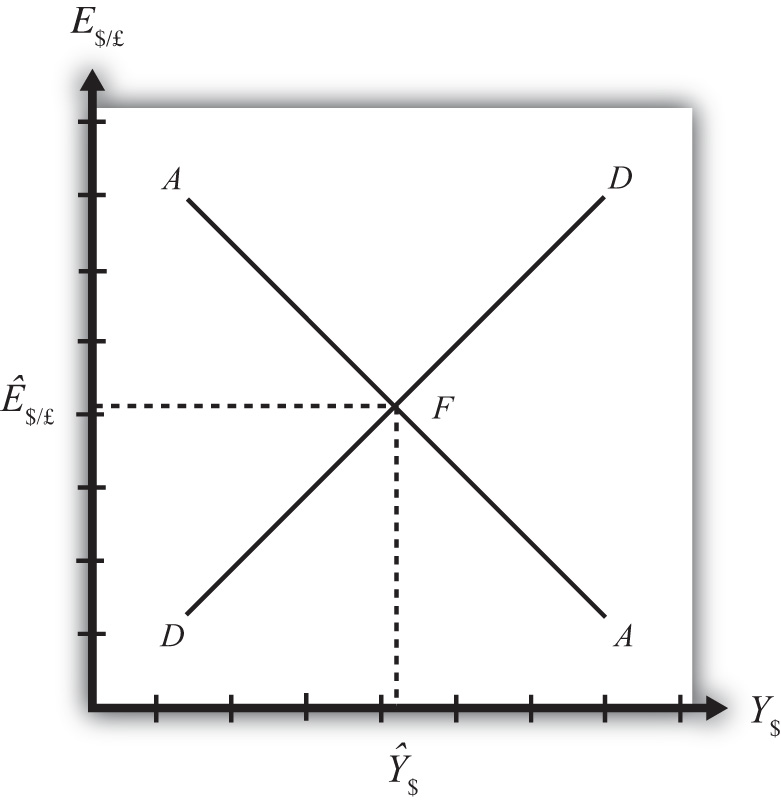
The AA-DD model consists of the G&S model, the money model, and the forex model. The AA-DD diagram consists of two lines. The first line (AA line) denotes the asset equilibriums generated from the Forex and money markets. The second line (DD curve) represents equilibrium in the G&S market. The market equilibrium is attained when the two lines/curves intersect. At this point, the three markets are deemed to be in super-equilibrium.
The DD curve represents an amalgamation of the GNP and exchange rates that sustain equilibrium in the G&S market. The AA line moves up when the anticipated exchange rate, the foreign interest rate, or the money supply rises. Thus, economists use the AA-DD model to comprehend how adjustments in the macroeconomic policy can influence economic variables. The DD line depicts the equilibrium level of the gross national product for each exchange rate that may exist.
The DD line has a positive gradient because when the exchange rate rises, the equilibrium GNP in the goods and services model also increases. The DD line represents the correlation between endogenous variables (i.e., GNP) and exogenous variables (i.e., Exchange rate) in the G&S market model. Any adjustments in other exogenous variables will cause the DD curve to shift. For example, the DD curve will shift to the right/left if the demand for investments increases/decreases.
Economists usually derive the AA curve by transferring data from the Forex model and the money model onto another diagram. This is done to demonstrate the correlation between the equilibrium GDP and the exchange rate. The Forex market (see fig. 1, upper quadrant) depicts the British foreign assets (RoR£) and the RoR on domestic US assets (RoR$). The lower part (see figure 1) reveals the real demand for money {L (i$, Y$) and the money supply (M$S/P$). The AA curve has a negative gradient because a rise in the real gross national product will reduce the exchange rate equilibrium in the Forex and money market models.
The DD curve shows different equilibrium levels in the G&S market. On the other hand, the AA curve shows different equilibrium levels in the asset market. The AA curve reveals an equilibrium exchange rate for each level of the gross national product that exists. The exchange rate will increase/decrease until the economy attains equilibrium on the curve. Given that the asset market and the goods and services market are functioning simultaneously, equilibriums in the two markets will take place when the AA and the DD lines intersect (see figure 2). The Forex market, the money market, and the goods and services market are in super-equilibrium at point F (figure 2).
The AA-DD diagram depicts what happens when the exchange rate is adjusted. An iso-CAB curve (sketched on the AA-DD diagram) refers to a cluster of points that share a line with the current account balance. What is more, economists use the iso-CAB to evaluate adjustments in the current account balance (CAB) when the independent variable changes. An exception is nonetheless made regarding adjustments in the TR, T, P£, and P$. These variables are excluded from the iso-CAB curve because they are part of the current account demand (CAD) line. For example, a rise in tax (T) would cause all iso-CAB curves to move.
Consequently, it will be extremely hard to point out the net effect on the CAB. Nevertheless, ISO-CAB can be used to assess fiscal policy and monetary policy adjustments. Thus, when the super-equilibrium moves above the initial iso-CAB curve, the economy will shift to a new curve. Since the current account is equal to X-M, it follows that the CA will assume positive or negative balances. This means that if the current account balance were initially in excess, a rise in the current account balance would raise the CA surplus. Nonetheless, if the current account balance were initially in deficit, then a rise in CAB would decrease the deficit. Also, the current account balance would shift from the deficit to surplus if the CAB increment was enormous.

