Introduction
Thermodynamic functions explain the behavior of a system in terms of pressure, temperature, density, and other thermodynamic parameters. One of the main concepts in this area is the ideal gas law, assuming negligibly small sizes of the particles themselves, leading to the absence of collisions between them: PV = nRT. Dividing both parts of the equation by a constant volume V under conditions of a closed container of gas allows us to determine the dependence of pressure on temperature, where nR/V is the proportionality coefficient. As it follows from the formula, the pressure should increase linearly with increasing temperature; the opposite is also true. At a certain point, this line intersects the horizontal temperature axis, and at that point the pressure is zero. The temperature value at this point is negative on the Celsius scale, and the difference with absolute zero determines the difference between the Celsius scale and the Kelvin scale. In this laboratory work, a similar relationship is studied to determine the difference between the temperature scales and to compare this value to the reference value.
Data
In the laboratory work, both temperature (Celsius) and pressure (kPa) values were measured for four aqueous media of different temperatures. The measurements were performed instrumentally, which allowed for a reduction of measurement bias. Table 1 shows the measured temperature and pressure values for each of the water baths; at the same time, Table 1 shows the temperature values (Kelvin) that were obtained by converting Celsius to Kelvin by adding 273.15.
Table 1. Results of measurements and conversion of temperature to Kelvin scale.
Calculations
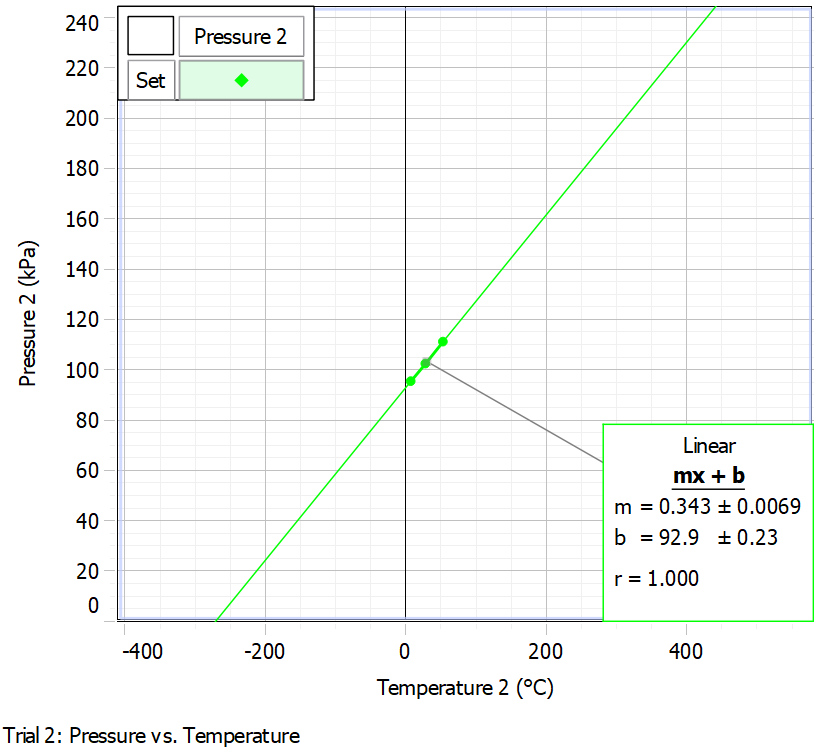
As primarily seen in Table 1, an increase in the temperature of the water in the bath resulted in an increase in the pressure in the closed vessel, which means that the increase in temperature affected the increase in pressure. Figure 1 shows the relationship of these variables with the regression line plotted. It can be seen that the upward linear trend is confirmed, which makes it reasonable to evaluate the meaning of the slope and the y-intercept. The y-intercept, 92.9 ± 0.23 (kPa), determines the water pressure when the temperature is zero. The slope, 0.343 ± 0.0069 kPa °C-1, shows that the pressure rises by 0.343 kPa for every one degree Celsius increase in temperature. The uncertainties of temperature and pressure were measured automatically, and the uncertainties of the slope and y-intercept were also calculated in the computer program.

Analysis
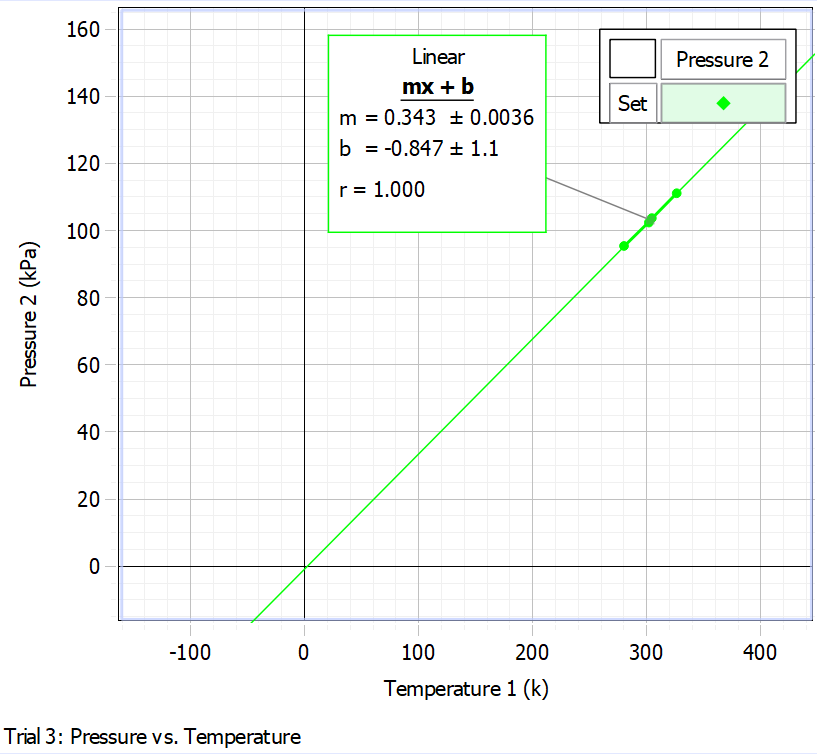
It is noteworthy that the regression equation can be solved with respect to temperature in the case of zero pressure. This solution gives a temperature value of -270.85 ± 5.45 °C — from this, it follows that this is the point at which the pressure was zero for the data, according to the regression model. Meanwhile, the same value corresponded to the fact that the difference between the Kelvin and Celsius temperature scales was -270.85. In reality, the true value of the absolute zero temperature is -273.15, which is slightly less than the calculated value. This is also confirmed by the graph of pressure versus temperature measured in Kelvin: ideally, a straight line should pass through the origin of coordinates. However, as shown in Fig. 2, the regression line, although close to this, does not cross the origin.
The percentage error for the value found was 0.84%, indicating an extremely high calculation accuracy. An error of less than one percent could be due to both instrument errors and measurement uncertainties.

Conclusion
In conclusion, it is worth noting that the experiment used allows us to calculate the temperature for zero pressure using a regression model. The accuracy of such a model was shown to be extremely high, as the final answer differed from the reference value by only 0.84%. Thus, the absolute zero temperature in Celsius was determined to be -270.85 ± 5.45 °C, taking into account the uncertainty calculated from the uncertainties of the slope and y-intercept. The whole work shows the successful possibility of measuring this temperature, so the experiment can be called effective.