Experimental Objective
The objective of performing this experiment was to investigate the directions of motion of both open and crossed belt-drive pulleys. As such, a correlation between the drive and the driven shaft in terms of speed was ascertained to establish whether it matches a theoretical explanation.
Theoretical Background
When focusing on the efficient means of transmitting power between shafts one can hardly overlook gears and chains. However, when it comes to cost-efficient means to the same the belts triumph. To date, with efficiency enhancements made on the belts, they are slowly becoming cheap alternatives to gears and chains. Belts are known for their smooth and quiet runs as well as their abilities to mitigate the effects of load variations on bearings and motors. Moreover, their advantage specifically over gears is that they are economical especially when shafts are wide apart. Nevertheless, one of its many demerits stems from the fact that the ratios between the diameters and that between the angular velocities of the pulleys are not necessarily constant. This is owed to the fact that they are prone to stretch and slips which are significant in determining power transmissions.
When it comes to classification, belts can be categorized into four classes including V-belts, flat belts, timing belts, and film belts. All of these are uniquely designed to suit different applications. For instance; timing belts have thread-like patterns on their inner surfaces to provide for ‘no-slip,’ and as such, they are widely applicable where sync is needed as is in locomotives’ timing belt. On the other hand, flat belts are common where speed rather than power is necessary and, where shafts are wide apart (Flather, 1995).
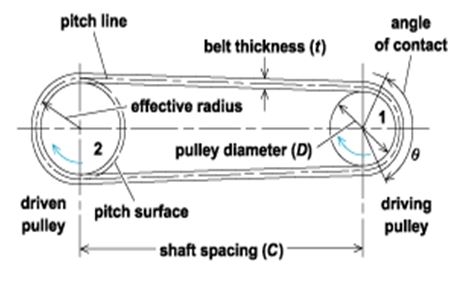
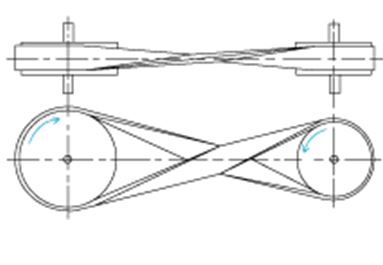
The scope of this report is limited to the belt-pulley arrangements as well as a correlation between the speed and diameters. As such, there exist two arrangement systems including open and crossed belt pulley arrangements (Fig. 1). The difference? In an open pulley, the direction of motion of shafts is the same while the opposite is true for crossed belt pulley. As regards speed and diameter, the relationship is believed to assume an inverse trend.


Basically, the power transmitted to the driven pulley at a distance D from the driving pulley is given by the product of the toque (ᴦ) and the angular velocity (ώ). However, this varies depending on the speed ratio, the distance D, pulley belt arrangement, driving unit loads, and service environment.
Experimental Procedures
For this experiment, a belt drive unit was mounted on a vertically mounted mounting panel. The belt drive unit was such that it consisted of two pairs of pulleys mounted on two spindles. As such, the pulleys provided two systems to maneuver for different arrangements. One pair consisted of pulleys with equal diameters (60 mm) while the other pair consisted of pulleys with different diameters: a large one (> 60 mm) with a diameter of 95 mm and a smaller one (< 60 mm) having a diameter of 31.7 mm.
The first test represented an open pulley arrangement but drove a smaller pulley (31.7 mm). With 60 mm pulleys representing the driving pulley, and with the help of a pencil marker, an exact number of turns but in clockwise direction were made. This was then repeated in an anticlockwise direction. The number of turns made by the smaller pulley was recorded for analysis. The same test was performed for the larger pulley, and a similar procedure was duplicated for crossed pulley arrangement. To this end, the smaller and the larger pulleys acted as the driving pulley. Significantly, the directions of motion of the driven pulleys were noted. Also, the belt thickness (1mm) and the slip between the pulleys and the belts were provided (2% for each), and for the sake of analysis, the experiment was done for several diameter pulleys.
For this experiment, the data obtained need to coincide with the theoretical explanation provided in the literature. As such, with regards to direction, it is expected that for an open pulley arrangement the directions of both the driven and the driving pulley move in tandem. Reversing the direction of the driving pulley also reverses the direction of the driven pulley (table 1). However, for the crossed pulley the reverse is true.

As regards a correlation between the speed and the diameter in both arrangements an inverse trend is anticipated. As such, factoring in slips the below data is expected:
Table 2: Showing the change in diameter vs. the revolution per sec. of the driven pulley (open pulley system arrangement) when the driving pulley is rotated at a constant speed of 3 rev/10 sec.
Table 3: Showing the change in diameter vs. the revolution per sec. of the driven pulley when rotated at a speed of 3 rev/10sec. (crossed pulley system arrangement).
Data Analysis
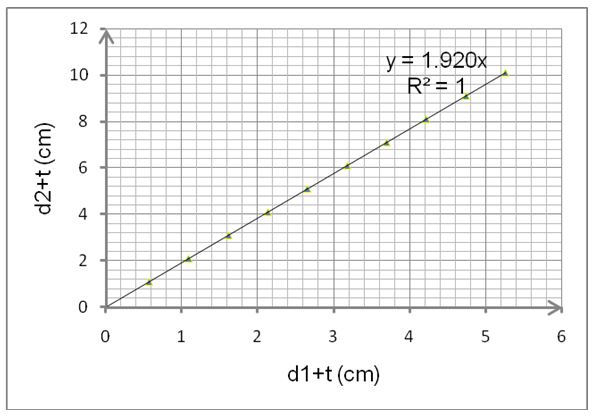
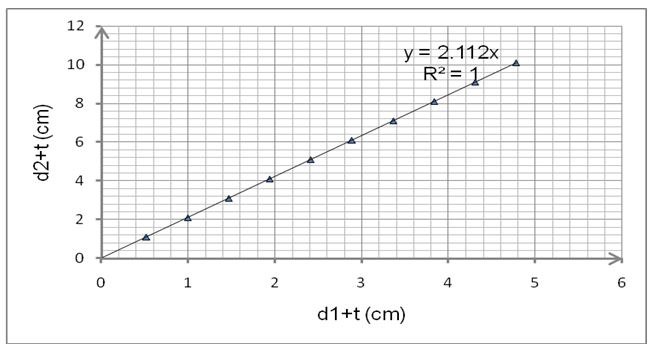
The plots for the above tables of data are shown below.

For open and crossed pulley systems, the ratio of revolutions per second of the driving pulley to that of the driven pulley is always inversely proportional to the rations of their diameters. However, this can only happen when there are no slips hence, there is a need to factor in these factors in the formula. Using the formula below the value of n1/n2 can be determined.
n2/n1 = (d1+t)/(d2+1)*[(100-s1)/100*(100-s2)/100]
where:
n1 and n2 are the revolutions per second of the driving pulley and the driven pulleys respectively,
d1 and d2 are the diameters of the driving and the driven pulleys respectively,
s1 and s2 are the percentage slips for the driving and driven pulleys respectively,
t is the thickness of the belt (0.1cm).
n1 = 0.3rev/sec, s1 =s2= 2%.
As such, a graph of (d1+t) against (d2+t) is a straight line through the origin. Hence; the gradient m is given as below:
m= n1/n2*[(100-s1)/100*(100-s2)/100] = 1.920
But, [(100-s1)/100*(100-s2)/100] = [(100-2)/100*(100-2)/100] = 0.9604.
Therefore, 0.9604n1/n2= 1.920
Hence; n1/n2=1.999 ≈2.0

Similarly, n1/n2 for the crossed pulley system can be obtained from the same formula. Given slightly different conditions; 0.9604n1/n2= 2.112
Thus, n1/n2= 2.199≈ 2.2
Discussion
The objective of this experiment was to determine the directions of motion of pulleys under open and crossed pulley systems. As such, a correlation between the drive and the driven shaft in terms of speed was ascertained to establish whether it matches a theoretical explanation.
As regards direction, the pulley system behaviors matched the theoretical explanation. To this end, an open pulley system moved in the same direction while the opposite was true for the crossed pulley system. Changing the directions of the driving pulleys to anticlockwise directions did not affect the results. As such, as opposed to gears and chains, flat belt pulleys are cheap to maneuver as regards direction (Flather, 1995).
Given the correlation between the ratios of diameters and that of speeds of pulleys portrayed a linear relationship. As such, as expected, a plot between the driving pulley diameters to that of the driving pulley portrayed a straight line through the origin. However, this graph would only pass the origin after factoring in percentage slip otherwise the line would cut the y-axis (d2+t) above the origin. This represents one demerit of flat belt pulleys; they are not efficient power transmitters.
Given that the driving diameter is X times that of the driven pulley then it means that the speed of the driven pulley is X times that of the driving pulley.
With the driving pulley moving at a constant speed, the speed of the driving pulley would be increased by increasing the diameter of the driving pulley or, reducing the diameter of the driving pulley.
Conclusions
The objective of this experiment was met since the directions of the pulleys in both arrangements matched the theoretical explanation. Also, the correlation between the speeds and diameters of driving and driven pulleys exhibited an inverse relation.
References
Flather, J. (1995). Rope-driving: a treatise on the transmission of power by means of fibrous ropes. New York, NY: Russell Sage Foundation.