In Economics, there is a difference between Real and Nominal variables. In general, a real variable is the one where the effects of inflation on the economy are factored. Contrary, a nominal variable is the variable where the impacts of inflation do not take care of the. Gross Domestic is defined as ” the value of all goods and services produced in a country ” (Borland, 2010).
The Nominal Gross Domestic Product is a concept that is used to measure the value of all goods and services produced in a country in current terms/prices. It is used to measure the value of services and goods per a definite period of time, while, as opposed to this, Real Gross Domestic Products concept is used to evaluate these issues, it is shown in prices of a base year.
For example, “suppose in the year 1999 the economy of China produced $200 billions worth of goods and services based on the year 1999” (Kym 2010).Thus, the year 1999 is used as a foundation at the same time, the nominal and real are the same (Kym 2010).
Then, Year 1999 Nominal GDP=$200B,Real GDP=$200. In the year 2000, the nominal GDP=$210B and Real GDP=$205B.Thus, Nominal GDP Growth Rate is 10% where as Real GDP growth rate is 5%. Hence, the difference between the two concepts is used to measure the rate of inflation in statistical terms. These statistical terms are referred to as the GDP deflators (Maddison 2005).
Hence, from this analysis, Real Gross Domestic Product is the best measure of economic growth because it estimates the cost in terms of production, and this is what the economy needs. RGDP can not result into both higher prices and higher outputs. Thus, real gross domestic product is the best measure of economic situation and not the best measure of the living standards.
This is because it does not provide any room for black market economy or profitability gained in a result of illegal goods; secondly, it does not measure aspects of well being, such as happiness for example. Furthermore, it ignores the gap between the poor and the rich in terms of resource distributions. In addition, RGDP omits efforts put into household productions, for example, work done by house wives. Moreover, our leisure time is not valued in real domestic product. Finally, it
does not take into account environmental destructions such as pollution caused during production (Eastman 2008). Below is an excel sheet for RGDP for China.
This illustration is a representation of China RGDP as Compared to Australia for ten years as adjusted for inflation. This data has been retrieved from China Economy watch statistics.

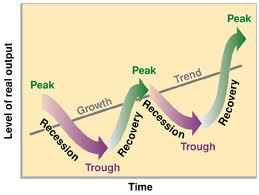
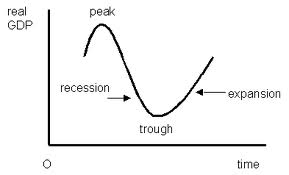
The above business diagram explains the business climate of China. The real gross domestic product for china was high in the last year which is 2010.In a similar understanding, the business climate was low in the year 1999 and 2000.This is represented by the trough in economic recession. The economy and business climate was at peak in the year 2010 with a growth of 10.3%.Note that this information has been extracted from Australia economy watch 2009.
NB.economy watch.com
The illustration below represents business cycle diagram for Australia. The diagram highlights the year 2000 as the peak of the economy and the year 2006 as the tough economic times of severe recession of the continental economy and business climate.

NB.economy watch.com
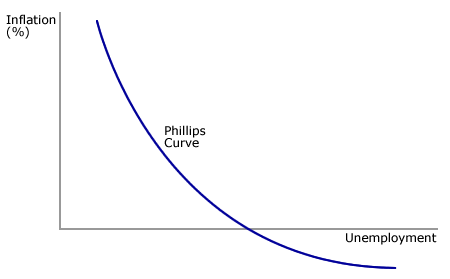
The use of the Philips theory is the most suitable to explain the economy of China for ten consecutive years since 2001 to 2010, as illustrated in the below diagrams. In the year 2000, the rate of inflation was high, and hence there was little or no employment. Philips theory explains that the high rate of inflation results into lack of employment (Borland 2010).
Hence, from the diagram, it is apparent that inflation has led China to low rate of employment as a consequence of inflation (Fairbank 2010). Thus, in conclusion, inflation leads to unemployment and this retards economic growth and development.

References
Borland, J (2010), Unemployment in Reshaping Australia’s Economy: Growth and with Equity and Sustainable Development, Cambridge: Cambridge University Press
Eastman, E. (2008), Family, fields, and ancestors: constancy and change in China’s social and economic history, New York: Cambridge University press
Fairbank, J (2010), East Asia: The Modern Transformation, London: University of England
Kym, A, (2010), Australia in the International Economy: In Reshaping Australia’s Economy, Growth with Equity and Sustainability, Cambridge: Cambridge University Press
Maddison, A, (2005), The World Economy: Historical Statistics, Paris: OECD