Abstract
There has been a significant increase in the number of overweight and obesity cases across the globe. The GCC region has recorded a massive increase in the population that is obese as compared to other parts of the world. This has prompted individuals to use various approaches to lose weight. One approach that is gaining popularity over the last decade is Bariatric surgery. The paper carried analysis of descriptive statistics and graphs for the number of weight loss surgeries in the GCC.
The analysis was carried out between the year 1995 and 2015. The results show that there was a significant increase in the number of weight loss surgeries in the GCC. Further, a rapid increase was experienced from the year 2004. The average number of weight loss surgeries conducted in GCC was 88,241. Finally, the surgeries conducted in Saudi Arabia and United Arab Emirates accounted for more than 60% of the total surgeries in the GCC.
Introduction
Cases of obesity and overweight have increased significantly over the past years across the globe. The situation in the GCC is considered bad because the cases of overweight and obesity rates have grown at a disturbing rate over the past 10 years. Studies indicate that women in the GCC are generally more than men (Almunajjed, 2012). This can be attributed to the culture and lifestyle in the region. The data for prevalence of overweight for the member states in the GCC are summarized in the table below.
The high percentages of overweight and obesity has created a need to fight this major health concern. One of the major approaches that people use to treat obesity is weight loss surgery (Bariatric surgery). The demand for Bariatric surgery among adolescents and adults has grown significantly in the GCC. In some countries such as Qatar, the surgery is performed at no cost to the nationals by hospitals such as Hamad Medical Corporation (Hamad Medical Corporation, 2015; Hamad Medical Corporation, 2016). Further, it is estimated that about 30% of the obese population always goes for the weight loss surgery (ALNohair, 2014). The main objective of the paper is to carry out data analysis for number of weight loss surgery in the GCC.
Data
The data for the total number of people who have undergone weight loss surgery between the period 1995 and 2015 was collected from the Word Bank and World Health Organization websites (The World Bank, 2016; World Health Organization, 2016). Further, the data are collected from all the six member states that make up the GCC. The table presented below shows the total number of people who have undergone weight loss surgery in the six countries and the total for the GCC region.
Descriptive statics
Results of descriptive statistics
Graphs
Proportion

Trend analysis

Comparison results
Column graph

Bar graph

Analysis and conclusion
Descriptive statistics
The descriptive statistics give a summary of the data of Bariatric surgery in the GCC. The mean gives information on the average number of surgeries conducted in the GCC between the year 1995 and 2015. A comparison of the mean values shows that Bahrain had the lowest mean (4,651.42) while Saudi Arabia had the highest value (26,839.28). The differences in the mean values can partly be attributed to the differences in size of population in these countries.
The mean for GCC is 88,241. The median is the middle value of the data set. They are values that were reported in the year 2005. Standard deviation is a measure of dispersion. It shows how the values are spread around the mean. A high value of standard deviation implies that the values are widely spread from the mean. The result shows that Saudi Arabia had the highest value of standard deviation while Bahrain had the lowest value.
The standard deviation for GCC was 74,736. The high value of the standard deviation can be attributed to the significant growth of a number of weight loss surgeries over the years. The range shows the difference between the maximum and the minimum value in the data set. The range is also a basic measure of dispersion. It shows how the values in the data set are spread. The range of weight loss surgeries in GCC was 101,143. The high value shows that the there was significant growth in the variable during the 21 year period.
A comparison can also be made on skewness and kurtosis of the data set. These two elements of descriptive statistics give information on the symmetry of the data used. The results of skewness and kurtosis can be used to make inferences about the normality of the data. For a normally distributed data, the value of skewness is zero while the value of kurtosis is 3. Thus, positive values of skewness indicate that the data is tilted to the right while negative skewness implies that the data is slanted to the left. The values of skewness for all the countries and GCC were positive. This shows that they are tilted to the right.
Further, the values for Bahrain (0.25), Saudi Arabia (0.34), United Arab Emirates (0.34), and GCC (0.42) were close to zero. This shows that the data are nearly symmetrical. Oman had the highest value of skewness (1.42) followed by Kuwait (0.60), and Qatar (0.58). The data for these countries are skewed to the right. On the other hand, Bahrain (-1.65), Qatar (-1.40), Saudi Arabia (-1.69), United Arabs Emirates (-1.69), and GCC (1.54) had a relatively similar level of kurtosis.
The values of kurtosis show that they have similar levels of peakedness. Further, Kuwait (-0.98) and Oman (0.95) had lower levels of kurtosis as compared to those of the other countries. Thus, based on the values of skewness and kurtosis, the data for Bahrain is closer to normality while the data for Oman is less close to normality. It can be concluded that the data set for all the six countries and GCC do not follow a normal distribution.
Graphs
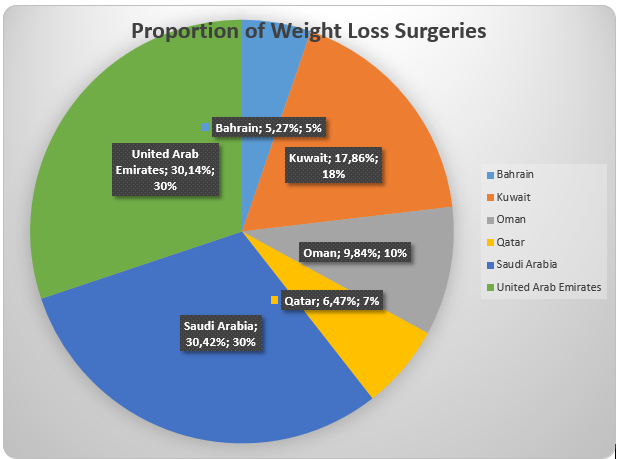
The pie chart shows the proportion of the number of weight loss surgeries for each county in the GCC. The chart shows the number of surgeries carried out in Saudi Arabia (30.42%) accounted for the highest percentage of total number of surgeries in the GCC. This was followed by the United Arab Emirates (30.14%) and Kuwait (17.86%). Bahrain had the least percentage (5.27%). Thus, it can be observed that the two countries (Saudi Arabia and United Arab Emirates) accounted for more than half of the total surgeries in the GCC. This can be attributed to the high size of population in these two countries. Thus, movements in the number of surgeries in these countries will have a direct effect on overall total for the GCC.
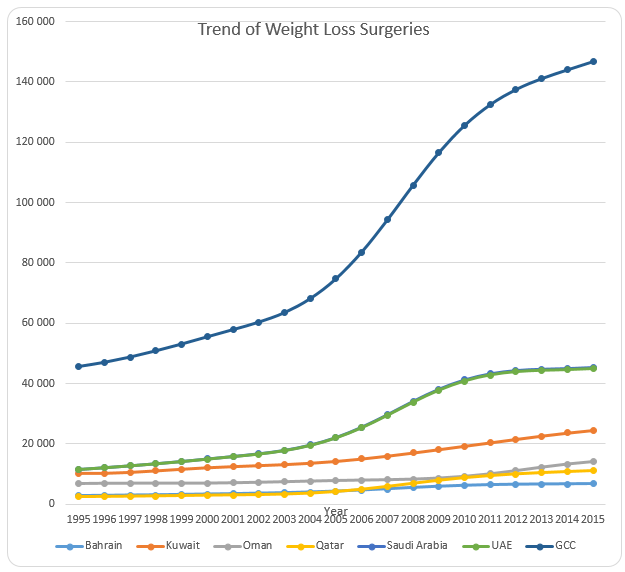
The line graph presented above shows the trend of the number of surgeries carried out between 1995 and 2015. It can be noted that there was an increase in the number of surgeries in all the six countries and in the GCC. Further, it can be observed that the growth rate increased tremendously after 2010. This can be seen in the change of the steepness of the line graphs. The increase can be attributed to the rapid increase in cases of obesity after 2010.
The increase can also be attributed to increased awareness in the use of Bariatric surgery across the globe. The line graph for GCC also displays a significant increase number of surgeries. A steep increase was experienced between the year 2004 and 2011. This shows that the number of Bariatric surgeries increased at an increasing rate during this period. After 2011, the rate of increase slowed down.
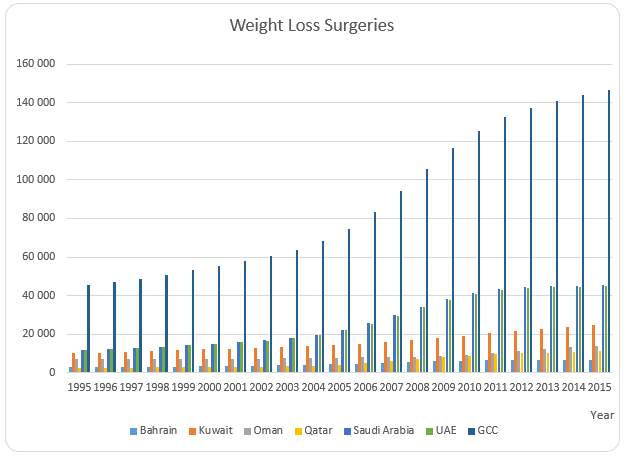
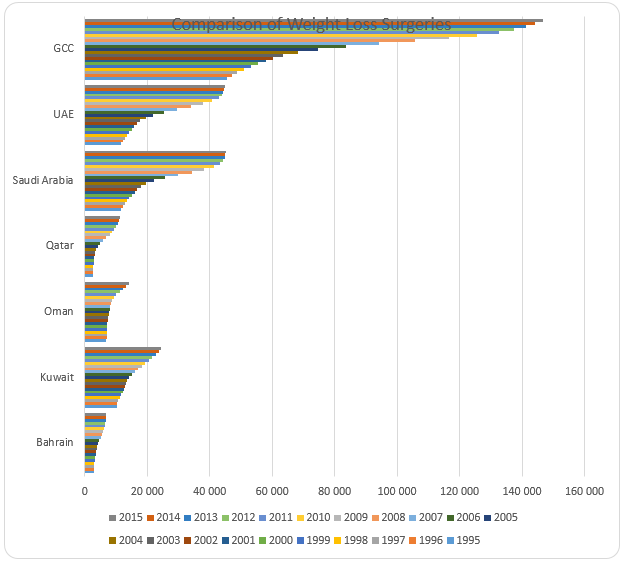
Finally, the column and bar graphs show a comparison of the number of surgeries for GCC and the six countries. The graph shows that Saudi Arabia and Saudi Arabia had the highest number of weight loss surgeries while Bahrain had the lowest number of surgeries. The graph also shows that there was an increase in the number of surgeries in all the countries and GCC during the period of analysis.
References
Almunajjed, M. (2012). Losing weight: challenge for women in GCC states. Web.
ALNohair, S. (2014). Obesity in Gulf Countries: International Journal of Health Sciences, 8(1), 79-83.
Hamad Medical Corporation. (2015). HMC hosts 2nd Qatar international summit on metabolic and bariatric surgery. Web.
Hamad Medical Corporation. (2016). 3rdQatar international metabolic and bariatric surgery summit. Web.
The World Bank. (2016). Data.
World Health Organization. (2016). Obesity – situations and trend. Web.