Introduction
In general, taxes refer to mandatory payments to either local, regional, or national governmental institutions. These contributions comprise a major part of the government’s budget and are, consequently, spent on public services, such as education, healthcare, urban development, and other areas supported by official organizations. There is a large variety of taxes, including property charges, income taxes, and sales expenses. However, it is essential to find a proper balance between raising revenue and expenditure, and it is the government’s duty to effectively regulate the system. One of the prominent theoretical models of tax management is the Laffer Curve, which demonstrates the relationship between the revenue collected and tax rates. Ultimately, the current paper attempts to examine the Laffer Curve, emphasizing the history of tax revenue, analyzing the contemporary tax reforms, and discussing the moral Judeo-Christian approach to the subject.
Laffer Curve Analysis
Laffer Curve
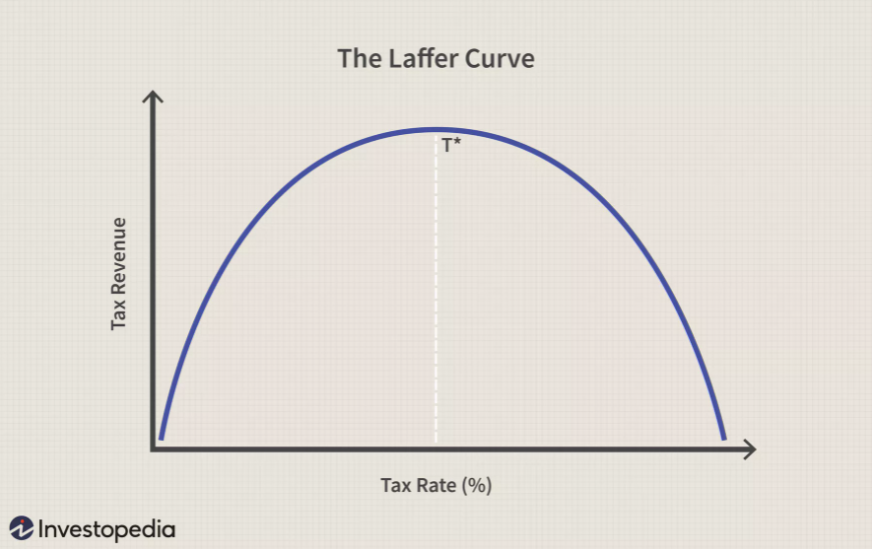
As mentioned briefly before, the Laffer Curve is a theoretical framework that illustrates the relationship between tax rates and the amount of revenue raised by the government. Nevertheless, the model is implemented not only for descriptive purposes but also can be used to optimize the current tax rate and achieve maximum profits (Hayes, 2021). In general, it implies that if the taxes (primarily income taxes) are overly extensive, it would discourage people from increasing their overall wealth, investing, and participating in any type of financial activity (Hayes, 2021). Ultimately, there are certain thresholds for every kind of taxes, that would produce less overall revenue if the border point is exceeded, and, therefore, require different representations of the Laffer Curve (Hayes, 2021). In the practical sense, the Laffer Curve is a simple graph, which is demonstrated below:

In the chart, the far left point on the X-axis represents the 0% tax rate which would result in the absence of tax revenue. Consequently, the far right point indicates the 100% tax rate, which would also result in zero revenue since people would give up their jobs (this is true under the premise of the free market and that people are not forced to work). Taking these assumptions into account, there must be a certain point where the tax rate would enable the maximum tax revenue, and this threshold is represented by T* in the graph.
Nevertheless, while the general description of the Laffer Curve is oversimplified, it is highly complex to find the T* point due to the variety of factors affecting the model. For instance, there could be more than one T*, implying the uneven distribution of the curve. Furthermore, the threshold point is not static in real-life scenarios and requires additional mathematical and economic calculations. Lastly, the Laffer Curve model might be used in a large variety of political and economic regimes. For instance, recent research demonstrates that the Chinese tax rate should be reduced by 5% to maximize revenue (Lin & Jia, 2019). The authors have implemented Computable General Equilibrium (CGE) that utilized a large number of complex calculations to find the T* (Lin & Jia, 2019). Ultimately, while the general concept of the Laffer Curve is simple, it requires a significant number of additional efforts to fully utilize the framework.
History
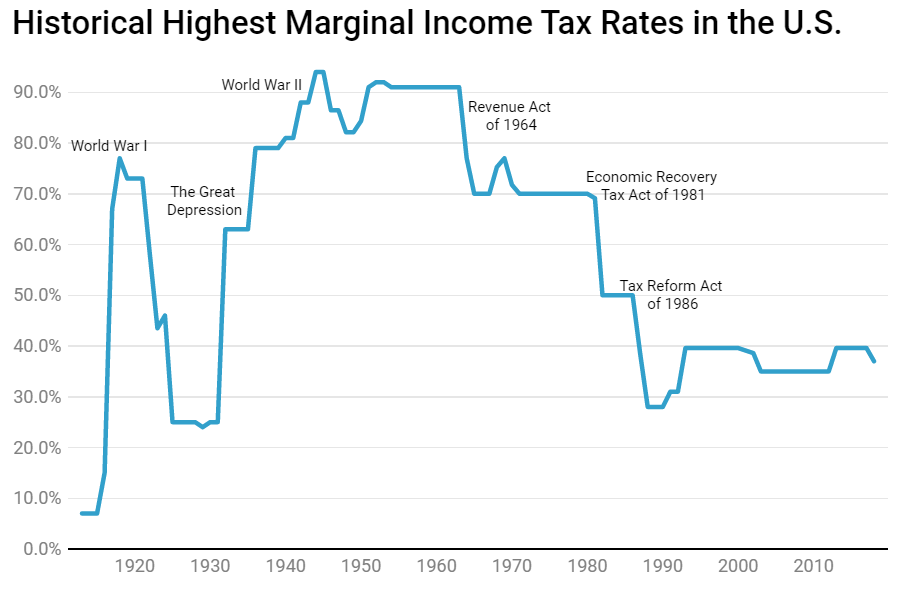
Historically, there are some debates concerning the origin of the Laffer Curve; however, it is generally considered that the theory under its current name was first introduced by Arthur Laffer in 1974. At the time, the authorities believed that higher taxes result in higher revenue; however, according to the Laffer Curve and contemporary state of knowledge, it is not true (Hayes, 2021). Ultimately, American tax history has experienced a large variety of changes and reforms due to the political and economic preferences of presidents and external factors (Fontinelle, 2020). For instance, the marginal tax rate, which increases accordingly to the income of the individuals, has seen a drastic change over the last century and is presented below:

Concerning the tax cuts, one of the most prominent reforms in American history is the Economic Recovery Tax Act of 1981 (ERTA) implemented by Ronald Reagan (Kagan, 2020). The regulation was carried out according to the primary concepts of supply-side economics and has a close connection to Arthur Laffer, the financial adviser of the president and the creator of the Laffer Curve (Kagan, 2020). Ultimately, the ERTA cut the maximum threshold of the income tax from 70% to 50% and the minimum threshold from 14% to 11% (Kagan, 2020). Overall, the American tax system has experienced a large number of reforms and changes over its history.
Tax Cuts and Tax Reforms
Tax Cuts Benefits
The contemporary economics of the 21st century has also seen several tax reforms, which primarily concern cuts of the income taxes. There have been five major acts implemented under Bush, four acts signed by Obama, and the Tax Cuts and Jobs Act of 2017 by Trump (Wamhoff & Gardner, 2018). The advocates of these policies claim that effective tax cuts might significantly improve the economy of the country by accelerating spending (Cloutier, 2021). This approach is supported by the idea that if people get more money due to tax cuts, they will spend these finances to buy goods, which would eventually result in a boosted economy (Cloutier, 2021). While this statement is true, the benefits from tax cuts are most evident when they are targeted at people with low or moderate income; it implies that the taxes that wealthy people pay do not affect the economy in the long term (Cloutier, 2021). This controversy creates a problem of social and financial equity, which are the core concepts in decision-making concerning taxes. Nevertheless, most experts agree that cut taxes might have a beneficial impact on the economy if implemented correctly.
Contemporary Tax Reforms
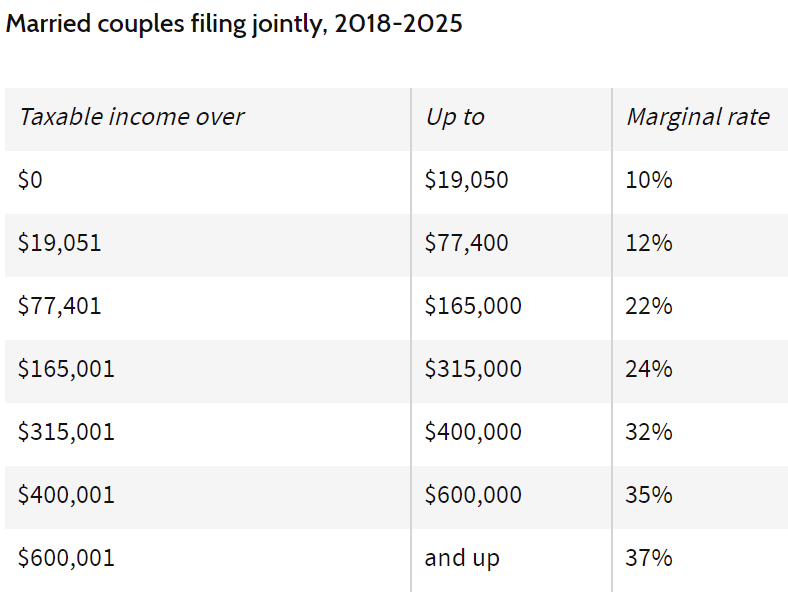
As seen from figure 2, the maximum marginal income tax rates have been gradually decreasing for the past century, implying the confidence of the government in the economic policies. The most notable tax reform in recent years is the Tax Cuts and Jobs Act of 2017 implemented by Trump. This economic policy was aimed to cut the taxes throughout all the levels of financial income and has fairly succeeded in accomplishing this mission. The Tax Policy Center has presented the statistics that approximately 65% of American citizens had received a tax cut (Floyd, 2021). The marginal income tax rates were reduced throughout the seven brackets of wealth by approximately 2-3% (Floyd, 2021). The current scheme of personal taxes varies depending on the type of household and has the following structure:

Seven Brackets of Personal Taxes for Married Couples Filing Jointly
Additionally, the TCJA has established a specific corporate tax rate of 21% that is supposed to vastly increase the number of available occupations in the country (Floyd, 2021). Overall, the Tax Foundation prognoses a 3% increase in GDP due to the TCJA by 2027 (Gale, Gelfond, Krupkin & Mazur, 2018). Ultimately, most people are satisfied with the current state of the tax reform; however, some experts consider that TCJA should have simplified the tax system more and could have achieved greater success.
Judeo-Christian Perspective
The Judeo-Christian perspective is commonly considered to be a synonym for ‘fair’ and regulates the moral and ethical perspectives on various topics. Concerning the tax system, the moral principles generally imply either horizontal equity, the concept that all people should pay equal taxes, and vertical equity, the idea that wealthy people should allocate more funds to the government (Cloutier, 2021). In general, Judeo-Christian ethics support the vertical equity approach since if everyone pays the same taxes, it would inevitably put financial pressure on poor people without providing any opportunities to change it. Therefore, it is vital to address the tax cuts in such a way, so that the poorest and neediest people would get the chance to improve their financial well-being.
Conclusion
Summing up, the current paper has examined the Laffer Curve theory, discussed the recent history of tax reforms in the United States, presented the major arguments for the tax cuts incentives, and analyzed the most significant policy of the recent years, Tax Cuts and Jobs Act of 2017. Overall, the TCJA has had considerable success and beneficially impacted the economy of the country. Additionally, the paper has examined the Judeo-Christian perspective on the tax cuts and revealed certain problems in the tax system.
References
Cloutier, R. (2021). How tax cuts affect the economy. Web.
Floyd, D. (2021). Explaining the Trump tax reform plan. Web.
Fontinelle, A. (2020). A brief history of taxes in the U. S. Web.
Gale, W. G., Gelfond, H., Krupkin, A., & Mazur, M. J. (2018). Effects of the tax cuts and jobs act: A preliminary analysis. Tax Policy Center: Urban Institute & Brookings Institution.
Hayes, A. (2021). Laffer Curve. Web.
Kagan, J. (2020). Economic recovery tax act of 1981 (ERTA). Web.
Lin, B., & Jia, Z. (2019). Tax rate, government revenue and economic performance: A perspective of Laffer curve.China Economic Review, 56, 101307. Web.
Wamhoff, S., & Gardner, M. (2018). Federal tax cuts in the Bush, Obama, and Trump years. Institute on Taxation and Economic Policy (ITEP).