Introduction
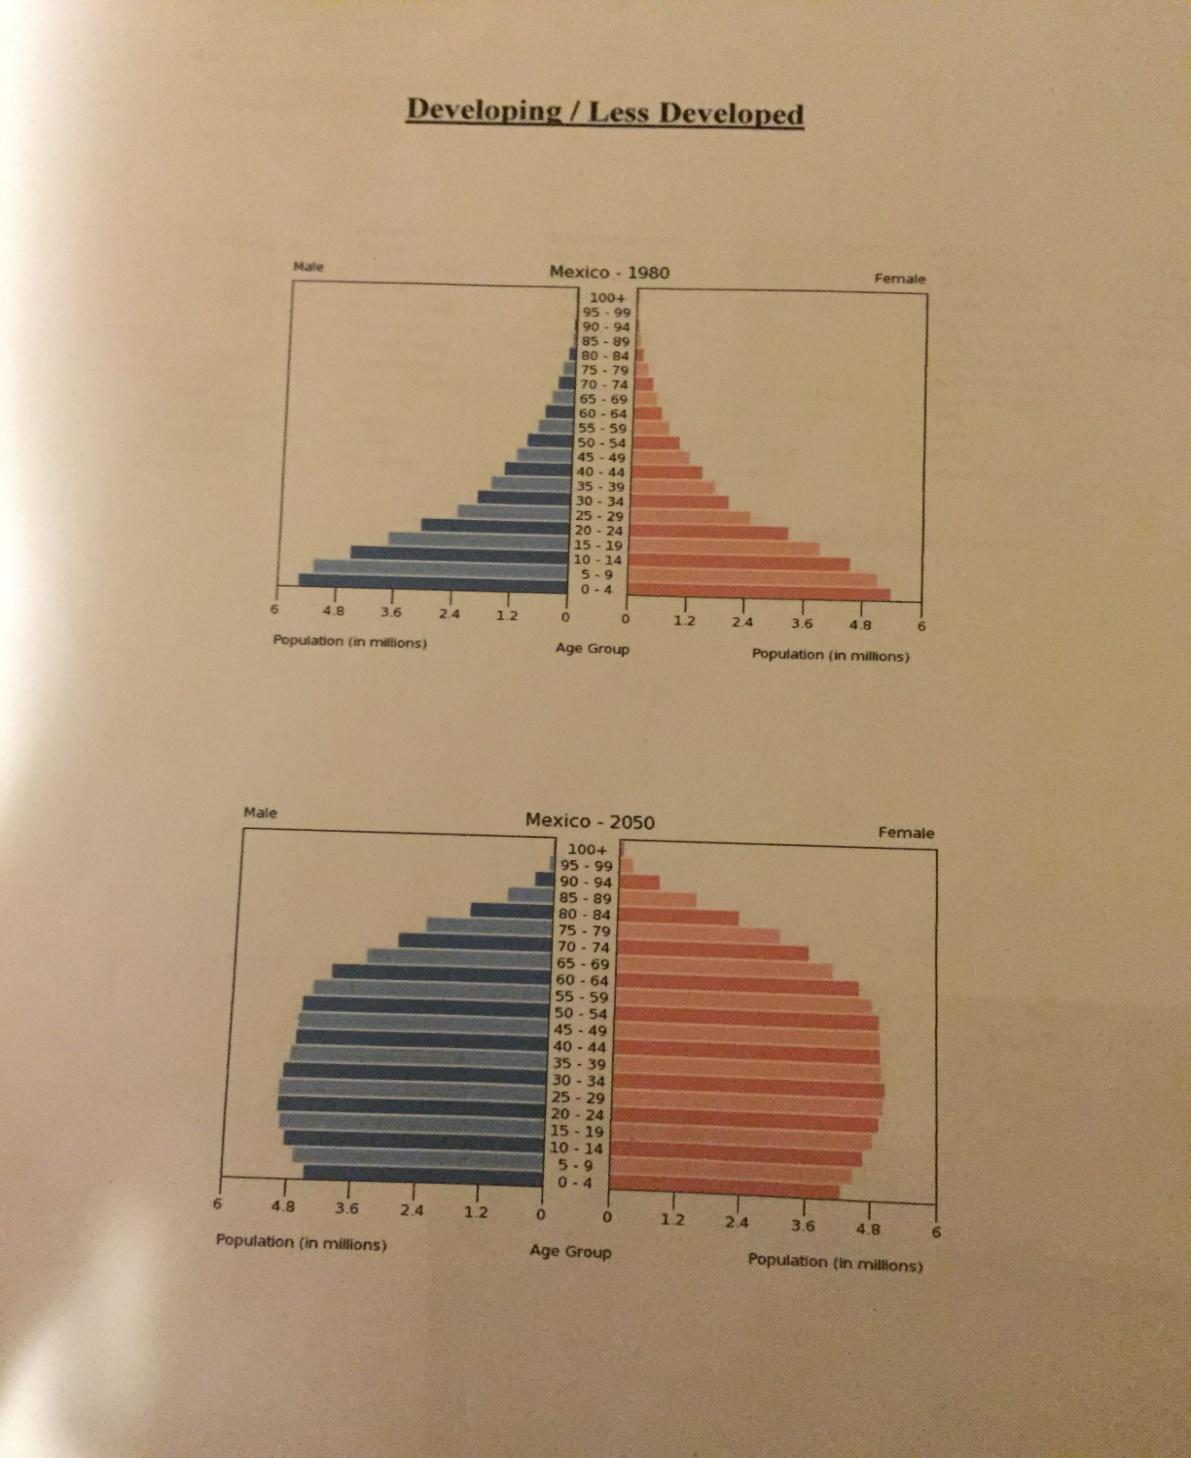
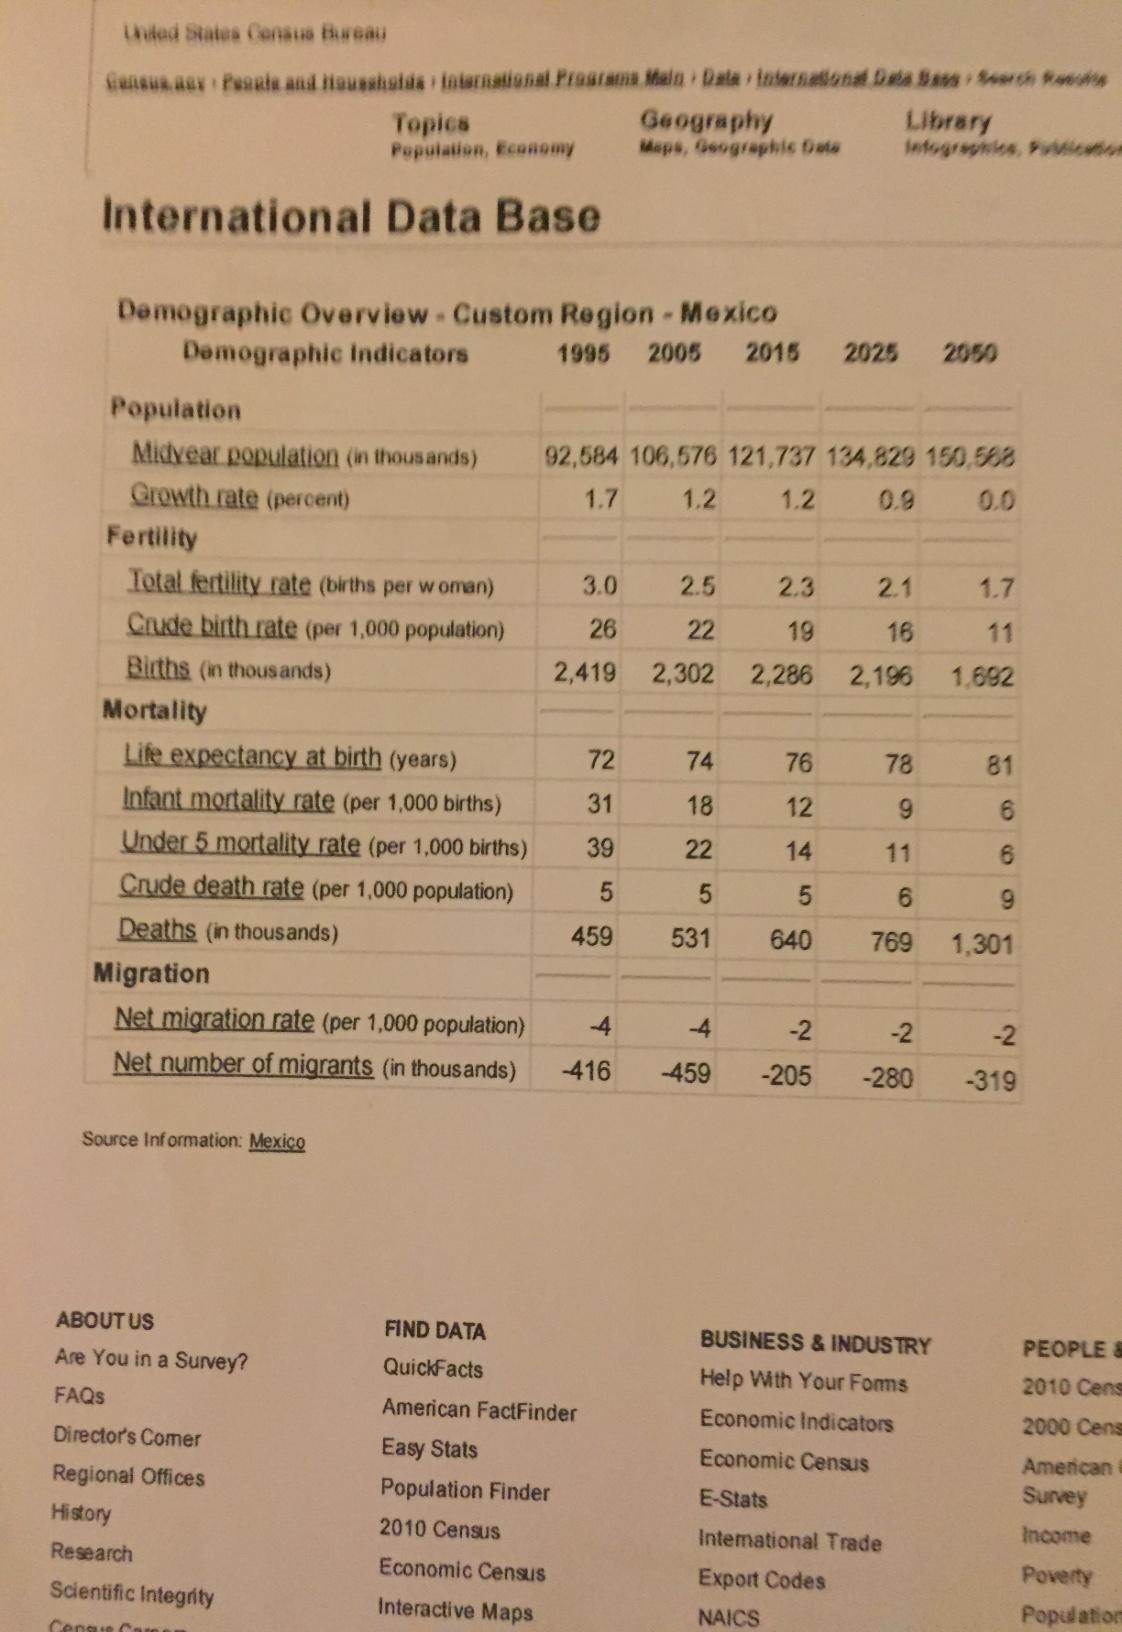
The less developed country that will be analyzed is Mexico. In 1980, the population pyramid had an evenly flowing triangle with a wide base and a very narrow apex. This shows that persons below the age of 30 were the majority while those about 80 years were just a fraction of the population. In 2050, the shape of the pyramid is that of a triangle with a thin apex and wider trunk than the base as shown in appendix 1.
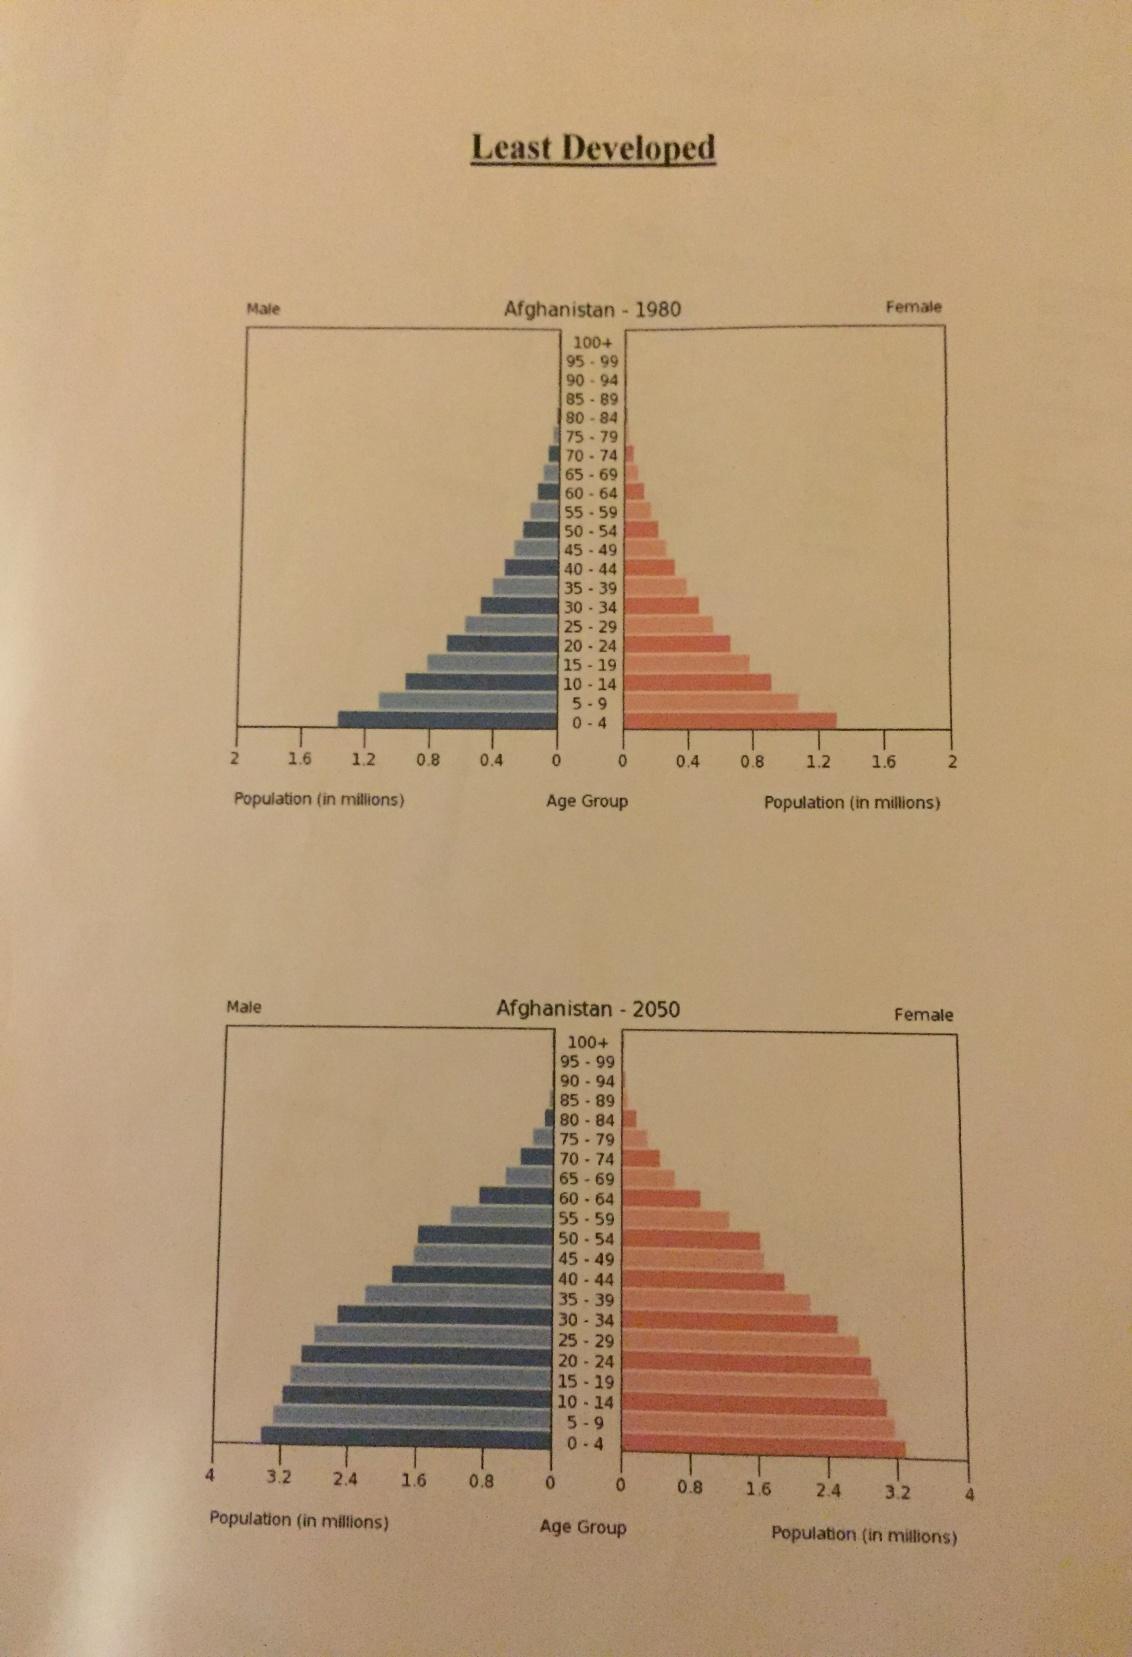
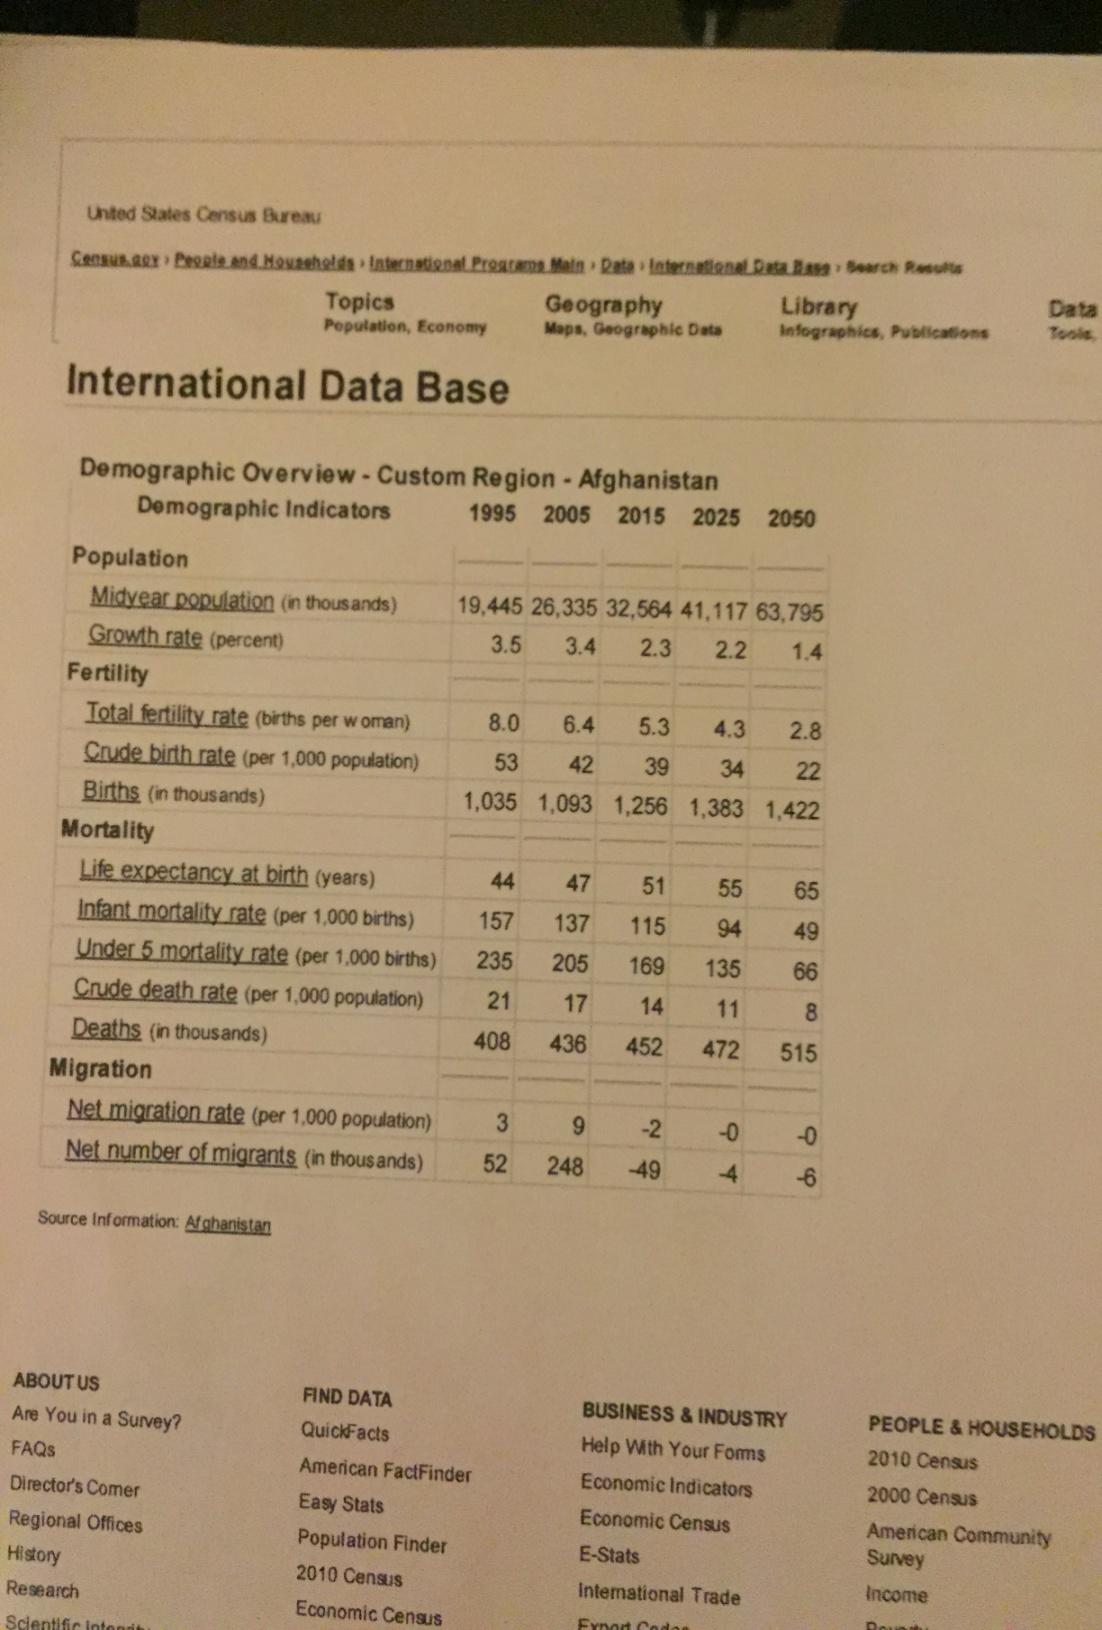
This means that persons above 20 years and below 70 years were the majority as shown in Appendix 2. Another country is Afghanistan. In 1980, the population pyramid was an even and steep flowing triangle with a wide base and a very narrow apex with the majority age being persons from 0 to 4 years. In 2050, the shape of the pyramid is evenly flowing, but not every step with the population for each age bracket decreasing at a slower rate than in 1890 as indicated in appendix 3 and appendix 4.
Discussion
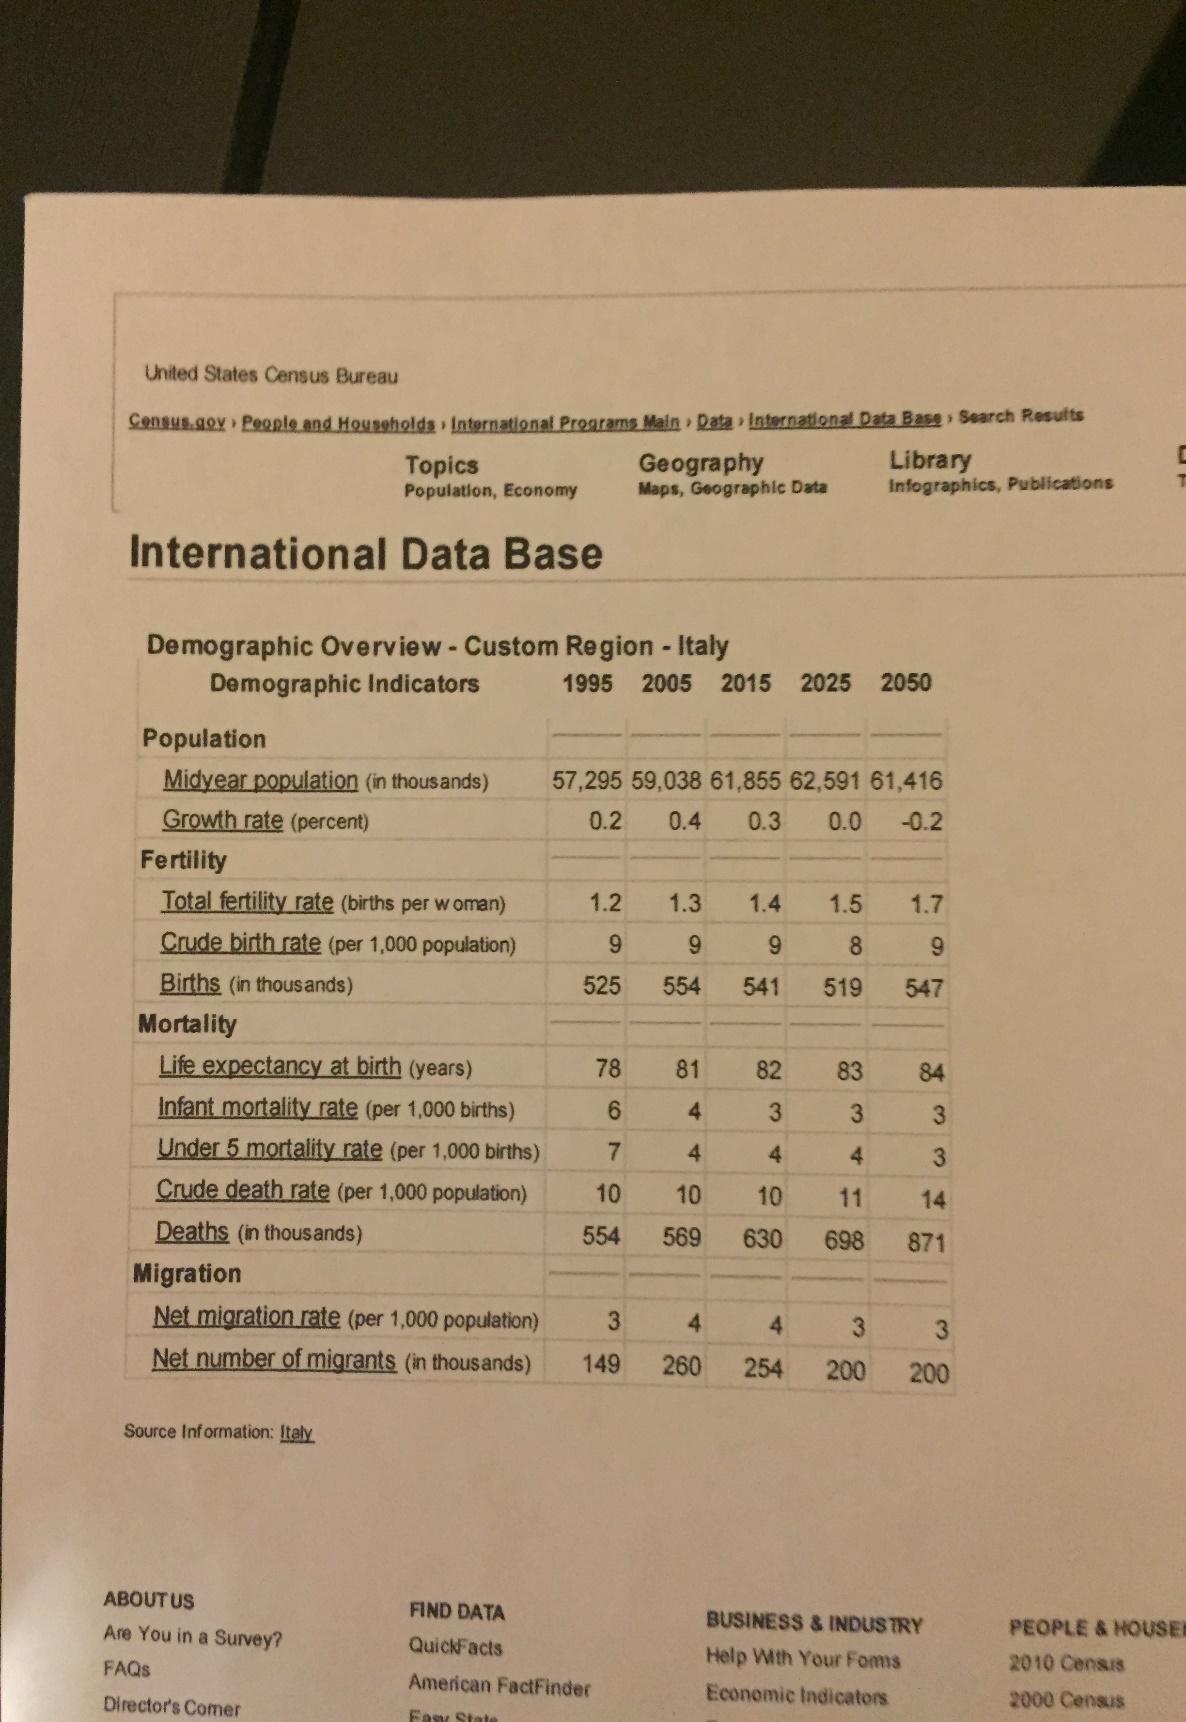
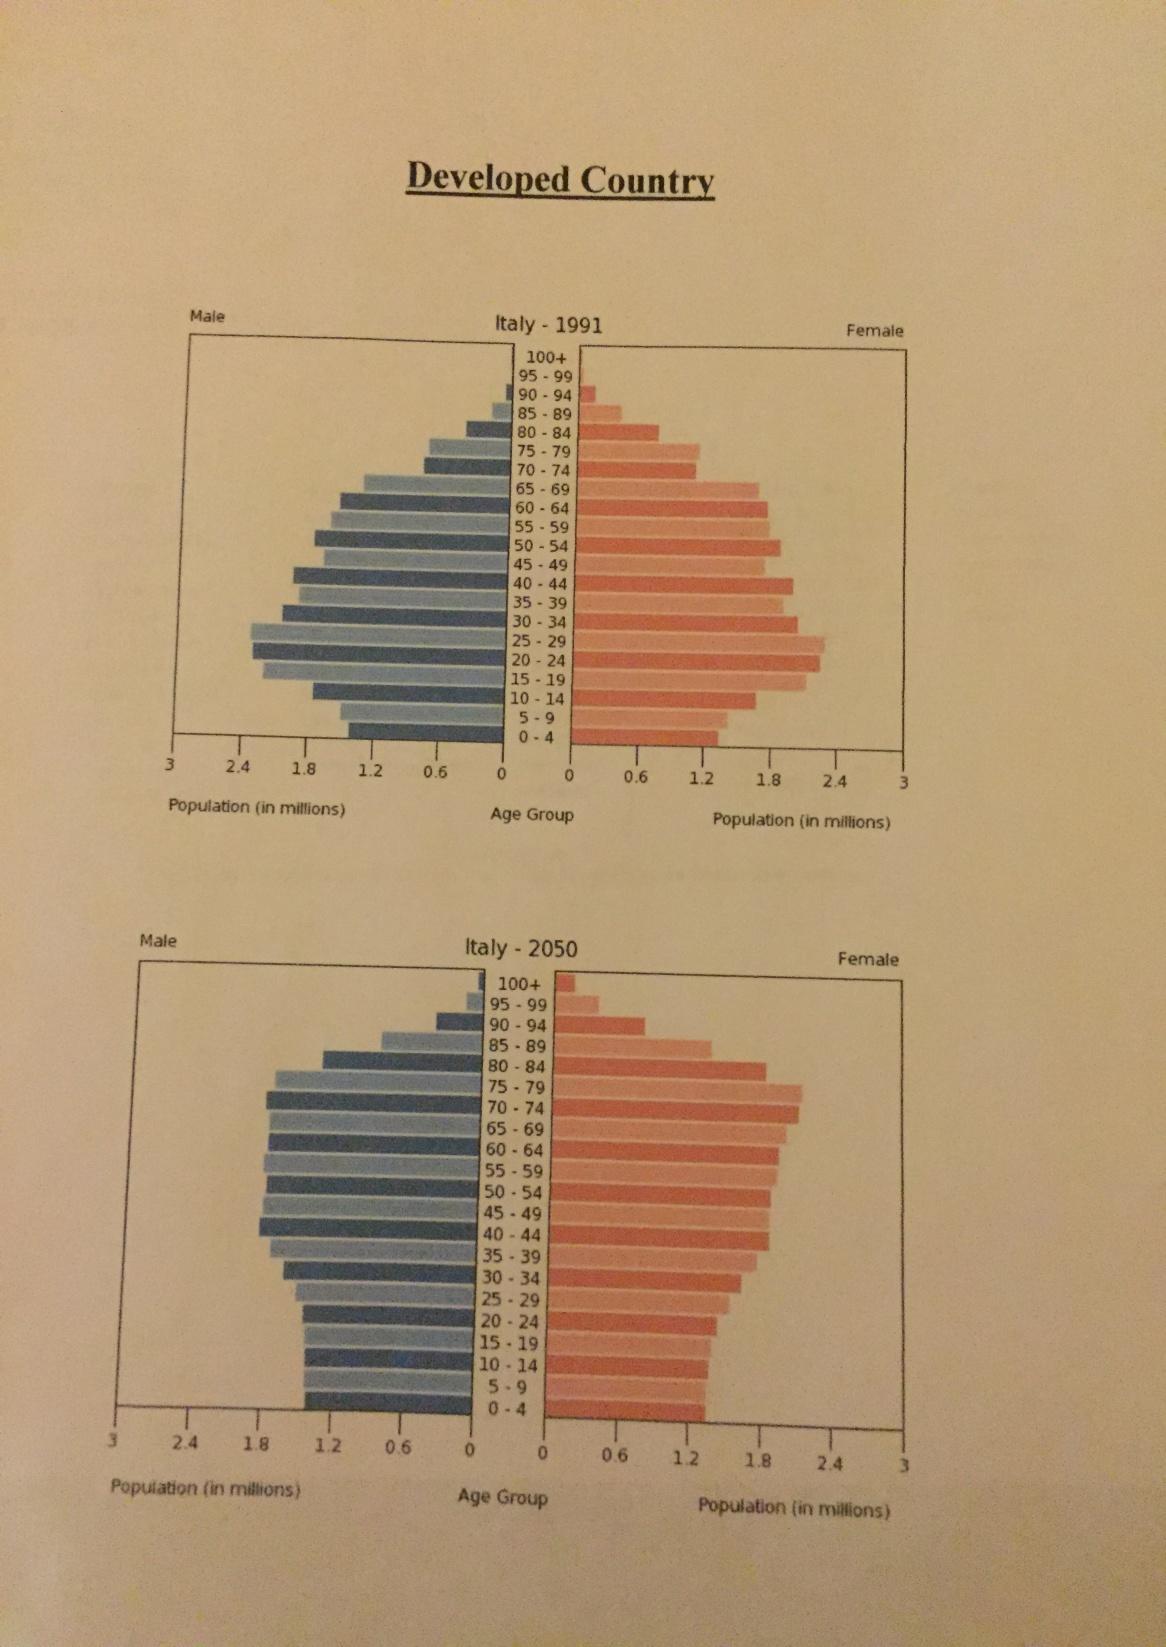
An example of a developed country is Italy. In 1991, the shape of the pyramid for this country was uneven, with the largest part being in the middle of the triangle. This means that the majority age bracket was 15 to 69 years as indicated in appendix 6. In 2050, the shape of the pyramid is that of an inverted triangle with the largest section being the age bracket between 35 to 80 years as indicated in appendix 5.
The sex ratio between male and female is similar in the three countries for persons above 80 years with a slight difference recorded in the developed country in the case of data for the year 2050 data, where the female gender at 80 years is expected to be more than the male gender as indicated in appendix 2, appendix 4, and appendix 6. However, there is a general trend of increased life expectancy in the three categories of countries with the highest being in developed countries followed by developing countries, and least in the undeveloped country.
The indicator of life expectancy is highest in the developed country followed by developing country and least in the underdeveloped country. However, the fertility rate is lowest in developed countries and highest in developed countries. Apparently, the mortality rate is highest in the least developed country. Generally, the life expectancy is increasing in all the categories of countries, that is, the population is getting older with the highest expectancy in developed countries. The life expectancy has increased by between 15% and 32% for the three countries. From the pyramids, there was a decline in the number of births per woman with the highest decline recorded in developed countries followed by the developing country, and least in the underdeveloped country.
Conclusion
The life expectancy rate was highest in developed counties. This shows that living standards are high in a developed country and low in an underdeveloped country. The high life expectancy is a result of better social and economic factors such as medical cover, social support, income, security, and general well-being in the developed country than the other two categories of countries. Apparently, the mortality rate is high in the least developed country due to a higher level of exposure to risks associated with poor health, pathetic living standards, and inability to attract better income as a result of high unemployment rates.
The unique challenges that the developed country is likely to face are the inability to attract enough labor and excessive expenditure in taking care of the aging population who are expected to work beyond retirement age. The developing country may face the challenge of increased unemployment and competition of limited resources as the life expectancy increases. The underdeveloped countries will face the challenge of increasing unemployment as the population grows and the inability to provide social amenities for the growing number of youths.
Appendices
Appendix 1
Appendix 2
Appendix 3
Appendix 4
Appendix 5
Appendix 6
