Introduction
Dar Al Takaful PJSC was established in 2008 with a paid-up capital of AED 100 Million. It started as an Islamic Insurance Company based in Dubai and it was providing Shariah-compliant solutions for your insurance needs. Currently, Takaful has extended to other Muslim populated areas across the world. Along with Takaful, Re-Takaful started in 1985. Re-Takaful may be categorized as another cooperative system of reimbursement. Takaful operators now attract considerable interest, which creates awareness and the need for Re-Takaful to comply with the requirements of Sharia (Ernst&Young, 4). These are the key elements of the strong adherence to the community’s first principles that are fulfilled by the Takaful Company. The Sharia in question regulates the Islamic insurance market. It sufficed to mention that Takaful does not have a long history of operating in the UAE. It has grown due to the rapid expansion of a number of companies. These companies were built on the assumption that the public wanted Islamic institutions. In the year 2010, the market share was 6 percent of the total premiums written. However, between 2005 and 2008 the UAE’s Takaful market grew by 135 percent, before shrinking in a declining local economy (Ernst&Young 6). With the help of data charts, this work debates and analyses the profits and the returns for Takaful and Re-Takaful companies.
Background Of The Companies
To begin with, the momentous growth of Takaful and Islamic finance was in the sections of Asia, The Middle East, Europe, and Africa. The firm in question expanded at an estimated compound annual expansion rate of 39% between the year 2005 and the year 2008. To be specific, this was in terms of premiums growth. A growth of 28% in South Asia and 45% in the GCC also occurred. In addition, the growth of international insurance was 7%. One should note that the approximate size of the firm’s premium was USD8.9bn in 2008 and USD5.3bn in 2008. In as much as Takaful is still a small firm, it is continuously growing (Bhatty, 1).
An Analysis of the Returns
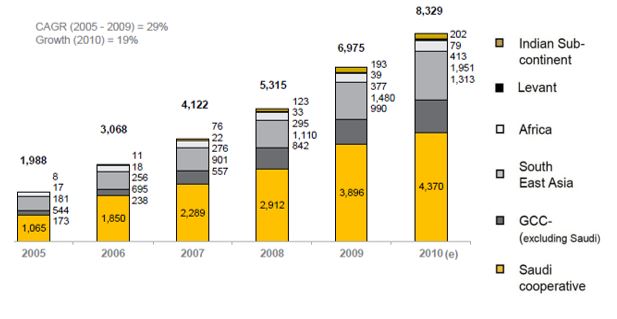
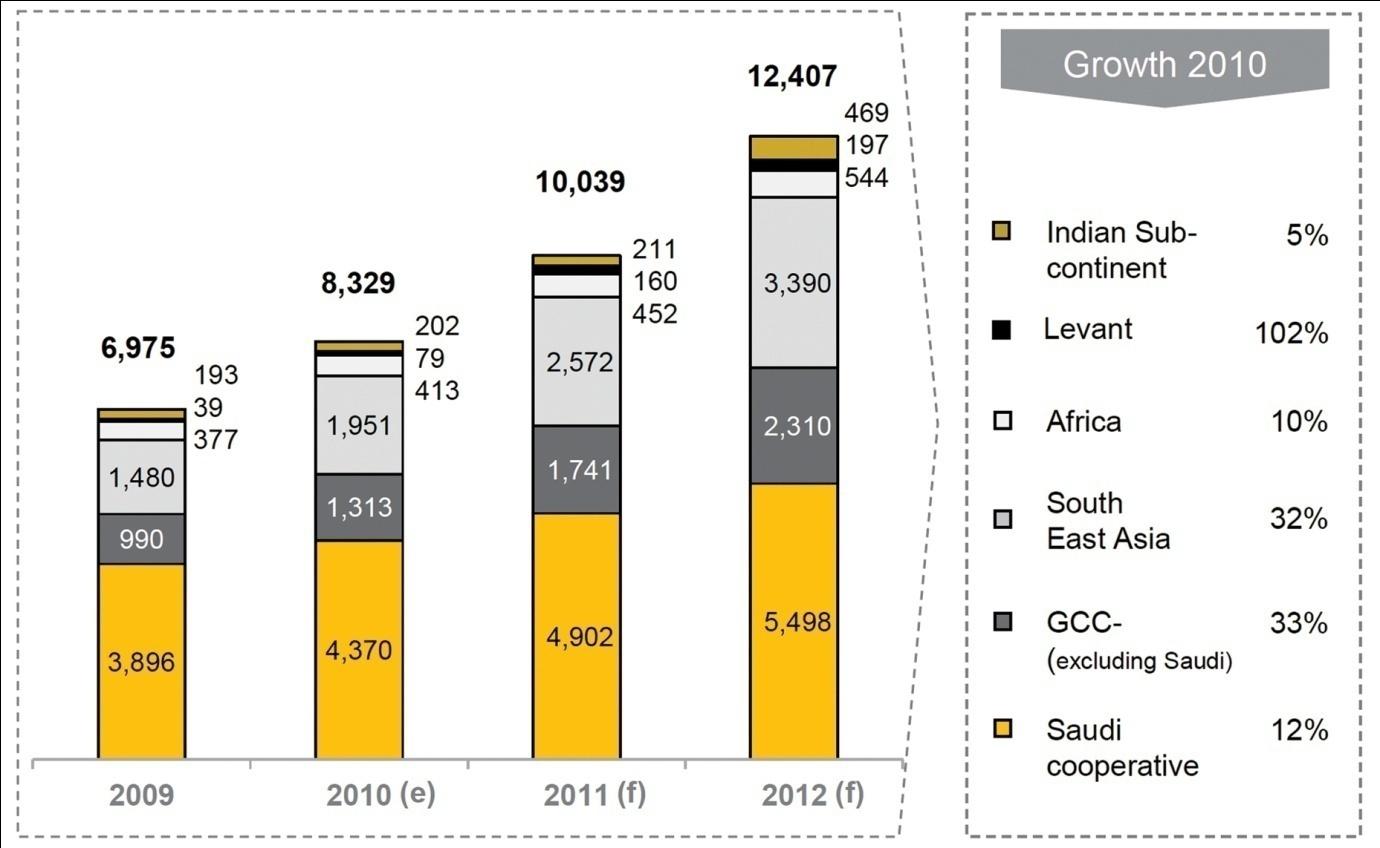
According to Islamic Finance News (7), global Takaful contributions grew by 19% in 2010 to US$ 8.3b. Total contributions are expected to reach US$ 12b by the end of the year 2012. This is illustrated by figure 1 below.
Growth In Takaful Operations
As shown in figure 2 above, the growth in GCC (excluding Saudi) market comprises 33% of the entire Takaful global market. It also comprises 32% of South-East Asia implying that these two markets are the most dynamic markets in terms of growth. Nonetheless, in terms of the size of the market, the Takaful market is the largest in Saudia Arabia. This owes to the fact that it commands an asset base of approximately US$ 5.5b as of 2012.
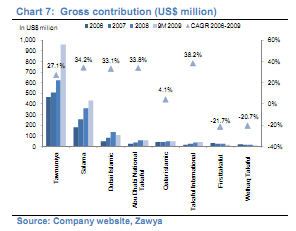
The standard top-layer CAGR for the Takaful peer group was 26.5% from 2007 to Q3 2009. All firms recorded increased growth rates with the exception of Wethaq Takaful and First Takaful. It is worth noting that both companies are based in Kuwait (Islamic Finance News, 22). The companies were faced with very strong rivalry in the local markets from new entrants and conventional insurers in the Takaful market (See chart 1) below.
The Returns Vs Takaful Operations
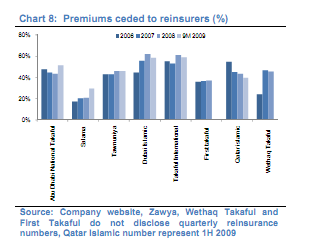
The outcomes from the first nine months reveal that the rate of growth may remain sturdy in 2009. The predicted outcome in a number of regional variations portrays a stronger performance by Abu Dhabi compared to Dubai-based firms. For instance, insurance firms in the area tend to insure long-tailed and most complicated risks. Due to inadequate Re-Takaful ability, it is tricky for Takaful operations. In 2008, the GCC peer grouping yielded an average of 40.4% as contrasted to 37.7% in 2006 (See chart 8). This style of reduced risk retention progressed in the first 3 quarters of 2009 with 47.4% of premiums yielded (Zaywa, 2011). This indicates that Takaful operations are progressively shifting to more intricate and long-tailed risk classes that to this day were subjugated by predictable insurers. That said Re-Takaful ability is crucial for the progressive growth of the Takaful industry (Alpen Capital, 12).
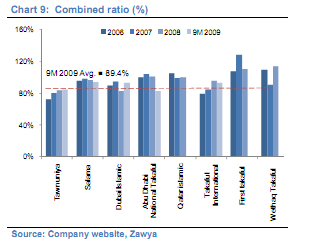
In the past years, GCC Takaful firms have displayed increased expenditure ratios as compared to their conservative rivals. This is mainly due to the rather reduced use of technology and the reduced economies of scale. This statement is clearly illustrated by chart 3 below.
The Takaful participants are somehow limited to their options of Shariah complying investments. In general, the investments involve listed real estate and equities.
A Description Of The Asset Performance
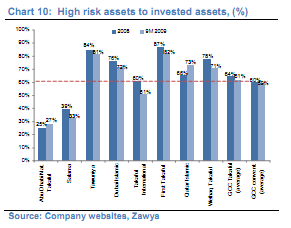
Spotlight to uncertain investments (real estates and equities) in the Takaful operations was estimated at around 61%, by the conclusion of September 2009. This is in contrast to 59% for the predictable peer group (See chart 4) above. Such a holding is usually at around 10% to 20% of the entire investments in complicated regulatory systems. Increased investment risk spotlight is a crucial problem in the current time compared to the newly reputable Takaful operations (Atiqah, 14). We predict asset profiles to alter extensively in the future. This is in reaction to the approval of more intricate ruling with capital prerequisites founded on both asset risk exposures and insurance counterpart exposures.
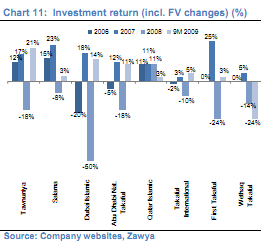
The asset performance was very unpredictable, exhibiting the increased focus on real estate and local equities. Roughly, all participants with the exception of Qatar Islamic Insurance Co earned profits in the initial nine months of 2009 and suffered losses in 2008. This adhered to the course of the entire equity market. The standard investment outcome (with the inclusion of the fair value variations) in 2009 was 4.5%, compared to the negative outcome of 16.3% in 2008 (See chart 5) below. A number of the profits in 2009 vanished in the final four months due to the latest market fluctuations after the standstill announcement of the Dubai World debt.
Revaluation Of Losses And Gains On The Income Statement
In conclusion, the asset piece summarized involves revaluation of losses and gains taken straightforwardly to equity. A number of insurers have selected definite investments as ‘available-for-sale.’ This implies that the revaluation of losses and gains on the same investments are not exhibited in the P&L statement, but are in use directly to equity. A Mudaraba levy is usually based exclusively on the losses and gains displayed on the P&L statement. This implies that there can be a disconnection involving the asset of the members’ fund and the charges on the Mudarib (Alpen Capital, 16). Evidently, the impact of the principles for Takaful and Re-Takaful companies is noteworthy. As illustrated in this work, it is the same principles that led to the growth of the firms.
References
Alpen Capital. GCC Takaful Industry. 2010. Web.
Atiqah, Asha. History, Progress and Future Challenges of Islamic Insurance (Takaful) In Malaysia. 2010. Web.
Bhatty, Ajmal. The Growing Importance of Takaful Insurance. 2010. Web.
Ernst&Young. Industry Growth and Preparing for Regulatory Change. 2012. Web.
Islamic Finance News. The Takaful and Re-Takaful Industry. 2010. Web.
Zawya. Takaful and Re-Takaful Leaders Lauded at London Gathering. 2011.Web.