Introduction to the country
The United Arab Emirates established in 1971 when the United Kingdom withdrew military forces from this area (Library of Congress 2 and Global Investment House 3). The UAE is located in the Arabian Gulf and it is the federation of seven emirates (Shihab 1; BTI 3 and Library of Congress 1). However, the political and economic position of this country was not in stable position at the initial stage of independence, but the policy maker used their natural resources properly, which changed the overall economic position and life style of the people (World Economic Forum 3 and Ministry of Economy 16). However, BTI provided key indicators for the present year –

Population pyramid dynamics
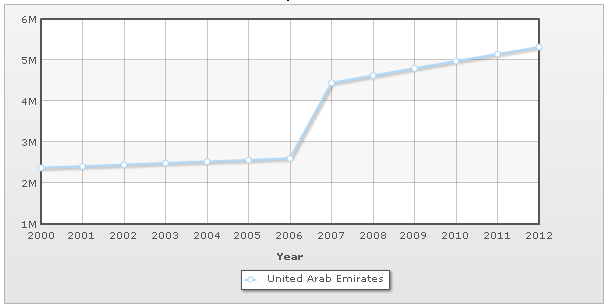
According to the report of Ministry of Economy (17), more than 75% population is falling between 15 and 64 years of age; however, the following table gives more information –
Table 1: Population pyramid dynamics. Source: Self generated.
Physical geography
Table 2: physical geography. Source: Self generated from Library of Congress (5).
Economy the UAE
Library of Congress (8) reported that pearling, fishing, and agriculture were the traditional source of income; however, this country first discovered and exported oil in 1972, which generated more than 25% of total GDP. On the other hand, the UAE is the active member of WTO and introduced the concept of free trade zone for the foreign entrepreneurs; therefore, it becomes easy for the government to increase private sector involvement and to get more investors to transform the economy from least developed country to a modern state (Ministry of Economy 23; and BTI 8). At the same time, the government entered in the Trade and Investment Framework Agreement to provide 100% foreign ownership and zero taxes; in addition, it was the prime goal of the policy maker to create strategic plan concentrating on economic diversification, education, and private segment.
Performance of Different Segments
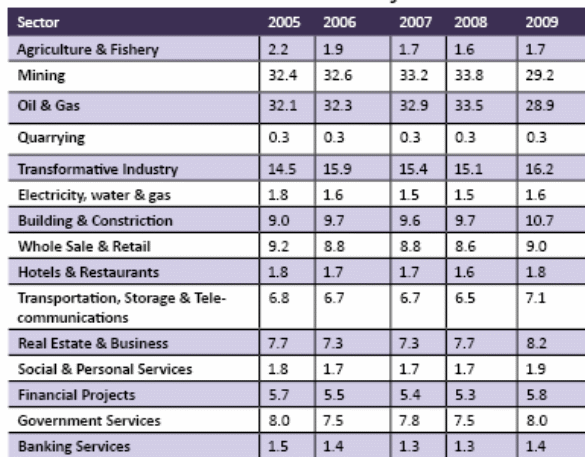
- Hydrocarbon sector: Most significant source of the national GDP; therefore, the following figures give more information about this sector –
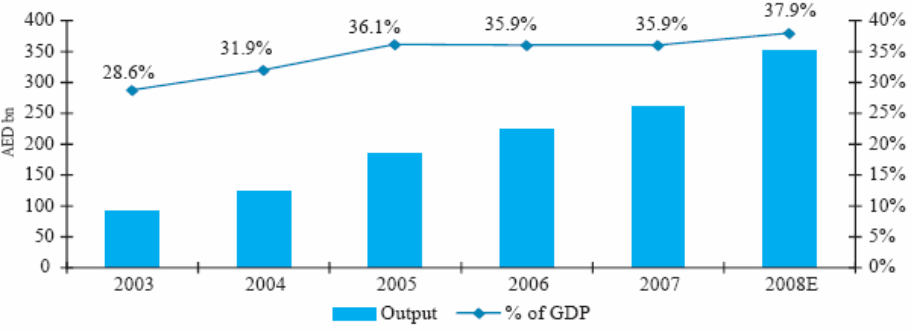
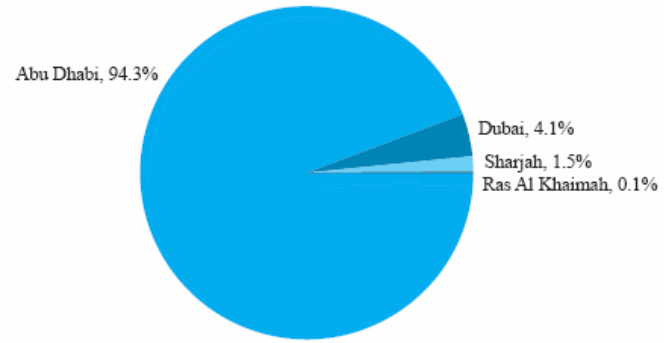
Source: Global Investment House (36)
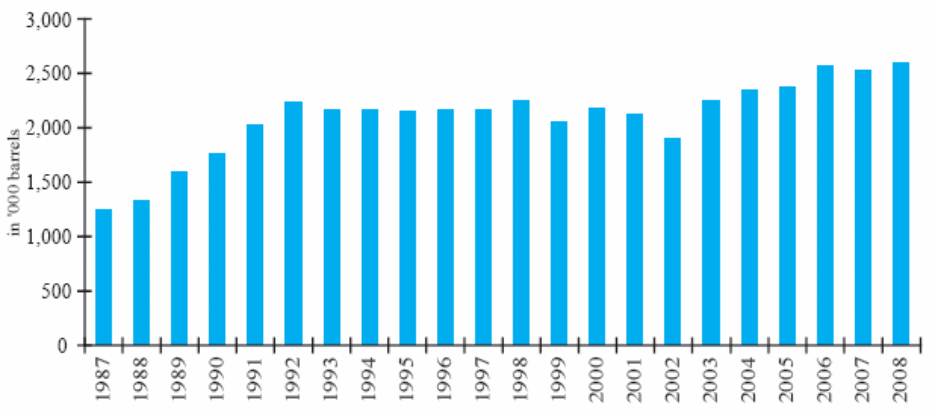
Source: Global Investment House (37)
- Manufacturing sector: This segment develops rapidly due to the government initiatives to decrease dependence on the hydrocarbon sector –
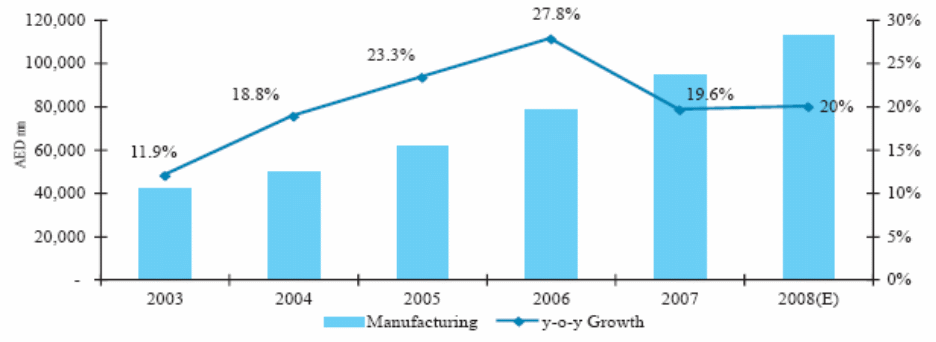
Source: Global Investment House (64)
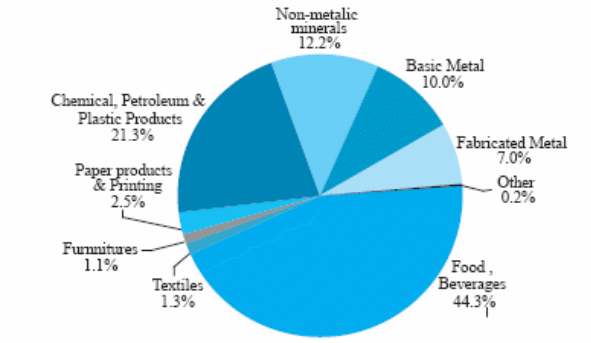
Source: Global Investment House (64)
- Banking and Insurance Service:

Source: Global Investment House (68)
Labour Force
Available expatriates helped the nation to develop the economic position; however, the following chart shows that 80.7% of the total employees are expatriates –
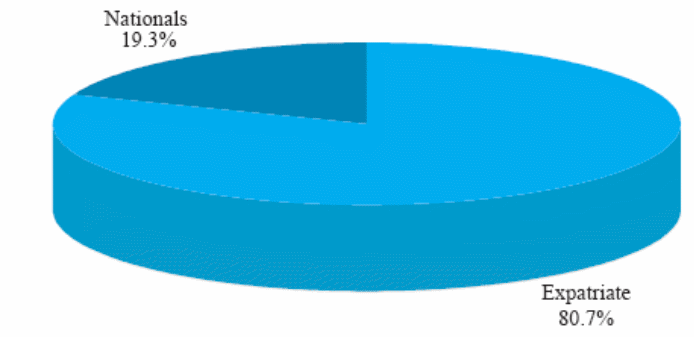
Source: Global Investment House (29)
Foreign trade
KAMCO Research (43) reported India, China, the United States, and Iran have significant role in the national economy; as a result, the government and the other policy makers of this country should maintain strengthen its ties with the main trade partners with intent to reduce pressure on oil segment and diversify its economy and to explore areas of economic cooperation.
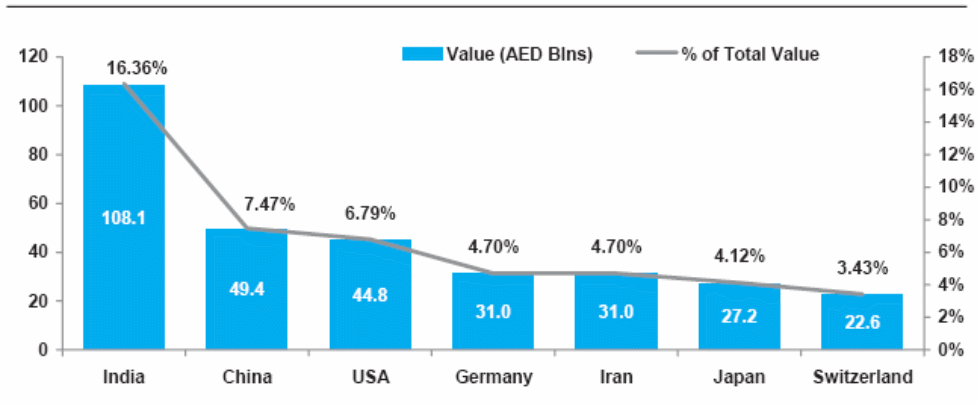
Source: KAMCO Research (43)
Foreign Direct Investment
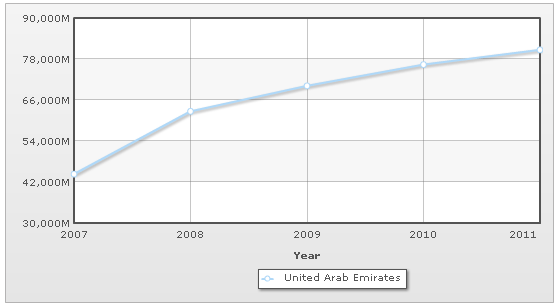
Source: Indexmundi: Country Profile of the UAE
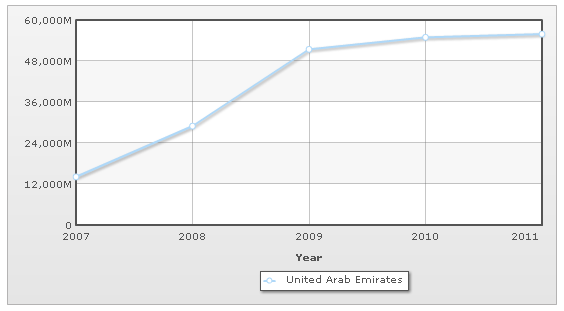
Source: Indexmundi: Country Profile of the UAE.
Economic Data of (1991 – 2000)
Shihab (1) stated that the UAE was one of the least developed nations of the globe in 1970s, but it achieved strength to compete with industrialized nations within the next two decades; however, exploitation of oil industry due to have both offshore and onshore oil reserve (third largest oil reserves) opened a new path to explore national economy. However, Shihab (2) argued that it had 98.80 billion barrels proven oil reserves and daily capacity of oil production increased up to 2.0 million barrels within the year 2000; in addition, the UAE has the fourth largest reserves of natural gas (6 trillion cubic metres gas reserves) and it had capacity to produce about 2940.0 million cubic feet per day. On the other hand, the exploitation of minerals, such as, limestone, sand, marl, and soils helped to advance construction and infrastructure development projects; therefore, the UAE has experienced rapid economic growth and the researchers have pointed out that this country would be able to hold such growth for the future because of availability of natural resources (Shihab 2).
Library of Congress (15) and MOIA (6) expressed that agricultural, forestry, and fishing sectors had not played any significant role in national economy because of adverse climatic conditions and lack of cultivatable lands, for instance, these segments only contributed 3.9% and 3% of the GDP in 1999 and 2005 accordingly. However, the government has taken many long-term agricultural development programs in order to increase the cultivatable land, such as, they allotted lands, technical services and equipment to the people at free of costs and they provided other materials like fertilizers, seeds, and insecticides at half cost (Shihab 5).
The UAE was able to gain quick growth in spite of political and social barriers, such as, insufficient number of population was the main problem to exploit natural resources, so, it was essential to allow huge inward migration of expatriates; as a result, more than 75% of the total labour force were the citizen of neighbouring countries (Shihab 3). At the same time, composition of labour force with different cultural background and age group increased dependence on foreign employees to shape the national economy; however, the UAE had removed the problem of limited workforce from the beginning of 1990s as two-tier labour market helped to produce more oil and non-oil based products (Library of Congress 15 and Shihab 3). On the other hand, unemployment rate
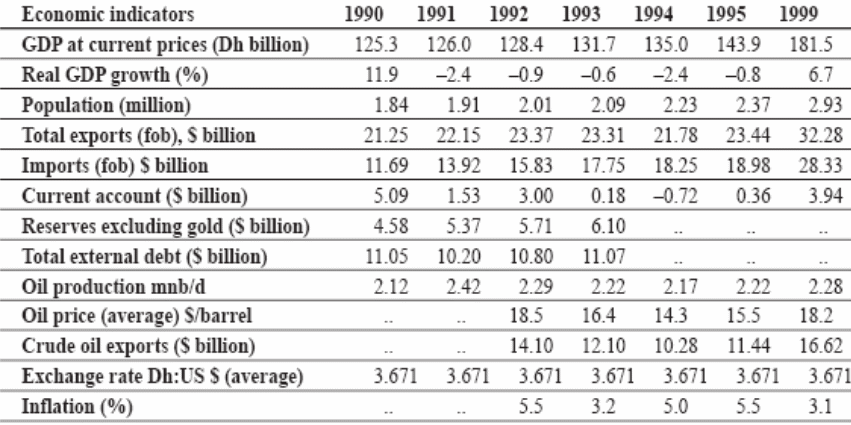
Source: Shihab (4).
Highlights of the Era (1991 – 2000)
Exports from the UAE
The subsequent table represents that earning from exports increased very slowly for instance –
Table 3: – Total exports from 1990 to 1999. Source: Self generated from Shihab (4)
Imports from the UAE
The following table represents that expense to imports amplified slightly, such as-
Table 4: – Total imports from 1990 to 1999. Source: Self generated from Shihab (4).
Trade Balance
Table 5: Trade balance. Source: Self generated.
Inflation rate
According to the data of Indexmundi: Country Profile of the UAE (par 1), inflation rate of the UAE had settled down from 1996 and it was comparatively higher from the year 1991 to 1995; however, the following table provides the data of inflation rate for ten years –
Table 6: Inflation rate of the UAE for the year 1990 to 2000. Source: Indexmundi: Country Profile of the UAE (1).
Unemployment Rate
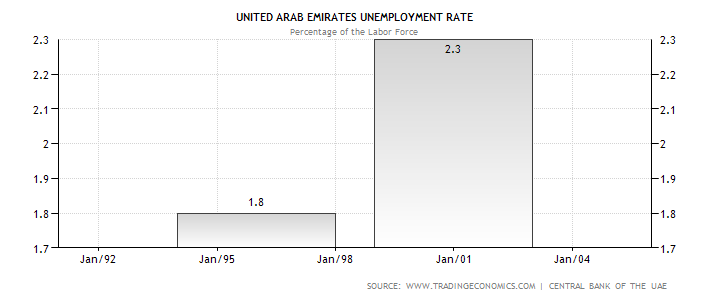
In accordance with the data of Trading Economics (1), unemployment rate had increased very slowly from 1994, for example, this rate was about 1.8% in 1992 to 1995, but it increased 2.3% by the fiscal year 2000; however, the following figure demonstrates this rate –
Source: Trading Economics (1).
Economic Data of (2001-2007)
Highlights of the Era (2001-2007)
Exports from the UAE
Global Investment House (4) stated that the main source of government exports revenue is oil and gas sectors of the UAE (total revenue increased by 13.7% in 2007) because the price of oil was too high from 2006 to 2007; in addition, it was possible for the administration to generate about 15% of the national GDP only from oil sector. At the same time, Global Investment House (4) argued that external environment was suitable in 2007 for the exporters of all sectors including goods and service providers, which enhanced national economy, for example, export revenue increase by $91.10 billion within six years. However, the subsequent table has presented data about the earnings from export sectors –
Table 7: – Total exports from 2001 to 2007.
Source: – Self generated from Indexmundi: Total exports from the UAE (1).
Imports
However, the subsequent table has presented data about the import sectors –
Table 8: – Total Imports from 2001 to 2007.
Source: – Self generated from Indexmundi: Total imports to the UAE (1).
According to the report of Library of Congress (15), main import items were machinery and electronic tools, valuable stones along with metals, and vehicles; however, Global Investment House (4) mentioned that the government increased budget gradually in order to import goods.
Trade Balance
Table 9: Trade balance.
Source: Self generated.
Source: generated from CWCGULF (2).
Source: CWCGULF (2).

Source: Global Investment House (67).
Inflation rate
KAMCO Research (44) stated that the inflation rate was increasing from the begging of 2001 and it had continued for the seven years; as a result, the price of raw materials, food items, house rent, and other essential equipment became high at that period. At the same time, Indexmundi (1) represented data related with inflation rate, for example, this rate was about 11.13% in 2007, but this rate was only 2.8% in 2001, which explained that this rate had increased dramatically about 8.33% within five years; furthermore, the following table shows the data –
Table 10: Inflation rate of the UAE for the year 2001 to 2007.
Source: Indexmundi: Country Profile of the UAE (1).
Unemployment Rate
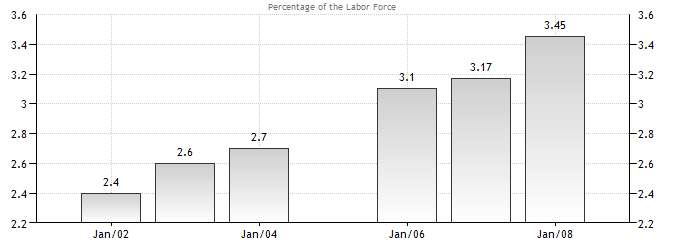
Consistent with the data of Trading Economics (1), unemployment rate is increasing slowly from 2008, for instance, this rate was 4.3% in 2011 and 4.6% in 2012; however, the following figure shows this rate:
Source: Trading Economics (1).
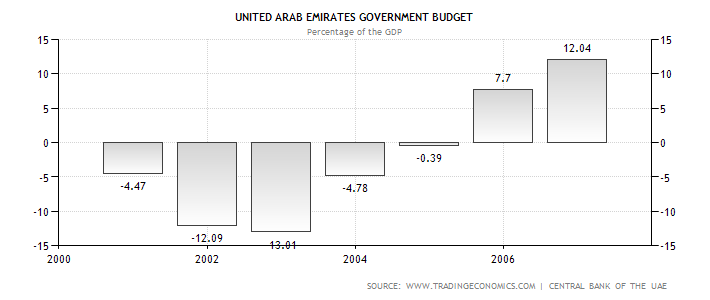
Budget surplus (+) or deficit (-)
Baumol and Alan (102) stated that a budget surplus demonstrates positive figure where revenues exceeded expenditures; on the other hand, Robbins and Coulter (17) and Stoner, Freeman and Gilbert (65) argued that budge deficit shows negative figure.
Table 11: Budget surplus or deficit.
Source: Global Investment House (7).
Source: Trading Economics: United Arab Emirates Government Budget (1).
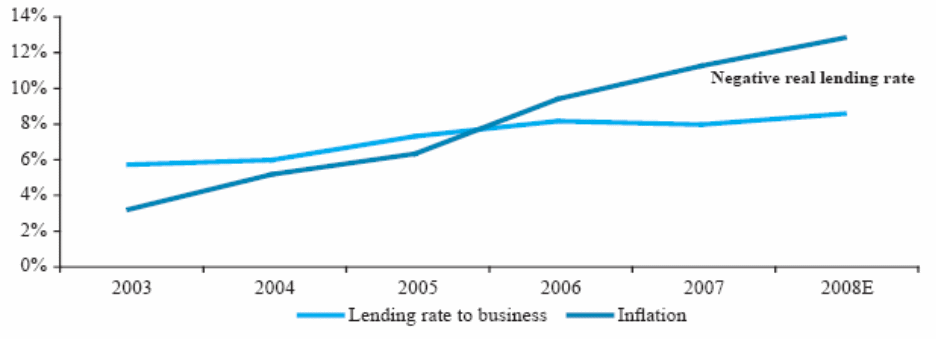
Interest rate
Source: Global Investment House (26).
Economic Data of (2008-2012)
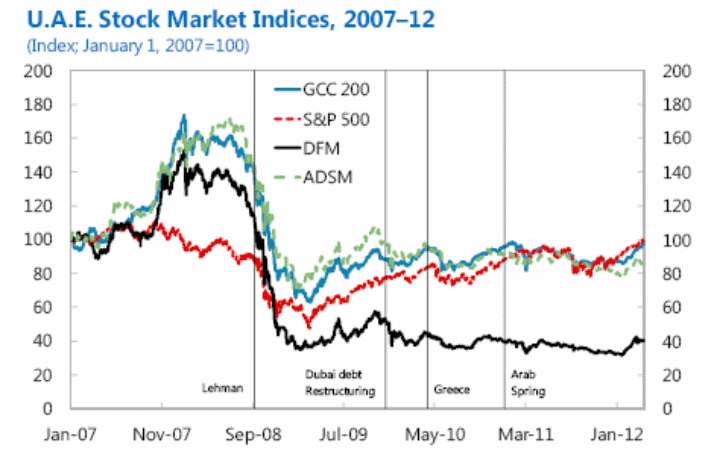
IMF (2) stated that financial system all over the world including the UAE have experienced extraordinary vulnerability due to economic downturn, for instance, underwent reversals of tentative capital inflows had squeezed liquidity conditions along with exaggerated investor confidence; in addition, financial crisis influenced equity market. According to the report of Khedhiri and Muhammad (7) and Orozco (6), volatility in the stock markets amplified after the global economic crisis though this position changed and settled down from the last quarter of the fiscal year 2011; however, the following figure gives more information in this aspect –
Source: IMF (6).
Highlights of the Era (2008-2012)
Budget surplus (+) or deficit (-)
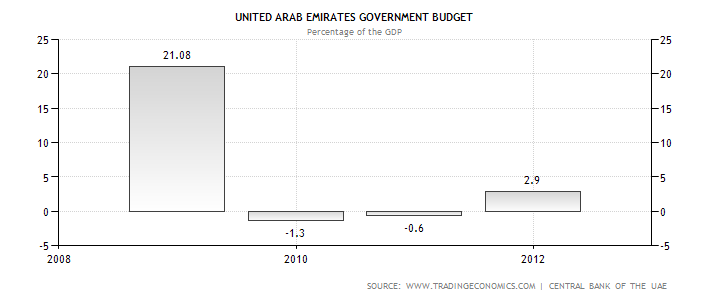
The estimated budget surplus is 2.9% in 2012 and budget deficit was 0.6% in 2011 (“Trading Economics: United Arab Emirates Government Budget” par.1). on the other hand, according to the report of Ministry of Economy (1) and Investment Department (2), the estimated budget surplus was 5% of the GDP in 2011; however, it provided data about the fiscal year 2009 and 2010 –
Table 12: Budget surplus or deficit.
Source: Ministry of Economy (13).
Source: Trading Economics: United Arab Emirates Government Budget (1).
Inflation rate
KAMCO Research (44) reported that UAE had to face the adverse economic position in 2008 due to oil price reduction in global financial crisis; therefore, inflation rate was one of the prime factors to hike the price of the houses and other products. However, Indexmundi: Country Profile of the UAE (par 1) reported that inflation rate of 2008 was 12.25%, but this rate decreased dramatically over time, for instance, it was only 0.9% in the fiscal year 2010 and 2011 accordingly; however, the following table shows the data –
Table 13: Inflation rate of the UAE for the year 2008 to 2011
Source: Self generated
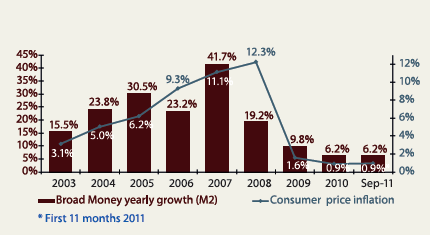
Source: Bank Audi (12).
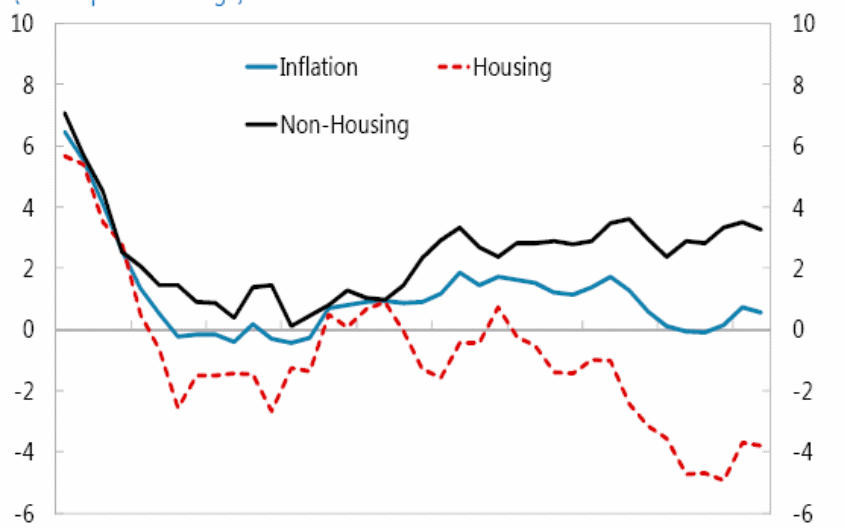
Source: IMF Country Report (6).
According to the IMF Country Report (4), the price of housing and non-housing had decreased from the last quarter of 2008 and it would be difficult to finish the projects due to the large supply overhang.
Unemployment Rate
According to the data of Trading Economics (1), unemployment rate is increasing slowly from 2008, for instance, this rate was 4.3% in 2011 and 4.6% in 2012; however, the following figure shows this rate –
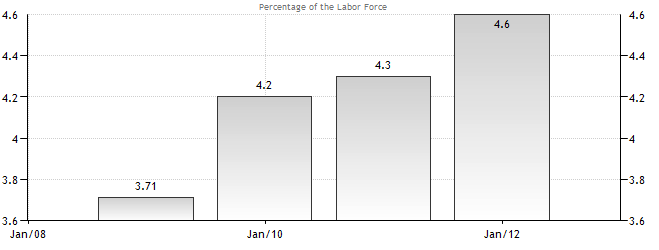
Source: Trading Economics: Unemployment Rate of the UAE (1).
Interest rate
In 2008, interest rate of this country was more than 4.65 while central bank recorded the benchmark interest rate by only 1% from 2009 to 2012 (“Trading Economics: Interest Rate of the UAE” par. 1); however, the following figure shows interest rate –
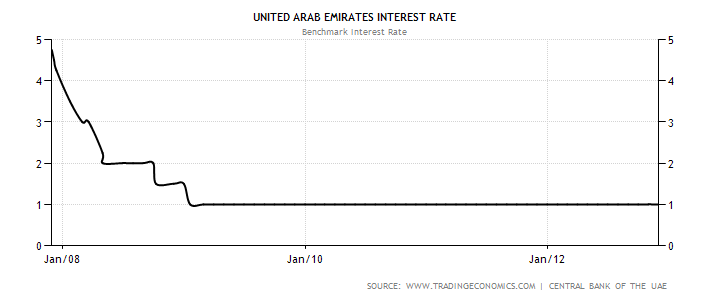
Source: Trading Economics: Interest Rate of the UAE (1).
Performance of Different Sectors in Recessionary Economy
Global Investment House (68) stated that UAE economy had faced worst position in 2008 when all the business segments have shown negative performance; in addition, it also mentioned that service collapsed by 64.50% in 2008; however, following table gives more information –
Table 14: Up and down of the performance of different sector.
Source: Self generated from Global Investment House (68).
Exports from the UAE
The following table has presented data about the earnings from export sectors –
Table 4: – Total exports (Year by Year).
Source: – Self generated from Indexmundi: Total exports from the UAE (1).
According to the Global Investment House (5) and Library of Congress (15), major successful export items were oil, natural gas, petroleum, crude oil 45%, and other export items. At the same time, Library of Congress (15) stated that Japan was one of the main destinations of the UAE exports in 2005; however, other export partners are –
Table 15: Exports partners. Source: Indexmundi: UAE Exports – partners (1).
Imports
The next table has represented data about the earnings from import sectors –
Table 16: – Total Imports from 2008 to 2012. Source: – Self generated from Indexmundi: Total imports to the UAE (1).
Library of Congress (15) reported that India and China were of the main sources of the UAE imports; however, other import partners are –
Table 17: Imports partners. Source: IndexMundi: Total exports from the UAE.
Trade Balance
Table 18: Trade balance. Source: Self generated.
Comparative Benchmarks (other GCC countries)
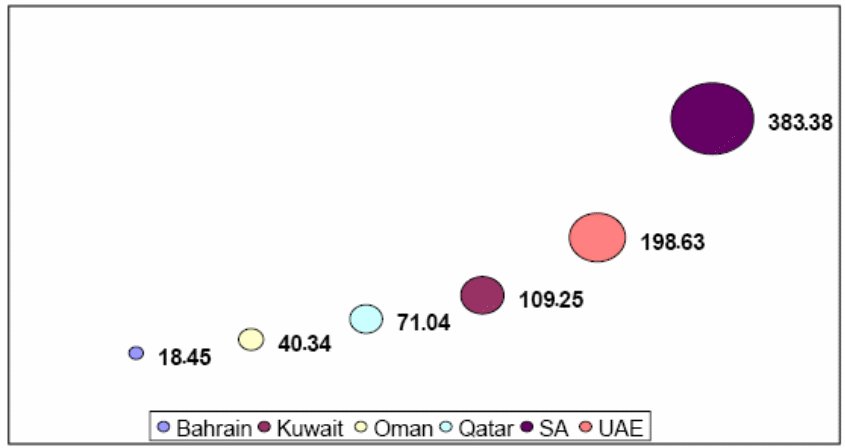
AlKholifey and Ali (4) stated that incorporation and inter-connection among the member states in all sectors helped GCC countries to achieve strong economic position and the members had tried to coordinate monetary policy and issue common Gulf currency; as a result, GCC member states had a combined GDP of US$ 821.0 billion.
Source: AlKholifey and Ali (4).
AlKholifey and Ali (4) provided data to compare GDP growth rate of the GCC countries for the last four decades, which demonstrate that the growth rate was too slow in 1980s and the position of 1970s was completely different; however, Qatar generated the highest average GDP growth while the UAE earned 15.7% and the subsequent figure shows more information –

Source: AlKholifey and Ali (4).
On the other hand, Al-Ghorairi (104) stated that stock market of Qatar is comparatively small and the features of the markets showed that Saudi Arabia’s market is the most successful market considering value traded and market capitalism.

Source: Al-Ghorairi (104).
Al-Ghorairi (104) argued that overall economic position of the GCC countries have played significant role in order to attract investment; in addition, size of the markets, monetary policies, and initiatives for the diversification of the economy encourage the companies to maintain standards of the listing rules; however, banking, insurance, industry and services are four main sectors of the listed companies. In addition, Al-Ghorairi (104) stated that stock market of KSA is the greatest market in this zone, but it has only 135 listed corporations where some specific company control particular segment; in this context, many researchers have recommended the governments to patronize and restructure private companies to develop the stock market in the future. Most significantly, the economic growths along with position of the companies in the stock markets have correlation with each other, for example, GCC countries have facilitated due to the higher oil prices in the past fiscal years and from 2002 to 2004, total market capitalization amplified more than 227% (from $163.0 to $533.70) by 2004.
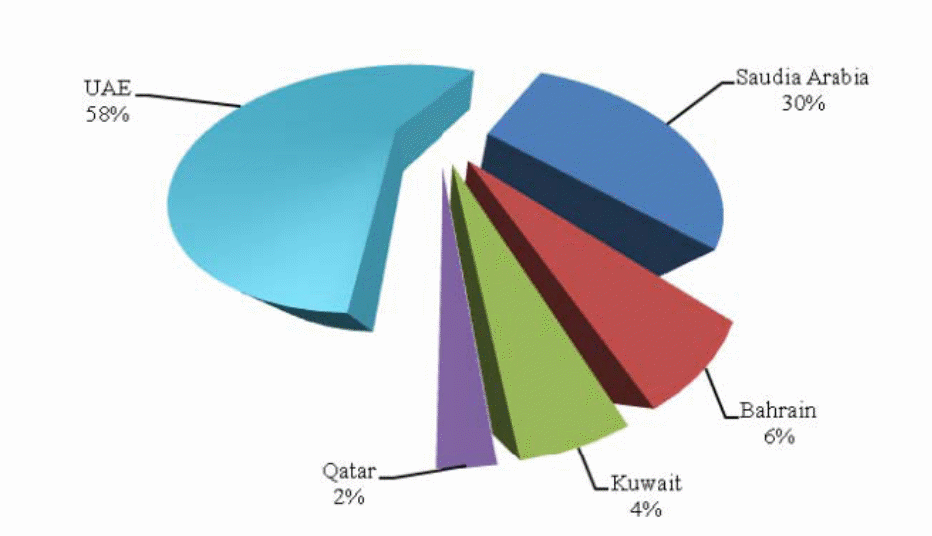
Al-Ghorairi (104) further stated that Islamic bonds known as sukuk played significant role for the development of the insurance sector because growth rates were astonishing and led to ever-increasing issuance like 275% in 2005, 67% in 2006 and 36% in 2007; in addition, this bond become popular in the global market; however, the following figure shows that –
Source: Al-Ghorairi (122).
Al-Yousif (12) provided some data related with GCC economy for the year 2002 –
Table 19: Some Socio-economic Indicators for the GCC member.
Source: Self generated from Al-Yousif (12).

Source: AlKholifey and Ali (4).
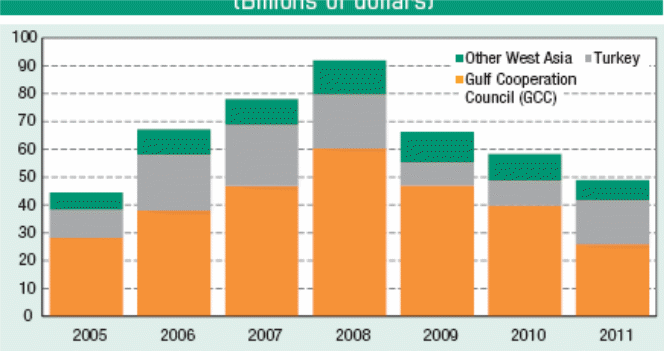
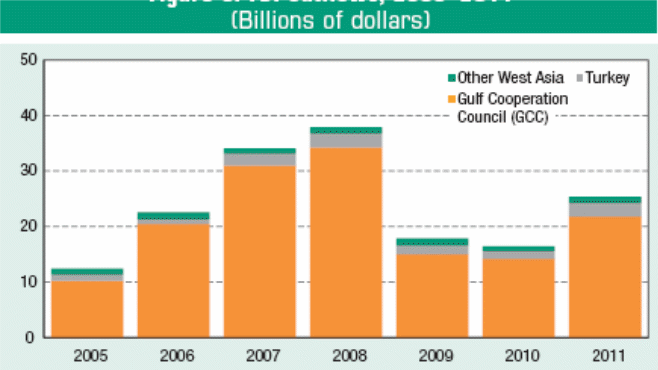
United Nations (81) stated high political risks and obstructions were the important factors to increase FDI inflows and the GCC countries had faced severe challenges to implement large projects; in addition, United Nations compared the economic position among the West Asian countries with GCC members, such as, FDI inflows and FDI outflows.
Source: United Nations (82).
Source: United Nations (82).
Comparative Benchmarks outside GCC
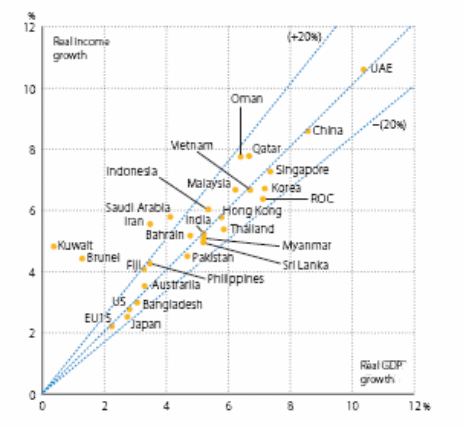
Source: APO (129).
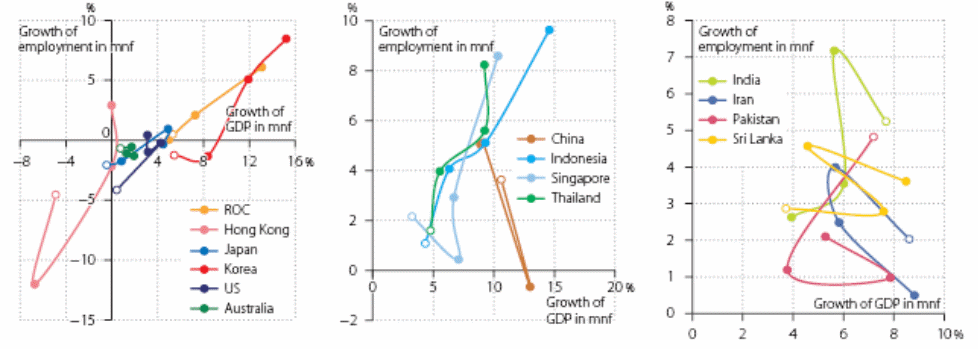
Source: APO (105).
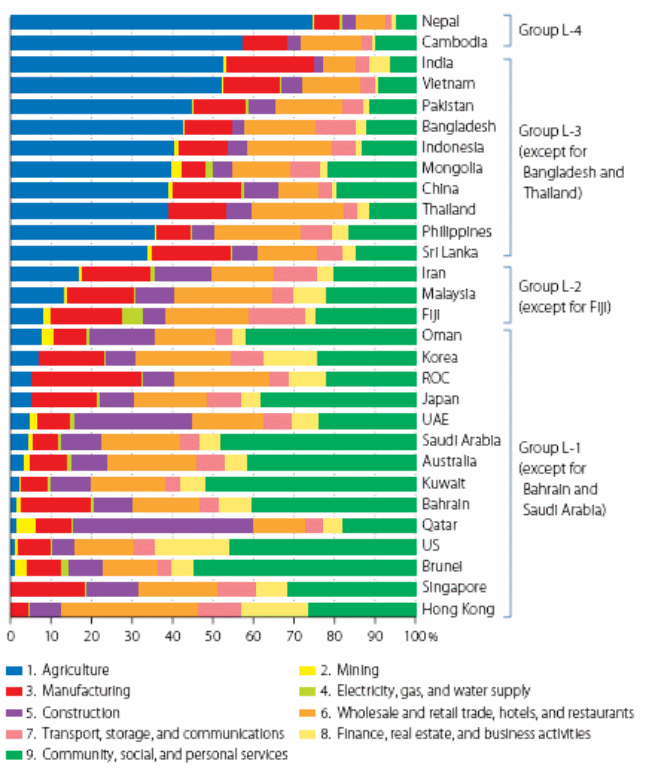
Source: APO (105).
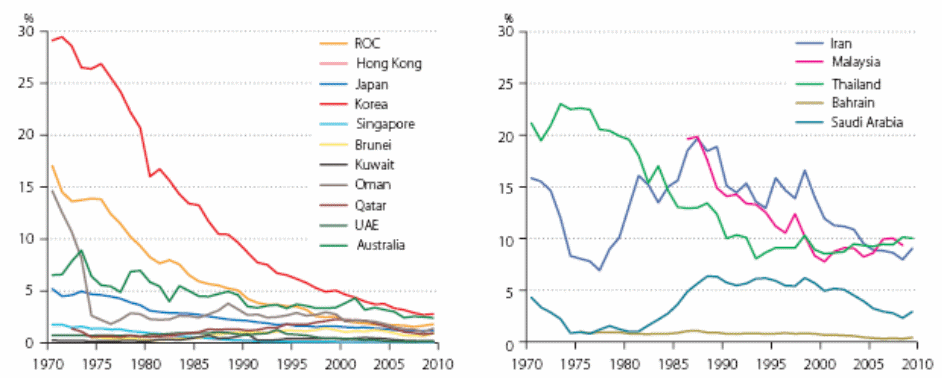
Source: APO (107).
Central Bank of the UAE (CBU)
Hashmi (1) stated that CBU established in 1980 in accordance with the provisions of Federal Law and it was accountable to perform the task of Currency Board; however, the purpose of this bank was to regulate other banks and institutions and register as a shareholding company, and to recommend the policy maker regarding monetary and financial aspects. The prime obligation of CBU was to maintain gold and foreign currency reserves, credit controls by sale and buy of certificates of deposits, formulate credit policy, supervise the financial segment, control interest rates, uphold capital to risk-weighted assets ratio, incorporate banks as per the regulation and take measure according to the International Accounting Standards (IAS) and so on (Hashmi 1).
Moreover, IMF (16) reported that CBU strongly scrutinize the liquidity of individual banks and persuade them to proactively control the liquidity risks to protect the country from financial crisis in the future because banks have amplified their liabilities to overseas banks though overall the banking system is in under control and have minimal risk to face serious problems like 2008. IMF (16) further addressed that CBU have concentrated more on the regulation in order to manage banking system because it took lesson from the global financial crisis of the fiscal year 2008; in addition, it reinforces the economy’s resilience to external shocks and would like to guarantee enhanced returns on the Central Bank’s foreign currency reserves along with reduce risks. However, CBU have already passed the budget for the next year; however, the board members checked this budget before attempt to take any action in this regard, such as, report of the Assistant Governor, monetary and fiscal policy, submitted applications of the banks and other financial institutions, general prudential ratios, economic stability, previous record of bank performance and liquidity position.
Hatoum (1) stated that capital outflows increased by $26 billion in 2011, which reflected higher overseas investments in order to implement large projects, for instance, there are some oil and petroleum companies would like to invest more to execute diversification and brand extension strategies. However, central bank the UAE experiences about 4.0% growth at the present year according to the report of IMF and Financial Stability Review of the Bank; in addition, GDP at constant prices reduced by 4.8% though inflation remains reasonable, expected non-oil growth near 4.0%, and non-performing loans increases slightly (John 1).
Outlook for the future
World Economic Forum (17) stated that the administration of the UAE has already taken some fruitful measures to develop all sectors and to execute its long-term economic vision, such as, it would take the advantages of globalization to develop industrial sectors, and use natural resources properly, try to develop the activities of foreign to reduce political conflict and enhance collaboration. World Economic Forum (35) further expressed that it is significant to enter some treaty and develop the performance of the GCC’s security; however, the following figure shows that trade and industry segment would observe the highest success in the future –
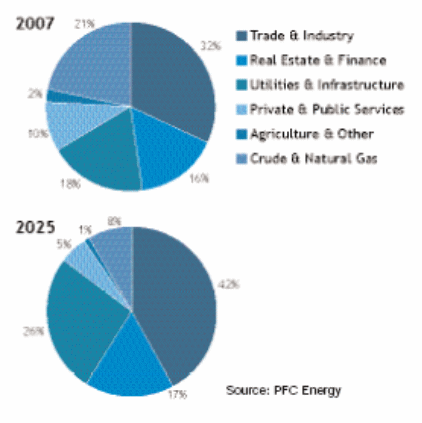
Source: – World Economic Forum (35).
The Government of Abu Dhabi (8) settled the vision 2030 and give highest priority to empower private sector to develop the state; in addition, it focused more on the knowledge-based economy, economic diversification, human resources development, and infrastructure development, higher-value employment opportunities, and enhance the business environment. The government is committed to reduce GDP volatility, enhance competitiveness, adopt a disciplined fiscal policy, enhance federal-local cooperation, increase transparency, facilitate the investment procedure, optimize government spending, and stimulate faster economic growth; however, the following figure shows vision 2030 –
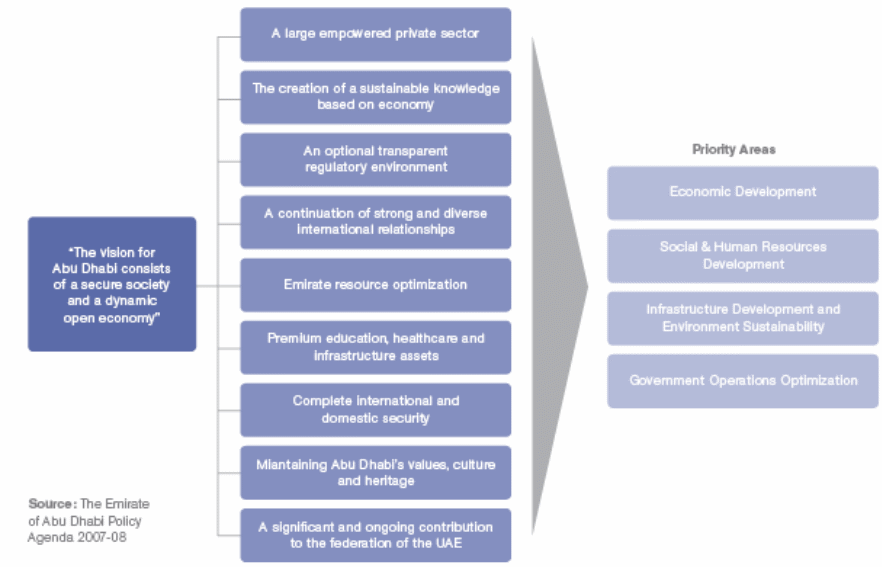
Source: – The Government of Abu Dhabi (8).
Abu Dhabi the world’s sixth biggest proven oil reserves, crude oil has ever-stronger demand and overall economic growth of the UAE is accelerating as a member of OPEC; so, the Government of Abu Dhabi expected that they would be able to build sustainable and stable economy; however, estimated real GDP of the UAE –
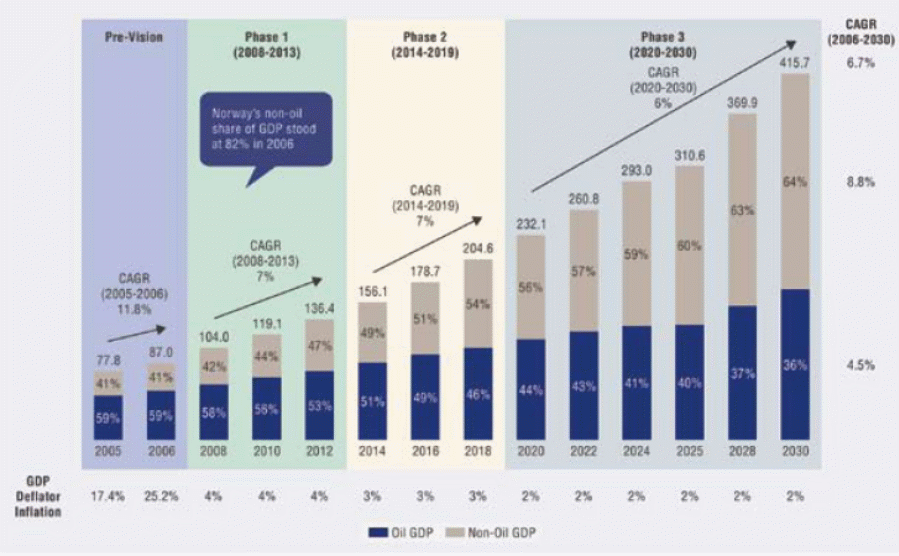
Source: – The Government of Abu Dhabi (13).
Some other initiates those play vital role for the future development are –
- Development the concept of free zones derive from WTO; however, the UAE has already allowed 100% foreign owned companies avoiding the guidance of the gulf council to increase FDI inflow, create new job opportunities, develop infrastructure, improve technology in the industrial sectors, and so on (Shimy 5);
- Initiatives to increase women labour force as part of the human resource development program;
Observations
- Insurance market: World Economic Forum (71) expressed that GCC Insurance market grew from $7.20 to $14.20 billion in the last 5 years and expected to grow by 200% (about $3.10 to more than $7); therefore, the UAE have focused on this profitable sector and hold its number one position in the competitive market;
- Agricultural Sector: Agricultural and fishing sectors had no significant contribution in national economy; in addition, it has no fish-processing industry and pearl industry had tradition significance, which was traditional due to the development of cultured pearls;
- Hydrocarbons Sector: The national economy is highly based on the oil and gas since these are the main natural resources and sixth largest reserves; however, the revenue increased day-by-day, for example, it recorded an increase of 16.80% in 2007 (Global Investment House 17). Here it is important to mention that oil and gas both are finite resources and oil price controls the economy; in this context, it is important to concentrate on the proper resource management to reduce on oil segment; in addition, in 2008, oil prices have experienced downward pressure, which adversely affected overall economy; at the same time, it should use the resources considering the next generation;
- Construction and Real Estate: it is an active and dynamic sector for the people of this country; however, the development and management of this sector are quite sustainable;
Suggestions to improve the economic performance
- Updating listing rules and the corporate governance structure would help to improve transparency and reduce unethical practice related with earning management and labour relationship;
- The government should encourage knowledge-based economy by giving priority on the Information and communications technology as well as the educational sector of the UAE;
- It is essential to develop advance labour management framework for the expatriates while more than 90% of the employees (most of them are unskilled labour) come from foreign countries. In addition, it needs to provide more facilities to the female workers to encourage them to contribute the development of the nation;
- It is significant to have stable political situation along with sound leadership to become successful nation in the world;
- In addition, the policy makers of the UAE should consider short-term economic development strategy and create in-depth economic plans because it will give prompt response;
- The government should work to maximize productivity and competitiveness, and take the opportunity of massive expansion in the life insurance market;
- Furthermore, it should require to upgrading physical and financial elements, asset formation, and national labour force;
Conclusion
From the above-mentioned data, it can be said that the UAE is really a wealthy nation and the economy of this country is in stable position; however, this report focuses on the exports, imports, trade balance, trade partners, budget surpluses, and GDP growth rate for three different periods in order to discuss the economy of the UAE.
Works Cited
Al-Ghorairi, Abdulaziz. The Development of the Financial Sector of Qatar and its Contribution to Economic Diversification. 2011. Web.
AlKholifey, Ahmed and Ali Alreshan. GCC Monetary Union. 2011. Web.
Al-Yousif, Yousif Khalifa. Oil Economies and Globalization: The Case of the GCC Countries. 2011. Web.
APO. APO Productivity Databook. 2012. Web.
Bank Audi. UAE Economic Report. 2011. Web.
Baumol, William. & Alan Blinder. Economics: Principles and Policy. South-Western College Pub. 2008. Print.
BTI. United Arab Emirates Country Report. 2012. Web.
CWCGULF. Economic Development: United Arab Emirates Yearbook. 2004. Web.
Global Investment House. UAE Economic & Strategic Outlook. 2009. Web.
Hashmi, Anaam. “An Analysis of the United Arab Emirates Banking Sector”. International Business & Economics Research Journal. 2007. Web.
Hatoum, Leila. UAE Central Bank Data Indicate Investment Jump By Sovereign Funds. 2012. Web.
IMF Country Report. United Arab Emirates 2012 Article IV Consultation. 2012. Web.
IMF. United Arab Emirates: Selected Issues and Statistical Appendix. 2012. Web.
Indexmundi: Country Profile of the UAE. 2012. Web.
Indexmundi: Population Chart of the UAE. 2012. Web.
IndexMundi: Total exports from the UAE. 2012. Web.
Indexmundi: Total imports to the UAE. 2012. Web.
Indexmundi: UAE Exports – partners. 2012. Web.
Investment Department. Investor’s Guide To The UAE. 2011. Web.
John, Issac. Central bank sees 4% growth. 2012. Web.
KAMCO Research. United Arab Emirates (UAE): Economic Brief and Outlook 2011. 2011. Web.
Khedhiri, Sami and Muhammad Naeem. “Empirical Analysis of the UAE Stock Market Volatility.” International Research Journal of Finance and Economics Issue, 15 (2008). Web.
Library of Congress. Country Profile 2008 of United Arab Emirates. 2007. Web.
Ministry of Economy. Annual Economic Report 2011. 2011. Web.
MOIA. UAE: Country Brief with reference with its people. 2010. Web.
Orozco, Olivia. Impact of the Global Economic Crisis in Arab Countries: A First Assessment. 2009. Web.
Robbins, Stephen and Coulter, Mary. Management. New Delhi: Prentice Hall, 2003. Print.
Shihab, Mohamed. Economic Development in the UAE. 2012. Web.
Shimy, Nermine. From Free Zones to Special Economic Zones – The UAE Case Study.2008. Web.
Stoner, Finch, Freeman Edward. & Gilbert Daniel. Management. Delhi: Prentice-Hall, 2003. Print.
The Government of Abu Dhabi. The Abu Dhabi: Economic Vision 2030. 2008. Web.
Trading Economics: Interest Rate of the UAE. 2012. Web.
Trading Economics: Unemployment Rate of the UAE. 2012. Web.
Trading Economics: United Arab Emirates Government Budget. 2012. Web.
United Nations. World Investment Report 2012: ii Towards a New Generation of Investment Policies. 2012. Web.
World Economic Forum. The United Arab Emirates and the World: Scenarios to 2025. 2012. Web.