Summary
Why did we perform this experiment?
The aim of this experiment is to ascertain that when three non-parallel forces are in equilibrium, their magnitudes can be derived from the directions of their lines of actions using triangle of forces method or by parallelogram of forces method provided that one of the forces is known. This can either be obtained by scale drawing or by calculations.
How did we approach / accomplish this experiment?
This experiment was accomplished using three different weights attached to cords meeting at a point on a diagram board placed perpendicularly to the ground. The cords were set to pass over frictionless pulleys to let the masses suspend under the influence of gravity. One of the weights was set to a slight disturbance and the cords were traced on a sheet after attainment of equilibrium.
What are the results of this experiment?
From the experiment, it can be concluded that using triangle of forces method the results obtained by scale drawing concurs to a greater extend with the calculation method. The slight deviations could be due to accuracies in measurements. The length of cord a-b is equal to 3.2 cm, cord b-c is equal to 1.6 cm and cord a-c is equal to 2.8 cm. With respect to parallelogram of forces method, the resultant force is equivalent to 2.3 N.
Experimental Objective
One of the objectives of this experiment is to ascertain that when you have three non-parallel forces at equilibrium, one can obtain the magnitudes of any given two forces using triangle of forces method provided that the third force, directions or their lines of actions are known.
The other objective of this experiment is to affirm that in deed when three non-parallel forces in the same plane are at equilibrium, their lines of actions meet at a point, and thus the resultant (R) magnitude of the force due to the duo forces is resolved using parallelogram of forces method.
Theoretical Background
A body is deemed to be stationary when several non-parallel forces acting on it are at equilibrium. This is so because the resultant force acting on the body is zero. It can be deduced that if these forces are taken as vector quantities and then summed up, they enclose a region. This region is in the form of a polygon. Borne with this idea in mind, one is in a good position to tell the magnitude of either one or more unknown forces because it must be the vector which completes the polygon to form a region (Trautwine 14). To aid one in coming up with a polygon, ‘Bow’s notation’ comes in handy. Furthermore, Bow’s notation guides one on how to label the polygon. With respect to Bow’s notation on trio forces acting at a point, on extrapolating their lines of action they form a triangle of forces (Trautwine 16). Bow’s notation is procedural process that requires that one to draw a ‘space diagram’ initial as shown in the figure 1 below. This is followed by naming of the spaces with letters as shown in the figure.

The next step is now drawing the known vector which is a-b and finally completing the other two vectors to come up with a triangle (Figure 2) (Trautwine 47). Relocating the arrows back to the space diagram one can tell if the forces are struts (cord under compression) or ties (cord under tension). For the above case they are struts (Figure 3).
Equally, two or more non-parallel forces acting on a body in a plane but on different directions resolve to a resultant force R acting in between them. This force is commensurate to a single force acting in the opposite direction. The two concurrent forces can be replaced by a single resultant force along its line of action. The two forces plus the resultant force intersect at a point of origin where they either meet or deviate from. This is represented by the figure 4 below.

Completing the figure above results in a parallelogram shape, hence the name parallelogram of forces method. The forces in both methods can be obtained graphically by scale drawing with accuracy in drawing being of great significance.
Experimental Procedures
Triangle of Forces Test
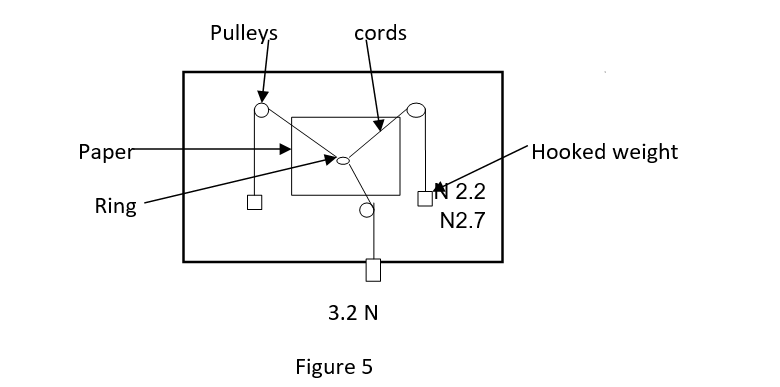
A ring was held against the diagram board and weights added to give values of 2.7, 3.2 and 2.2 Newton as shown in the figure 5 below. (Hook weighs 0.1N). The cords were then passed over the pulleys to alter the angles of the cords as shown in the figure 5 below. The center weight was bounced and left to settle in its new equilibrium position. This was later followed by accurate tracing of the cords with dotted lines using a pencil. The paper was later on removed and the dotted lines joined to form continuous lines as is in ‘Space diagram’. Bow’s diagram was later on used to determine the magnitudes and the directions of the forces.

Parallelogram of forces test
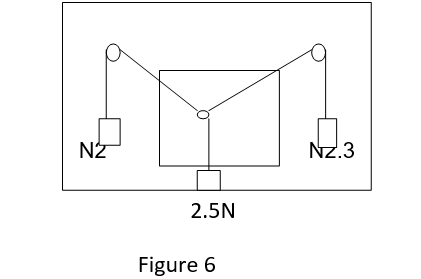
A sheet of paper was mounted on a diagram board and positioned as shown in the figure 6 below. Weights 2.3N, 2.5N and 2N were suspended in that order from the left pulley. The center weight was bounced and then left to settle at equilibrium after which the same procedure as was the first experiment repeated. The forces were then resolved using parallelogram of forces method.

Experimental Data
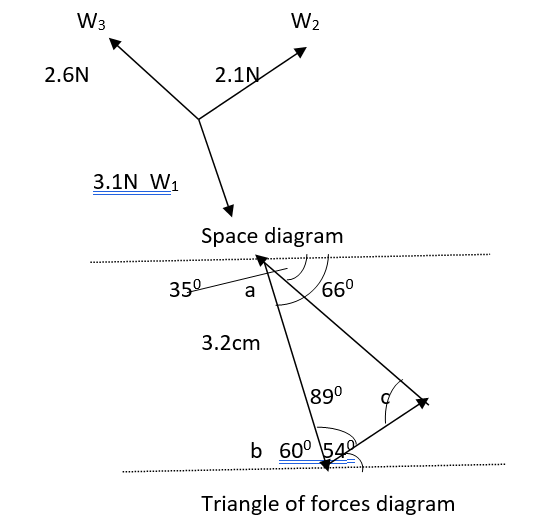
With respect to the first experiment to triangle of the forces method, below is the space diagram and the triangle of forces diagram.

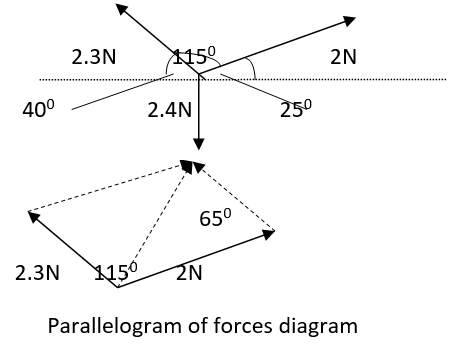
As regards the second experiment, the parallelogram of forces diagram is represented by the diagram below.

Data Analysis
In the first experiment, the length of bc by calculation is equal given by:
If line ab is 3.2cm then bc/sin 390= 3.2/sin890
therefore length bc=3.2sin 390/ sin890
=1.6cm
Length ac=3.2sin 600/sin 890
= 2.8cm
If ac is equivalent to 3.2N, then 1cm= 1N. Since a hook weighs 0.1N then ac is equivalent to 3.1N.
therefore, bc is 1.6*1-0.1N= 1.5N
ac is 2.8*1-0.1= 2.7N
It therefore follows that the calculated weights are equal or approximately equal to the actual weights. The only weight that has deviated from the actual weight is W2 indicating a length of 1.6cm.
In the second experiment, the resultant force R can be obtained using the cosine rule.
Therefore, R= √(22+2.32-2*2.3 cos 650)
=2.3N
This approximately close to the actual weight of 2.5N which acts in the opposite direction.
Discussion
With regards to triangle of forces method, the data obtained did concur with the actual weights to a certain degree. Of the three masses only one did deviate from the actual weight. From the space diagram we expected the weight W2 to be approximately equal to 2.1N and yet we obtained 1.6N. This can be attributed to experimental errors e.g. Inaccuracy in tracing or errors due to the equipment.
Correspondingly, the parallelogram of forces diagram gave us an approximately expected value of 2.3N showing a slight deviation of 0.1N. This slight difference expected since this is an experiment and hence, is subject to experimental errors e.g. the degree of accuracy in tracing the cords.
Conclusions
From the experiments, the graphical methods of finding the magnitude of forces corresponds with the calculation method provided that degree of accuracy is high. It can also be concluded that when three non-parallel forces acting at a point are at equilibrium, the resultant force is zero. Furthermore, when two concurrent non-parallel forces act on a body on a plane, the resultant force is equivalent a counter force acting oppositely.
References
Trautwine, John. The Civil Engeneering. Philadephia PA : National Publishing Co, 1882. Print.