Time-series methods
The components that define the time series forecasting method include cyclical and irregular, seasonal, average, and trend elements (Sloughter, Raftery, Gneiting, and Fraley 3). The time series model relies on numerical historical data, which is used to generate historical models that assume future trends. Here, the seasonal component is used to reflect a specific pattern. However, if values are observed to keep on recurring, they are assumed to show a cyclic trend. On the other hand, random variations of the values might occur, which leads to an irregular definition of the behavior of the variables.
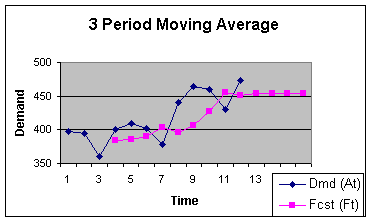
The average of data can be obtained by calculating the mean of the three periods of data to forecast the next period (MacKenzie and Peng, 4). Forecasting of the behavior of subsequent periods is possible if the mean of the previous data of three consecutive periods has already been determined as shown in figure 1, which shows the current and the future demand that has been derived from the 3 period moving averages.

It is possible to use multiple regression models to conduct quantitative forecasting. The rationale for using the method is because of a situation where one variable is known and the effects of several variables remain unknown. Here, either the cross-sectional data or time-series data is used. For example, multiple linear regression can is generally expressed as yi=β0+β1×1,i+β2×2,i+⋯+βkxk,i+ei (Crosswhite, 4). The left side of the equation consists of the variable to be forecast and the right side of the equation consists of the predictor variables. However, it is important in this case to observe some assumptions which include un-correlating errors with each other and the predictor variable.
Causal technique
The casual technique is a quantitative method that relies on the interpretation of the behavior of the casual relationship between two variables (dependent variable) and the independent variable (Granger and Newbold, 6). Denoted in this model are the true values and the predicted or forecast values. When used for forecasting, the model takes a mathematical relationship between the dependent and independent variables that are expressed in the form of y = f(x1, x2 … xn). In the model, x is the independent variable and y is the dependent variable.
In the context of the casual model, the dependent and independent variables depend on one another because one variable provides information about the other variable respectively (Claveria and Torra 8). However, the model fits well in forecasting situations despite lacking evidence of a causal effect between the variables. Different techniques such as the least-squares fit are used to analyze the relationship between the two variables and the effects on each other. Either the parameters are known or they are unknown and the predictions made due to the casual relationships between the variables depend on the measurement errors, the number of measurements, N, and the degrees of freedom of the regression.
Wang notes that either a regression analysis approach or a multiple regression analysis methods is used to establish the causal relationship between two variables using statistical methods (10). The importance of regression analysis is the ability to explore the relationship between the variables and how the behavior of the relationships. Regression analysis can be done using parameterized ordinary least squares or the linear regression technique.
Conclusion
Not all the quantitative methods use the same approach and data in forecasting, but each method has its input and output variables that behave differently. The time series methods depend on the nature and relationships of the variables and their occurrence with time, while the causal model depends on the causal relationship between the dependent and independent variables. However, the accuracy of the results depends on the degree of error that is accepted.
Works Cited
Claveria, Oscar, and Salvador Torra. “Forecasting tourism demand to Catalonia: Neural networks vs. time series models.” Economic Modelling 36 (2014): 220- 228. Print.
Crosswhite, Carl E. “Method for determining optimal time series forecasting parameters.” U.S. Patent No. 6,611,726. 2003. Print.
Granger, Clive William John, and Paul Newbold. Forecasting economic time series. Academic Press, 2014. Print.
MacKenzie, Gilbert, and Defen Peng. Introduction. Springer International Publishing, 2014. Print.
Sloughter, J. Mc Lean, et al. “Probabilistic quantitative precipitation forecasting using Bayesian model averaging.” Monthly Weather Review 135.9 (2007): 3209- 3220. Print.
Wang, Xiaohu Shawn. Financial management in the public sector: tools, applications and cases. Routledge, 2014. Print.