Source: Australian Bureau of Statistics, 2006

Source: Australian Bureau of Statistics, 2006

Source: Australian Bureau of Statistics, 2006
The similarities and differences in the spatial pattern of the maps to the map of unemployment
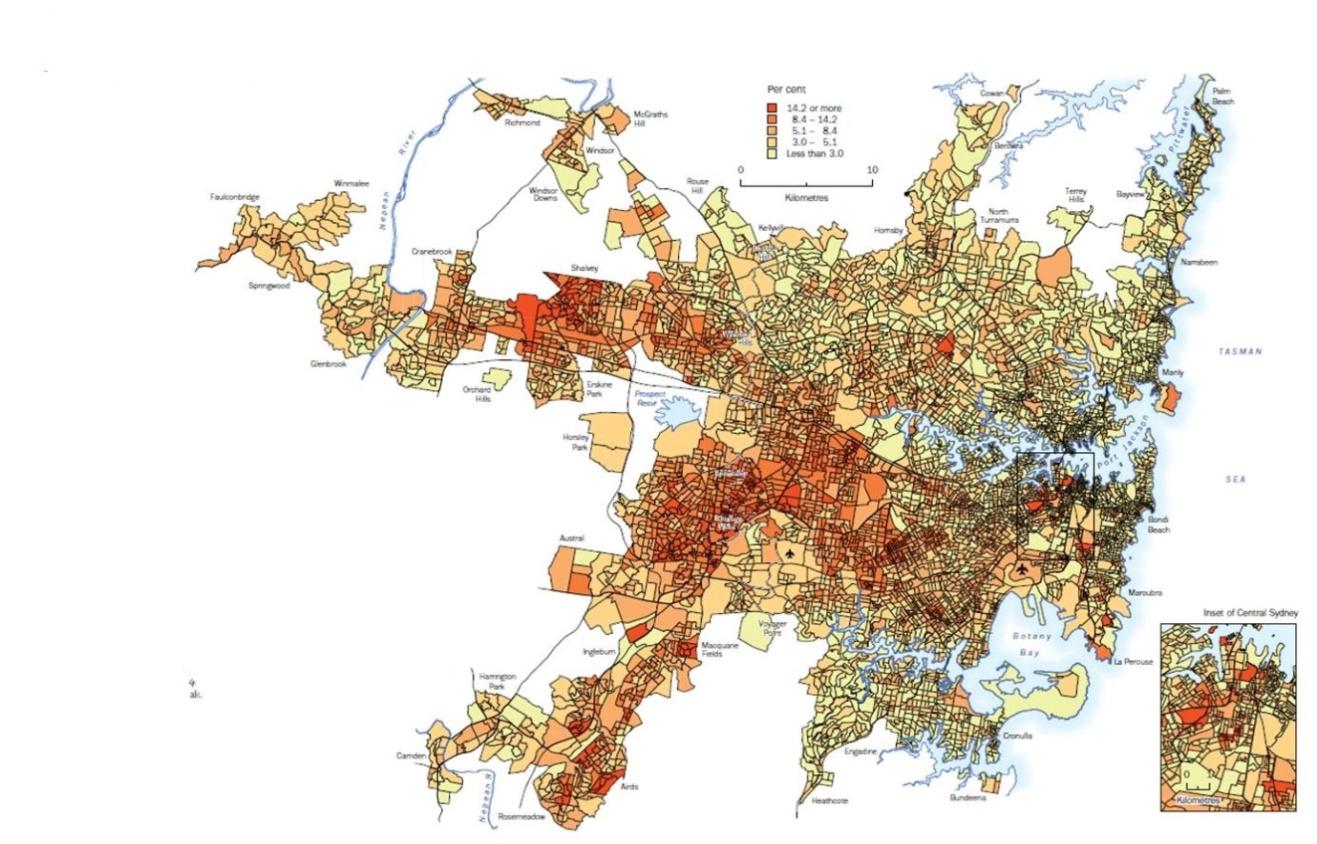
Map 1: Percentage of people who do not speak English well or not at all, across Sydney’s suburbs, 2006.
There are similarities in the spatial patterns; in particular, the areas with high unemployment levels overlap with those regions populated by people who do not speak English well. For instance, one can speak about Canterbury Bankstown, Outer West and South West. In turn, the regions with the lowest unemployment are inhabited by people who speak English well. For instance, it is possible to mention Upper North Shore or Lower North Shore.
The similarity in the spatial patterns can be partly explained by the fact that people who do not speak English well, find it difficult to secure employment.
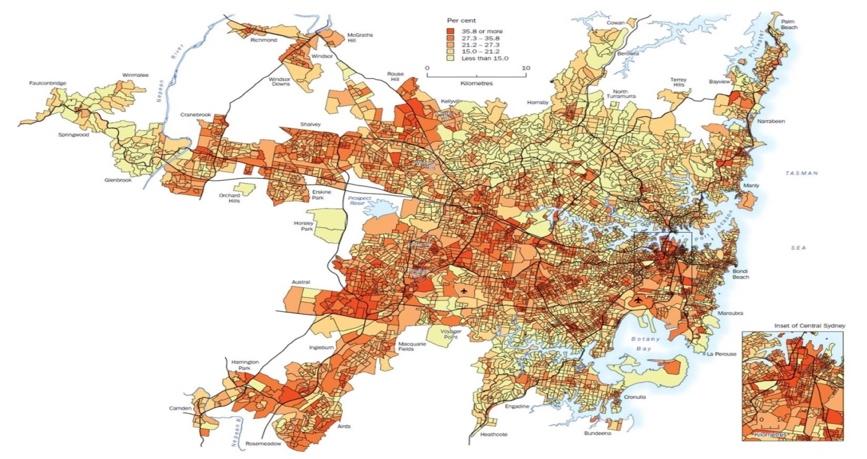
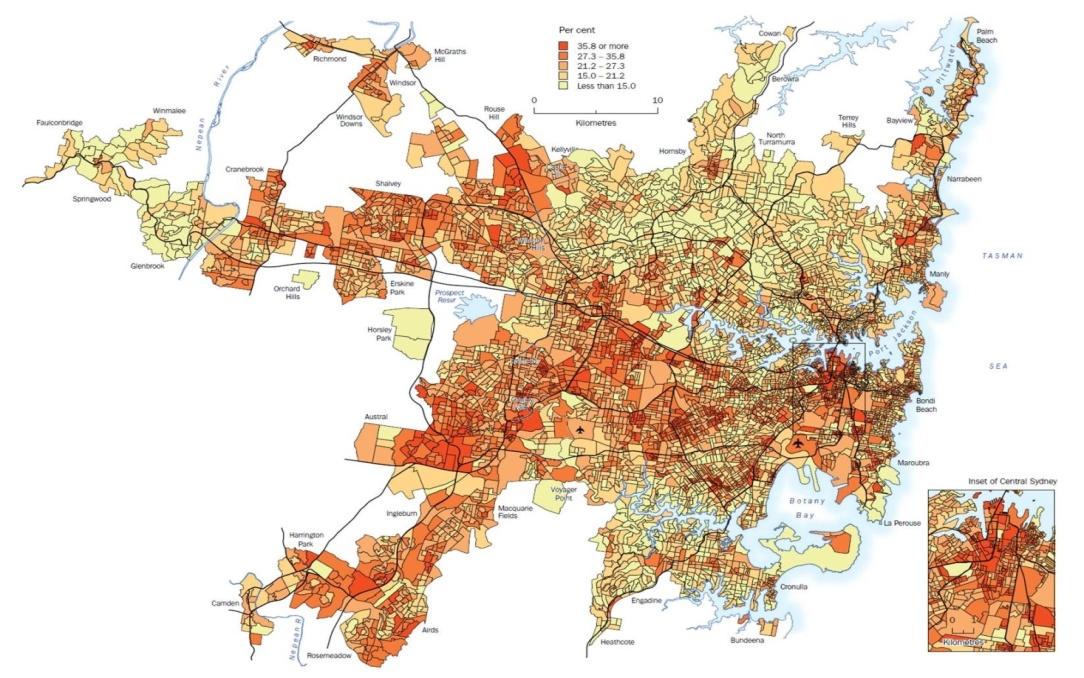
Map 2: Low-income households across Sydney’s Suburbs, 2006
Overall, the areas with the lowest household income and highest unemployment overlap. In this case, it is possible to speak about Canterbury Bankstown or Outer West. In contrast, such areas as North West Sydney or Upper North Shore that have the lowest level of unemployment and the highest level of household income.
The maps share a similar pattern because unemployment in a certain area usually reduces the income of households.
The changes have taken place in the economy that has generated unevenness in socio-economic opportunities
These maps illustrate marked inequalities in the economic development of different Sydney suburbs. To a great extent, this phenomenon can be explained by the trends that emerged at the beginning of the previous decade. In particular, one should speak about the growth of the new economy in Sydney. This economy is dominated primarily by various service industries. It should be kept in mind that these areas are concentrated mostly in the northern parts of the city (Randolph & Hollowey 2005, p. 54). Much attention should also be paid to the so-called Global Arc or a region with the highest concentration of knowledge jobs (Randolph & Hollowey 2005, p. 54). For instance, one can speak about such areas as financial services industry, IT companies, and other economic sectors that require good education. This is one of the points that can be made. Furthermore, it is important to remember about such a trend as deindustrialisation that affected many areas of Sydney, including those ones with the highest level of unemployment. Thus, people living in different areas of Sydney may not have the same opportunities. For instance, one can speak about Bankstown (Randolph & Hollowey 2005, p. 54). Thus, one can speak about the polarisation of economic development.
Admittedly, economic transformation is not the only factor that should be considered because continued immigration also forms the patterns of unemployment (Randolph & Hollowey 2005; Australian Bureau of Statistics 2006). One of the maps that have been examined shows that some areas of Sydney are inhabited by people who do speak English well (Price 2008, p. 94). So, it is possible to conjecture that these people are immigrants. Many of these individuals cannot find employment due to linguistic barriers. Moreover, some of them may lack educational qualifications. Their living conditions can be worsened by the deindustrialisation and decline of manufacturing enterprises that do not always require skilled workers. This is one of the details that should not be overlooked.
Nevertheless, one cannot tell that the spatial patterns of unemployment will become entrenched. First, it is possible that the government may invest capital in the development of those areas which are currently disadvantaged. Additionally, the children of immigrants may have more opportunities for integrating into the economic life of Sydney. Thus, unemployment trends that have been identified may not persist in the future. In this case, the outcome depends strongly depends on the policies of the government. These are the main arguments that can be put forward.
References
Australian Bureau of Statistics 2006, Sydney: A Social Atlas, ABC, Sydney.
Price, M 2008, Migrants to the Metropolis: The Rise of Immigrant Gateway Cities, Syracuse University Press, New York.
Randolph, B & Hollowey, D 2005, ‘The Suburbanization of Disadvantage in Sydney: New Problems, New Policies’, Opolis: An International Journal of Suburban and Metropolitan Studies, vol. 1 no. 1, pp. 49-65.