Summary of the Paper
Evidently, the provided paper discerns the use of daily motivational quiz to increase the participation, attendance, and preparation of students. It is noted that freshmen and sophomore students who hardly pursue accounting majors (as a career choice) later in their education programs embrace introductory accounting lessons.
These are, however, not highly motivated and thus present instructors with the challenge of finding ways of motivating them effectively. The motivation is aimed at improving their ability to get ready for class, be punctual, and participate in constructive class discussions. The instructors have adopted the use of daily quiz to achieve this and empirical evidence supports the strategy.
The abstract of the document has effectively summarized the document. It has noted the mostly affected students, the desired goals and the strategy adopted. In addition, it has included empirical evidence that supports the strategy that is used.
Main Critique
The authors note that it is a challenging and frustrating task to teach an introductory accounting program. However, it is also rewarding and satisfying to introduce the subject to students and give them knowledge that they can use in business. Nevertheless, the challenges are so great. The paper has clearly stated the sources of challenges to teaching introductory accounting lessons. The lessons are required in business majors in many institutions.
This results in high population of non accounting students in the classes. This creates various problems. First, non accounting majors are likely not to be serious in the classes. Secondly, most of them are freshmen and may not have the requisite skills for studying. Additional challenge is the requirement that instructors teach other courses like critical thinking to better equip students. The authors thus managed to bring out clearly all the challenges in teaching introductory accounting courses and have given detailed explanation.
The paper has also noted the results brought by these challenges and they are high levels of failure and high levels of withdrawal. It provides information and research findings to support these.
An example is a study in United States comprising four-year colleges that found the average rate of withdrawal in two introductory accounting lessons to be 19.76% and rate of failure was 15.27%. Grades “D”, “F” and “W” comprised 40.8% of the grades the students had.
Additionally, the authors have included the shift in paradigms from “provision of instructions” to “production of learning” by various institutions as it complicates the problem. This ensures that there are no gaps. Under production of learning paradigm, members of a faculty design learning strategies, setting and experiences and seek to inspire students to be able to find knowledge themselves instead of instructors delivering the knowledge.
The authors have clearly given the strategy adopted to achieve the goals desired. Daily quiz in lessons can inspire students to be prepared for class, be punctual and be involved in the classes. They have used literature from other studies to support their claim. It can induce students to complete homework and seek personalized assistance from the instructor (Nevid 150). Quizzes can be structured in a way that they are algorithmic variations to the home work given (Nevid 150).
Since the topics had been done in class, the quizzes play a major role in determining the finishing grades of the students (Nevid 150). The degree to which instructors use daily quiz in accounting classes in unclear. The authors, however, found that many standard accounting programs do not use them from the website of American Accounting Association’s Common. It provides evidence to support the use of quiz in shaping students’ perceptions, their effect on failure rates, on the instructor and on evaluations.
In general, the introduction of the paper has touched on all the main issues about the paper. It has given a thorough description of the problem, objective and literature in the issue. However, it is too lengthy and does not give summary of data collection methods. The authors note that many students in all disciplines do not devote much time for studies in recent times than a century ago. First year students are the most affected.
They describe this using a study that found that approximately 33 percent only do read before going to class (Kleinman 368). Many say that demanding schedules make then not prepare for class.
The non accounting majors are not interested in accounts and take the lessons simply because it is a requirement. This leaves instructors with students who do not want to be involved in class activities. This leads to poor academic performance (Hoyt and KimMarie 345). Daily quiz can be introduced to tackle the problem since it makes students to revise before class.
Students in first year like absenteeism and yet there is proof that performance and turnout are strongly associated. The authors provide evidence for these claims (Keller 314) and (Grewe 146). Daily quiz will give students a reason to come to class. The quiz should be administered at the beginning of the lesson.
This gives students an incentive to come early enough for the class. The authors propose that non-lecture strategies like discussions to be used in teaching accounting lessons. The reason is that various learning methods are shown by accounting students (Garf 86). Thus attendance and preparation should be complemented with participation to improve grades.
The authors clearly gave description of how they carried out their research and the method they used to obtain data so as to build an effective strategy. They also noted the necessary modifications and the results of the study. The questions focused on motivator’s task and were simple for students if they revised and uncomplicated to grade.
Terminology and concepts were the focus and time was put into consideration. The grading is done quickly and feedback given promptly to ensure compliance and revelation of areas requiring clarifications. They described control measures that ensure success in developing strategy.
The authors used different methods to obtain data. They used open ended questions, multiple choice questions, and rating. They also obtained more information through students’ feedback regarding daily quiz. Analysis of responses was by using open-codes (Del and Tonia 41). A table is included showing results obtained by the researchers. They included 66 students in the study and this is a good sample size to muse.
Most of them liked the use of daily quiz. They have clearly shown the variation in responses including the number who liked the quizzes, the number who thought the questions were tough or easy and how they felt the quizzes impacted on their attendance, performance and participation. Additionally, the authors noted how they results are consistent with previous studies. They concluded that results indicated quiz can enable students to adjust to course requirements and fully understand the courses.
The percentage of students who felt quizzes made them prepare for class was 85, 74 felt they made them be punctual while 71 felt it made them be involved in class activities. They also described how the data explained relationship between failure and withdrawal and the quizzes. The results showed that rates of failure were low in semesters when the strategy was used.
Summary of Research Approaches
The research approaches method learnt are qualitative, quantitative, logical theoretical and participatory methods. Logical theoretical is used when inferences are made from rational set of first assumptions. On the other hand, participatory theoretical is used when the researcher gets involved in the activities of the people he studies. Qualitative research is based on data that is obtained through observation or qualitative in nature.
Quantitative research mainly concerns gathering of data and then converting it to enable calculations (McNabb 302). The authors used quantitative method in the study since obtaining data was simple. This was done through giving of questionnaires and open ended questions.
Analysis using this method also brings more dependable results. The data collected was quantitative by nature. This is a critical provision when considered comprehensively in the context of research. It is crucial to consider various aspects of research critique in order to validate any research paper.
Conclusions
The paper has provided theoretical evidence to all the claims made. All claims made are accurate and consistent with the findings of the study. The data collected and methods used effectively supported the goal of the study. The feedback too showed the effectiveness of using quiz in introductory accounting lessons. It also managed to move from description of the problem to actual gathering and analysis of data.
There is also a logical sequence in the structure of the whole paper. The authors first of all states goals of the study, the challenges and the strategy to be used to achieve the objectives. This paper has also focused on the information provided on the document.
Differences in Marks Obtained by Students Taught by Different Tutors
There is difference in the marks that are obtained by students of the different tutors. The mean mark obtained by students taught by tutor 1 is 45.125 marks and they are 16 students. The modal mark obtained in the class is 57 marks while the median is 52 marks. Based on these figures, the class performs averagely. This could be due to the small number of students in the class. The standard deviation in the marks obtained in this class is 15.2441. They managed to score 15.8438% of the total marks in the five classes.
The mean mark obtained by students taught by tutor 2 is 54.312 and they are also 16 students. It can be said that they have passed than those taught by tutor 1. Their modal mark was 35 and the median mark is 56.5. The standard deviation in the marks scored in this class is 19.3622. This class managed to score 19.0696% of the total marks scored by all the 90 students.
For students taught by tutor 3, their mean mark is 47.2 marks and they are 30 students in the class. The mode is 40 marks and the medial mark is 45 marks. The reason for poor score in this class could be because of the high number of students. There is likelihood that tutor 3 is unable to give personalized attention to the students.
Due to the high number, there is also likelihood that some students could not be attending all the classes and the tutor cannot notice. The standard deviation in the marks scored in the class is 12.7802. They scored 31.0731% of the total marks of all the 90 students. This is because they are many in the class than students in the other classes.
The mean mark for those taught by tutor 4 is 69 and they are 13 in class. Their mode is 61 and the median is also 61 marks. The likely reason for high performance in this class is that the students could be engaging the teacher in the class room. They could be holding discussions and have formed discussion groups.
Another reason could be that due to the small number of students in the class, tutor 4 is capable of handling the students easily. He is able to give personalized attention to each student and this has a positive impact on the performance of the students. Various studies have often shown that small student to teacher ratios have positive impact on the performance of the students. The other reason for good performance in the class can be that tutor 4 is highly competent. They scored 19.6840% of all the total marks obtained by all the students.
Finally, the mean mark for those taught by tutor 5 is 43.53 and they are 15 in the class. The mode for this class is 40 marks and the median mark is 43. They managed to score 14.3296% of all the marks scored by all the students.
The table below shows the percentage scores of all the students taught by the five tutors.

The students taught by tutor 3 scored the highest percentage of 31.07% in all the marks of the 90 students. This can be explained by their small number. Students of tutor 5 scored the lowest percentage marks among all the students.
Students taught by tutor 4 had a mean score of 69 marks, the mode is 61 and the median is also 61 marks. The lowest score in the class is 53 compared to others for example the least score in class taught by tutor 1 is 13 while that taught by tutor 2 is 14. The least score in class taught by tutor 3 and 5 are 21 and 25 respectively.
They are thus the class that has performed better compared to the other classes. Their total percentage score is however low since they are few in the class. However, there are other factors that have to be considered in order to make dependable conclusions.
Effects of Course Taken and Results Obtained
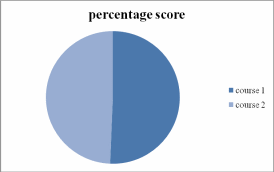
The courses that the students take has influence in the marks that they obtain. The mean score of the student who take course 1 is 54.9524 marks while that of students who take course 2 is 46.8542 marks. Additionally, the modal mark in the class taking course 1 is 58 marks while that taking course 2 is 40 marks.
The median mark in the class taking course 1 is 55 marks while that of the class taking course 2 is 43.5 marks. All these show that students taking course one obtain higher grades than those who take course 2. The standard deviation for those taking course 1 is 14.9910 marks while those taking course 2 is 16.2638 marks.
The percentage score for all the students taking course 1 is 50.64736 marks while the percentage score for all the students taking course 2 is 49.35264. The chart and table below shows the percentage scores for the two courses by all the students.
There are reasons that can explain the difference in performance between the two classes. One reason could be that course 1 is not more involving than course 2. Another reason could be that the study and teaching methods used in the two classes are different. The method used in teaching course 1 could be more effective and then the method used in teaching course 2.
Students, Previous Entry Qualifications and the Marks that they achieve
The entry qualifications of the students have an impact on the marks obtained in the modules. To know the influence of previous entry qualifications, I checked the means of all the students whose qualifications were 1, 2, 3, 4 and 5. The mean score of students whose entry qualifications were ranked as 1 is 42.26667 and the students were 15 in number. Their modal score is 60 and the median is 38. Only 7 of these students passed the 50 mark point with the rest performing dismally.
The mean score for the students whose entry qualifications were ranked as 2 on the other hand is 45.3333 which are higher than the mean of those whose entry qualifications were ranked as 1. The median is 45.5 marks and this is higher showing a better performance that those whose entry qualifications was 1.
For those whose entry qualifications was ranked as 3, their mean score for the module is 48.42 and this also shows a better performance than the two above. The mode for this group is 40 while the median is 48 marks. The increase in the median mark also shows an increased performance among this group of students.
The mean score for the students whose entry qualifications to the module was ranked as 4 had a mean score of 51.7778 in the module and this further shows that the entry qualifications in the module made difference in the marks obtained.
Finally, the students whose entry qualifications to the module were ranked as 5 showed the best performance in the module. Their mean score in the module is 63.3158 marks. This is the highest among all the groups. Their modal mark is 70 marks and the median mark for the group is 69 marks. This further supports the conclusion that the pervious entry qualifications of the students make a difference in their performance in the module.
The chart below shows variations in the means of the performance of the various groups of students.

It clearly shows that students whose entry qualifications were low perform poorly compare to those whose entry qualifications are high. The reason for this could be that students who had higher entry qualifications are highly intelligent and thus high performers. They could also have been better trained in reading and studying methods and thus are able to pass exams easily.
Works Cited
Del, Rosso and Tonia Marek. Class Action: Improving School Performance in the Developing World Through Better Health and Nutrition. Washington, DC: World Bank, 1996. Print
Garf, David. Teaching Can Be Fun. Coral Springs, FL: Llumina Press, 2003. Print
Grewe, Norbert. Absenteeism in European Schools. Münster: LIT, 2005. Print
Hoyt, Gail and KimMarie McGoldrick. International Handbook on Teaching and Learning Economics. Cheltenham, UK: Edward Elgar, 2012. Print
Keller, John. Motivational Design for Learning and Performance: The Arcs Model Approach. New York, NY: Springer, 2009. Print
Kleinman, Isobel. Complete Physical Education Plans for Grades 5 to 12. Champaign, IL: Human Kinetics, 2009. Print
McNabb, David. Research Methods in Public Administration and Nonprofit Management: Quantitative and Qualitative Approaches. Armonk, NY: M.E. Sharpe, Inc, 2008. Print
Nevid, Jeffrey. Psychology: Concepts and Applications. Boston, MA: Houghton Mifflin Co, 2007. Print