Abstract
Remote sensing techniques can be used in vegetation monitoring. It is carried out from space using satellites. It avails information regarding how satellite images can be used to study the vegetation. Over the years, remote sensing has becomes an effective technique of evaluation of developments taking place about vegetation. Through remote sensing, normalized difference vegetation index can be evaluated and explained. The index shows the green coverage of vegetation on a graphical indicator. Remote sensing can also be used to monitor other changes in vegetation. Such changes include pollen activity and alterations in mangrove forests.
Introduction
About 70% of the earth’s surface is covered in vegetation. Ecologists need to gain insight into the kinds of plants existing within a region (Awange & Kiema, 2013). They should understand how plants are distributed, as well as their patterns and growth phonology. However, it is difficult to gather information over a wide area. The use of satellites has provided ecologists and water and environment engineers with a means of monitoring vegetation. Monitoring vegetation via satellites is commonly referred to as remote sensing. Sensors are fitted into the satellites to achieve this. The process makes it possible to monitor the quality of the earth’s vegetation cover, such as its physiology and morphology. The technique can also provide information regarding plant communities and species available on the ground surface. Remote sensing also helps in the determination of the distribution of the existing vegetation cover within a particular locality.
In this paper, the author seeks to provide an overview of the use of remote sensing to monitor vegetation. The author will also outline some of the benefits associated with the use of satellite technology (Frachtenberg & Schwiegelshohn, 2008). Photosynthesis and spectral properties of vegetation will also be discussed. The use of NDVI retrievals from space and dedicated satellite missions will be highlighted. Also, the limitations and challenges of this technology will be outlined. The researcher will then highlight NDVI retrieval in arid and desert environments. A discussion on NDVI in monitoring pollen activities will also be provided. Finally, the detection of mangrove vegetation from space through remote sensing will be discussed. The effect of mangrove species on respiratory diseases will also be evaluated.
Overview: Importance of Vegetation Monitoring From Space
Remote sensing offers real-time monitoring of vegetation. It achieves this by helping scientists conduct a spectral analysis of the images relayed by the satellites. Some indices are used to track the changes. One of the most commonly used is the Normalized Difference Vegetation Index (NDVI) (Australian Government Bureau of Meteorology, 2015). Remote sensing can be used in various fields to study different forms of vegetation. Examples of surfaces studied using the technique include manicured vegetation in urban areas, agricultural land, forests, wetlands, and rangelands. In monitoring such areas, remote sensing can be put into a wide range of applications. They include determining developments on both agricultural and forest vegetation, evaluating climate changes, managing the environment, controlling hazards, and weather forecasting.
Aerial images of these vegetations can give indications of how people conserve the environment. Through remote sensing, it is possible to tell whether the development taking place is positive or negative. As such, policymakers will take the necessary steps to maintain a positive change or deal with negative developments. It also plays an important role in monitoring natural hazards (Walter‐Shea & Biehl, 2010). In this case, ecologists can deal with an unwanted plant variety before it becomes problematic. For example, the encroachment of a particular area by a potentially hazardous plant species can be stopped.
Through remote sensing, it is also possible to determine the proportion of the land surface that is covered by vegetation at a particular time. Vegetation can be either natural or manmade. In most cases, natural vegetation is in form of forest cover. Remote sensing provides valuable information on the progress of forests. It helps detect cases of diminishing forest cover through natural and human causes. Through remote sensing, it is possible to detect any changes in the vegetation, allowing ecologists to respond promptly (Montini & Bogdanovic, 2011). In the case of land that is under agricultural use, remote sensing can be used to determine the progress of the crops. In this case, it plays an important role in predicting the amount of food available for human consumption. As such, it helps deal with matters of food security by helping governments anticipate food shortages.
Through remote sensing, it is also possible to study the climate of an area. It is possible to achieve this by analyzing the plant species and communities that inhabit a particular region. Climate influences the kind of vegetation in an area. As a result, ecologists can tell the climate of an area by analyzing high-resolution satellite images (Pringle, 2006). Change in vegetation cover over time can signify climate variations. It can also indicate a change in the weather. The reason behind this is that certain variations in weather can result in major changes in vegetation. Remote sensing allows for the marking and locating of waterlines, such as rivers, lakes, shorelines, and other areas determined by vegetation. Other specialists use this approach when determining the physiography and geology of a region.
Photosynthesis and Spectral Properties of Vegetation
Photosynthesis is a natural source of energy that sustains the life of living organisms (Reynolds, 2007). Some bacterial species can retrieve energy from inorganic substances through chemosynthesis. However, photosynthesis remains to be the main source. The process allows for the storage of energy in form of simple sugar molecules made from water and carbon (IV) oxide by the chlorophyll pigment. Only leaves and other green parts of a plant, such as a stem, can carry out the process. The reason is that their external and internal structures are adapted to this procedure. The interaction between electromagnetic energy and the structures has a direct impact on the spectral appearance of the leaves and canopies when observed through remote sensing.
Healthy leaves can intercept radiant flux either emanating from a diffuse skylight or the sun. As the radiant flux travels from its source, it is an ‘incident’. However, it shatters upon hitting the structure of the leaf. The reason is that the electromagnetic energy that is incident in nature tends to interact with the chlorophyll, intercellular spaces, and water molecules within the leaf (Reynolds, 2007). It is possible to measure the amount of radiant flux that the leaf absorbs, transmits across its structure, and reflects. One can achieve this through the use of energy balance equations whose purpose is to track the fate of all the incident energy that meets the leaf (Jones & Vaughan, 2010). Most satellites that facilitate remote sensing of the vegetation mostly measure the value of the reflected energy. They function within the energy wavelengths of between 0.35 and 3.0 µm. The reflection can be described as the total incident energy meeting the leave minus that which is used for the process of photosynthesis and that which is transmitted to others below it.
Several factors affect the ability of a leaf to reflect or transmit energy. They include the leaf’s pigments, water content, and internal structure. Chlorophyll is the pigment that is of most importance. There are two types of chlorophyll. The two are chlorophyll a and b. Another pigment of major importance in remote sensing of vegetation is β-carotene. Some factors determine the amount of water that is present within a leaf (Jensen, 2011). The factors include the rate of evapotranspiration, which is mainly influenced by the amount of heat. Other factors include the availability of water in the soil and the plant species.
The process of photosynthesis impacts significantly on the appearance of the canopies from an aerial view. For a leaf to carry out photosynthesis, three requirements must be met. To begin with, carbon dioxide (CO2) must be present. The CO2 is normally obtained from atmospheric air. Water (H2O) is the second requirement. It is considered to be the primary raw material for the process of photosynthesis. It is availed to the leaves through the root and the stem system. Irradiance (Eλ) is the third requirement. The light emanating from the sun is the main source of irradiance (Thenkabail, 2012).
The top layer of the leaf’s upper epidermis has a cuticular surface. It is waxy and translucent. It diffuses light and at the same time reflects some. The cellular structure of a leaf is larger compared to the wavelength of the light (Gouveia, Trigo & DaCamara, 2009). Typically, palisade cells are larger compared to parenchyma cells located in the spongy mesophyll. The palisade cells are located on the upper side of the leaf surface, while the parenchyma cells are located at the bottom. The palisade cells have more chlorophyll. That is why they are a darker green.
Visible lights range from violet to blue, green, indigo, yellow, orange, and red. In the light spectrum visible to the human eye, red has the longest wavelength, whereas violet has the least. However, researchers argue that many other radiations are not visible to the human eye depending on the surface and temperature. The human eye detects short wavelengths since radiations interact with matters in varying ways. The incident rays provide the energy that is transmitted, reflected, and absorbed by the surfaces it hits (Gouveia et al., 2009). The reflected light, together with the wavelengths of the radiation that forms the colors, are what makes it possible to view objects. The principle of wavelength variations in the actual red-green-blue (RGB) spectrum. It is used in viewing photos when making satellite images.
The diagram below illustrates variations in wavelength between different regions of the RGB spectrum:
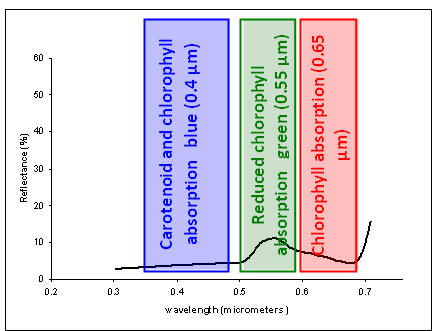
The images are usually affected by the matter components within the atmospheres. Solid and liquid particles within the atmosphere deflect, diffract, or reflect the energy waves. The distraction is identified by the term attenuation. Air molecules alone can change the appearance and clarity of satellite images (Langley & McGuire, 2006). The attribute is also common when there are clouds, which prevent the penetration of light.
Green plants absorb most of the light received on their surfaces and reflect the remaining. However, plants with different colors absorb little energy and reflect the remaining. The reflected energy is what is represented in the satellite images. As such, reflection from active photosynthetic plants is of low speed and wavelength. The reason is that some of the energy does not show on the satellite images since it has been absorbed (Langley & McGuire, 2006).
Vegetative surfaces can absorb or reflect the incidental rays transmitting at varying wavelengths of 1.3 microns. The spectrum can be divided into 3 sections. The three are visible, the near-infrared (NIR), and middle infrared (Shuck & Wollard, 2010). The range of optical features is dictated by the highest absorption towards the highest reflectance of a green plant. The reflectance is affected by the capability of the pigments to trap light in such structures as the chloroplasts
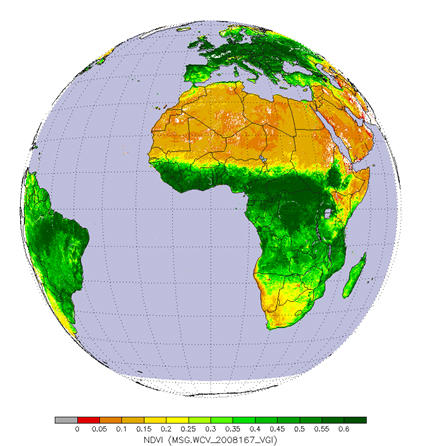
When a photon of light hits a chlorophyll molecule, some of it is reflected, while the rest is absorbed. An absorbed light proton enters into an excited state. Chlorophyll a and b absorb blue and red light. As such, the green light is reflected. As a result, leaves get a healthy green foliage color. Other pigments, such as yellow carotene, absorb the green region. The development allows red and blue light to be reflected. Another pigment found in leaves is phycocyanin. The pigment allows for the absorption of red and green regions of light at 0.62 µm. As a result, much of the blue light and a portion of the green light is reflected (Otto, 2005). The combination is sensed remotely by satellites as cyan.
The diagram below shows how the presence of varying pigments reflects different regions of the RGB spectrum as captured by remote sensing satellites:
Normalized Difference Vegetation Index (NDVI) Retrievals from Space: Dedicated Satellite Missions, Limitations, and Challenges
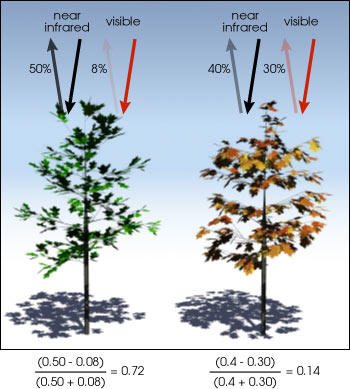
NDVI is a simple way of analyzing remote sensing images obtained from satellites (Otto, 2005). It provides a graphical indicator of whether or not a particular region contains live green vegetation. The value of NDVI is obtained using this formula
NDVI = (NIR-VIS)/ (NIR+VIS).
Where:
- NIR= near-infrared radiation
- VIS= visible radiation.
The diagram below provides an illustration of how NDVI is obtained and the parameters used in calculating it:
Abnormalities of green vegetations negatively affect the efficacy and efficiency of life. Consequently, it is fundamental to preserve and monitor how plants are cared for. The loss of green hues in satellite images shows that there are problems with the vegetation. The NDVI value helps to identify the change within an ecosystem. It allows scientists to code and identifies threats to life when plants are affected. It also enables conservation agencies to fight activities that affect the prevalence of a green ecosystem.
When NDVI is very low, it implies that there are very low instances of green plants within that area. For instance, an NDVI of 0.1 may indicate that the land is occupied by sand and rocks, such as in the deserts (Brown & Beurs, 2008). The NDVI of areas covered with snow is also low and can at times be below 0.1. The value may rise to between 0.2 and 0.3 in grasslands and shrubs. The highest level of the index is identified in tropical rain forests and temperate regions. They show a value of between 0.6 and 0.8.
The association between vegetation and radiations indicates that imagery may be used to create sensors. The sensation is facilitated by the three rays incorporating all bands of the vegetation. The RGB images can be used to retrieve information about the vegetation (Jensen, 2000). The imaging helps the scientist to relate color with the existing channels of the sensing programs
The value of NDVI may range from zero to 1. On land, the regions presenting low NDVI indicates that there are few plants. A value close to 1 shows the regions with adequate plants. Values close to -1 signify land covered by the sea. On the water surfaces, the NDVI shifts to the negative values since there are no plants present, especially in the sea. The aspect implies that the reflectance is very low (Jensen, 2000).
The use of NDVI to describe the nature of vegetation that exists within a particular locality is associated with several limitations. To begin with, when calculating the index, only two values are used. The sum and the difference of the two spectral channels, NIR and VIS, carry the same information. Considering that only the two channels are used, it is apparent that a lot of valuable information that can be obtained from the remotely sensed images is left out.
Secondly, NDVI value tends to give estimations on a wide range of vegetation qualities. Such qualities include the concentration of chlorophyll in the leaves, biomass and ground cover of the vegetation, leaf area index, productivity, and rainfall patterns. Mis-registration of the remotely sensed images can also result in errors when obtaining the value of NDVI (Taiz & Zeiger, 2010).
Atmospheric effects such as cloud cover can also hurt the quality of images obtained during remote sensing. They are said to contaminate the images of the area under investigation. The effect is more pronounced in instances where the diameter of the cloud is found to be smaller than the area being monitored by a remote sensor (Baret, Houles & Guerif, 2007). Other atmospheric effects include humidity and particles. Such effects should be adequately accounted for to avoid the occurrence of errors.
Soil also tends to change its color especially when moist. Most soils tend to darken when their moisture content is increased. If the sensor has not been programmed to have a spectral response to changes in moisture similar to that observed in the soil, then the images will give false alarms which in no way affect the vegetation (Baret et al., 2007).
NDVI Retrieval in Arid and Desert Environment
Generally, the NDVI value of the desert environment is very low. In most cases, it is below 0.1. The reason behind this is that the conditions in these areas are harsh which discourages the growth of plants. Only a few plant species can survive in the desert environment. Such species include acacia and cacti. However, their ground cover is very minimal to make any significant changes in the value of NDVI (Baret et al., 2007). The land is also rarely put under agricultural use unless when irrigation is used.
The diagram below shows a comparison of remote sensing images obtained from the desert environment and other areas.
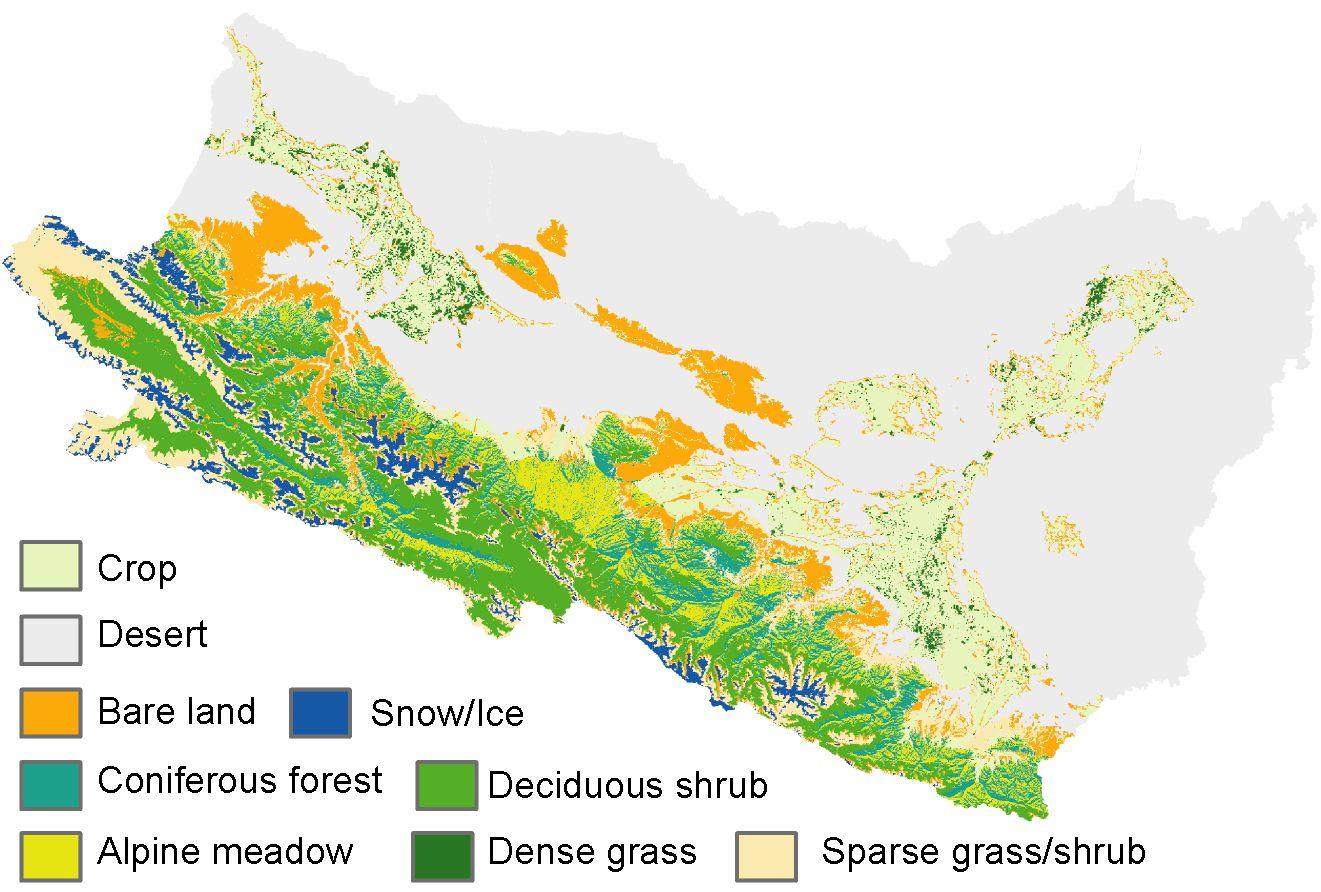
Desert land receives minimal rainfall of less than 100mm per annum. The climatic conditions dictate that the agronomic practices carried in such areas must employ high technology and adequate water. The two are applied to sustain the environment while maximizing the yields (Soudani & Francois, 2014). The paper will use Abu Dhabi city as the reference point for analyzing the NDVI values of desert areas.
In a desert environment, the use of water to sustain crops and operate animal husbandry is evident. The crops produced by the farms include date palms, vegetable crops, and fodder crops. Therefore, the crops and animals should be produced using water from alternative sources to supplement the little rainfall (Soudani & Francois, 2014).
The sources of water used in agriculture include:
- Conventional resources, such as rainfall, ponds, springs, and groundwater.
- Non-conventional resources, such as treated wastewater and desalinization.
The use of irrigation to support agriculture is likely to have a positive effect on the value of NDVI. The reason behind this is that the vegetation cover of the environment will be increased. At the same time, the vegetation will appear greener since water is available to the plants, which prevents their drying up and dying off.
Since water to boost irrigation is available, various agricultural activities can be supported in desert lands. The ecologically sound methods of farming include irrigation and hydroponics among others (Taiz & Zeiger, 2010). The water used in agricultural farms is spent in the drip, furrow, sprinkler, and bubbler irrigation. Governments in areas with expansive desert cover have formulated strategies to guide water usage. In desert areas, such as Abu Dhabi, water used in the agricultural farms is consumed mainly in the three major irrigation methods which are surface irrigation, sprinkler irrigation, and localized irrigation.
Hydroponics can be described as an agricultural practice that entails growing plants deprived of soil while minerals and other nutrients are provided in water (Mattar, 2008). In a hydroponics system, plants are grown in nutrient solutions. There is also the use of artificial substrates, such as sawdust. Some crops can be grown using irrigation in desert environments. They include cabbages, spinach, cucumber, tomatoes, potatoes, and strawberries. Such crops serve a very important role in the economy of the countries. For example, Egypt is one of the desert countries in the world, which is known for its production of citrus and other forms of fruits. The products are exported to Africa and other countries in the world, earning the nation significant foreign exchange.
Irrigation is carried out to ensure that water is available to the plants growing in the desert environment. Without water, such plants cannot survive. They will not be able to carry out photosynthesis or absorb nutrients from the soil. As such, water, air, and the required nutrients are enhanced in the zones of the roots (Baret et al., 2007). The plants will in turn grow as they are supported by the nutrients availed through the water. The nutrients can be occurring naturally in the soils, or they can be introduced through the application of fertilizers and other substances.
Irrigation is associated with several advantages when it is carried out in the desert environment. For example, it allows for the cultivation of crops in all seasons of the year. Farmers can achieve this especially when they are using greenhouses. It is noted that in other regions where farming normally occurs, people depend on rain. As such, the production of food crops is seasonal (Reynolds, 2007). Irrigation is a controlled form of production. As such, it leads to the production of cleaner, highly nutritious, and healthier foods compared to those from other agricultural methods. Besides, there are low chances of crop failure compared to other systems of farming.
Despite all these benefits, it is important to note that irrigation in the desert environment is associated with some disadvantages. For example, setting up irrigation systems is costly (Baret et al., 2007). The farmer has to purchase pipes, construction materials for greenhouses, and other structures needed. The case is different in rain-fed agriculture where the plants are planted in the fields and depend on nature to mature. The labor that is required in the maintenance of the irrigation system is intensive. The reason is that some aspects of the system cannot be mechanized, especially when the space is small. Waterlogging may also occur in cases where the soil does not drain well. In some cases, the soils are so poor in nutrients and drainage that the farmer needs to replace them. In the event of pump failures in any system that uses the pump, the result will be wilting of the plants since the roots will dry very fast.
Irrigation plays an important role in the sustenance of urban centers in countries located in desert regions. Abu Dhabi, Egypt, and other countries whose landmass is largely desert can exploit the potential of their ecosystem by embracing irrigation (Baret et al., 2007).
However, it is important to note that the use of irrigation may not have significant changes in the NDVI value of the vegetation. The reason behind this is that in some cases, this type of farming is carried out inside specialized structures, such as greenhouses. For this reason, images of the vegetation are not accessible to remote sensors mounted on satellites (Brown & Beurs, 2008). Even though the amount of vegetation produced under such establishments is high, it is not of any benefit in the determination of NDVI.
Use of NDVI in Monitoring Pollen Activities
Research has shown that NDVI can be used for monitoring pollen activities. Pollen is composed of particles released by male parts of a flower for fertilization. It is impossible to monitor pollen activities within a small area. The reason behind this is that the particles are minute and can only be monitored if they occur in large numbers. Pollen activity can be remotely monitored from space (Brown & Beurs, 2008). In most cases, it is triggered by events, such as winds. The particles are normally small and can be transported over large distances. One of the main reasons why the movement of pollen can be detected through remote sensing is that it has a different color from that of the rest of the vegetation.
Pollen is one of the main agents of triggering asthma. It has been recorded that the cases of asthma raises when there are thunderstorms since spores of fungi and pollen increase in the atmosphere. Thunderstorms have a potent role in triggering several asthmatic cases, which were not attributed to the spores (Australian Government Bureau of Meteorology, 2015). When the researchers isolated the study of pollen and the admissions, it was noted that the number of admissions was not reliant on the spores. In this regard, the data collected on admissions was varied without correlation to the level of spores recorded within the selected dates.
Various aspects of weather are much related since each has parameters that influence the other. For instance, indeed, temperatures are usually high during summer and the rainfall during this period is low. It indicates that the amount of rainfall is much reduced during summer between July and September. At this time, increments of temperature lead to the evaporation of high contents of water. Therefore, the humidity of cities around or close to the shores between these months is high. For example, the moisture content of Abu Dhabi moves up to 78% during the month of august which correlation with the temperatures (Gouveia et al., 2009).
The wind is an important aspect of the distribution of humidity, rainfall, temperature, and other factors triggering the prevalence of asthma, such as pollen and spores (Manningham, 2014). Scientific research and recent studies show that the poor air quality in Abu Dhabi that is attributed to the main sectors of the economy poses serious and dangerous health risks to the ever-growing population of the city. The five major pollutants that can be attributed to the deteriorating quality of air in Abu Dhabi include nitrogen dioxide, carbon monoxide, sulfur dioxide, ground-level ozone, and lastly particle pollution or particulate matter. Pollen fall under this broad category.
Particulate matter refers to the tiny particles of sand, dust, or chemicals that can penetrate deep into people’s lungs. Scientists have been researching particles not bigger than the human hair, which is approximately 10 micrometers in size and they are known as PM10. Surprisingly, smaller particles known as P22.5 are also being researched as types of particulate matter. They are the most harmful ones due to their ability to easily penetrate the human lungs, which is a hazardous trait (Manningham, 2014).
Detection of Mangroves from Space
Mangrove is one of the most crucial plants in the coastal environment. It is also of great ecological importance on earth. The interaction of man with nature has made the plant equally important in the socio-economic arena (Walter‐Shea & Biehl, 2010). In recent times, most previously mangrove-dominated land is being put into other uses to satisfy human wants. The situation has led to an overwhelming decrease in the mangrove and irreversible environmental effects. As a result, monitoring and tracking the spatiotemporal existence and distribution of the plant has been a critical undertaking. Remote sensing, therefore, becomes a critical venture as it is the single-most activity that helps to identify the mangrove on the surface of the earth. Information gathered following remote sensing of the vegetation facilitates preservation action.
One of the most crucial detecting tools used to study the mangrove is known as the Landsat Thematic Mapper. The tool enables scientists to capture images in the format of the Landsat 4-5. The images consist of files that have seven bands of spectrum. The images have a resolution of about thirty meters for all the spectral bands. When monitoring the mangrove, the sixth band which comprises the infrared ray is collected at one hundred and twenty meters. After they are taken, they are re-sampled to thirty meters to correspond to the original measurements and resolution. In principle, the images have a thermal band ranging from six to sixty meters. Besides, they take the images in the GeoTIFF format which is considered a good format when it comes to differentiating the mangrove from other plants on the earth’s surface.
In modern technology, scientists have come up with another format known as the Landsat Enhanced TM Plus image. The spectral band contains exactly eight bands. They are taken at a resolution of thirty megapixels from the first to the seventh band of the spectrum. However, the thermal infrared band, which is the sixth, is taken at a resolution of sixty megapixels (Walter‐Shea & Biehl, 2010). The band is then re-sampled to thirty megapixels to remain consistent with the entire spectrum band. Scientists have also come up with the Landsat 8 image files which have exactly nine spectral bands. In this case, all the bands are taken at a resolution of 30 megapixels except the eighth band (Awange & Kiema, 2013). The eighth band is taken at a resolution of 15 meters which is essentially lower than the rest of the spectral bands used in all the other formats. The spectral bands appear to range from the optical and short-wave-length areas but the ninth band is of cirrus wavelength.
Space-centered thermal emissions and reflection radiometers are used to hide the areas where elevation is very high (Wu & Chen, 2005). It is very important to do this since it simplifies the process of analyzing and reaching the point of detection, as well as differentiation from other plants. Land over the map with a scale of about 1/250000 is then used as reference data for carrying out a crosscheck and assessing the accuracy of the images as obtained from the Landsat. The maps are usually made by the use of the Landsat images and hence can be used to validate the field surveys and aerial pictures. The process enables scientists to classify the different areas of the images as either mangrove or non-mangrove. The resultant map obtained from this classification is then changed into a raster type that has a resolution of 40 meters (Walter‐Shea & Biehl, 2010). Having been converted to a raster map, it is easy to use it as a reference for the validation of accuracy and precision which are very important factors when it comes to the classification of the images and the entire results.
The process of detecting the mangrove consists of some specific steps to ensure accuracy and reliability. The first stage is known as the data pre-processing stage. In this stage, the Landsat images are acquired using the respective tools as discussed in the previous paragraph. The images are corrected for errors using the reference maps as illustrated in the previous paragraph. Further assessment of the images is conducted on each of the Landsat images that had been corrected using about twenty ground points. The ground points are selected from critical features that exist in the entire target area. A scientist must ensure that the Root Mean Squared Error is equal to or less than fifteen meters (Walter‐Shea & Biehl, 2010). As such, the images are considered to have been corrected radiometrically such that they can be registered in the Universal Transverse System.
After the pre-processing stage, the images are classified to differentiate some areas as mangrove-dominated areas and others as not. In most cases, the mangrove areas are those whose elevation is lower than thirty meters of height. In the same light, the areas whose elevations are higher than 30 meters are disregarded since most of the resolutions of the images are set at thirty. The step is then followed by the selection of the spectral band. The reflectance of the plant leaves becomes a critical aspect in the determination of the short wavelength. Reflectance is attributed to the amount of water absorbed by the plants about that of the entire plant community (Montini & Bogdanovic, 2011). Mangrove leaves are detected based on low reflectance since their leaves have smaller intercellular spaces that normally contain air.
Mangroves Species and their Effects on Respiratory Diseases
There are various types of mangrove species (Montini & Bogdanovic, 2011). They are classified by the color and the nature of their growth. The species are discussed below showing the characteristics that make them distinct from others.
Red Mangrove
The red mangrove is scientifically known as the Rhizophora mangle and referred to as the (Walking Tree) from the layman language. It is identified by the trunk-like roots that bear a nearly red color. They have shiny leaves that are deep green on the upper side while the underside is much lighter. The leaves approximately measure one to five inches in length (Jensen, 2011). They are broad and hence have a blunt tip at the far end. Another most distinct aspect that differentiates them is their prop roots since they arch out from the stem and the branches. The arching prop roots lead to the production of additional roots that give the red mangrove an appearance perceived as walking in the water.
The figure below shows the distinct parts of the red mangrove. The red-colored roots and the props are outstanding:
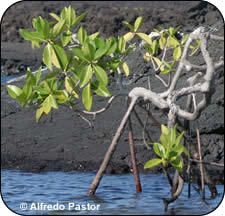
In essence, these mangroves are capable of growing in brackish water since the tree can remove about 0.99 of the salt from the water before uptake. Indeed, an analysis of the plant’s tissues showed that the plant takes 0.01 of the salt only (Otto, 2005). It is also known to develop bud-like protrusions which take a torpedo shape. The torpedo-shaped protrusions are commonly known as propagates and they serve as the seedlings to the red mangrove. In this case, propagates fall on the surface of the tree and float until they find an appropriate environment for growth to take place. It is hypothesized that propagates can drift on the surface of the water for a whole year before taking root to grow into a mature tree. The mangrove species is not associated with respiratory diseases. The reason behind this is that it is not affected by brackish water. The presences of the prop roots enable the plants to respire even under marshy waters. The plants may pose a risk to humans. The reason is that the pollen grains produced during flowering may cause respiratory complications to individuals who are allergic to these substances.
Black Mangrove
The black-colored mangroves are scientifically known as the Avicennia germinans. The species is essentially taller than the red mangrove owing to its age. In essence, they mostly grow in the high altitude areas as opposed to the red and white species. The black mangroves are depicted to be having a ‘look at the ground’ appearance. They are usually surrounded by pneumatophores which protrude and point upwards (Otto, 2005). They are meant for breathing since they respire through the roots. They play an important role in the growth and development of the plant since it grows in saturated water. In that regard, the plant would not get sufficient air if the pneumatophores were absent. Another crucial differentiating characteristic is the fact that the back of the plant is dark in color (Dash, Gottsche, Olesen & Fischer, 2005). As such, the dark bark informs the name ‘Black Mangrove’. The mangrove leaves are glossy. They are also green on the upper surface. The underside is dark green. Essentially, the leaves are coin-shaped and hence a very critical differentiating characteristic.
The image below shows some of the characteristics of the black mangrove:
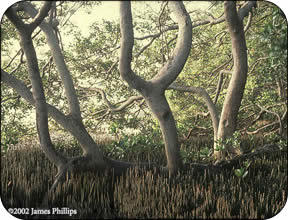
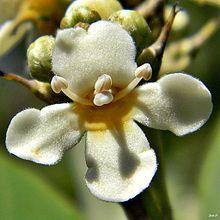
Black mangroves also produce flowers. They do this in spring and early summer. The flowers are usually in color. The pollen grain may cause respiratory diseases among humans. The figure below shows a flower of a black mangrove:
White Mangrove
The white mangrove is scientifically known as the Laguncularia racemose. It is found and grows in areas of high elevations. In essence, it grows in areas of higher elevation. They are easily identified due to the light-green color of their leaves. Their leaves are about three inches long. They are round in shape at both ends and with a notch at the far end of the leaf. The tree is also characterized by two bumps that exist at the point of intersection between the leave and the stem (Otto, 2005). The seedling of the white mangrove takes the shape of a pod and their sizes are equivalent to a nickel. The plant provides a habitat for many marine organisms. The organisms have great importance in the ecosystem and the environment at large (Otto, 2005). They serve as the buffers at times of a strong storm which may otherwise destroy the entire plant. The plant is also of great socio-economic benefits. The other types of mangrove species include the orange, yellow, grey, and milky mangroves. The species are very rare and can only be found in some of the most protected forests in the world. Most of these plants produce flowers with pollen grains, which may cause respiratory complications among humans.
Conclusion
Remote sensing is over the years becoming a commonly used technique in detecting changes in the vegetation (Otto, 2005). The technique puts into use sensors and cameras situated in satellites in space. Through remote sensing, scientists today are in a position to gather valuable information on vegetation. Examples of data that can be obtained through the practice include monitoring the process of photosynthesis. It can also be used to monitor developments in desert and mangrove vegetation. Through the technique, it is also possible to monitor pollen activity.
References
Australian Government Bureau of Meteorology. (2015). Climate data online. Web.
Awange, J., & Kiema, J. (2013). Environmental geoinformatics monitoring and management. Berlin: Springer.
Baret, F., Houles, V., & Guerif, M. (2007). Quantification of plant stress using remote sensing observations and crop models: The case of nitrogen management. Journal of Experimental Botany, 58(1), 869-880.
Brown, M., & Beurs, K. (2008). Evaluation of multi-sensor semi-arid crop season parameters based on NDVI and rainfall. Remote Sensing of Environment, 112(1), 2261-2271.
Dash, P., Gottsche, F., Olesen, F., & Fischer, H. (2005). Separating surface emissivity and temperature using two-channel spectral indices and emissivity composites and comparison with a vegetation fraction method. Remote Sensing of Environment, 96(4), 1-17.
Frachtenberg, E., & Schwiegelshohn, U. (2008). New challenges of parallel job scheduling. Job Scheduling Strategies for Parallel Processing, 4(1), 1-23.
Gouveia, C., Trigo, R., & DaCamara, C. (2009). Drought and vegetation stress monitoring in Portugal using satellite data. Natural Hazards and Earth System Sciences, 9(1), 185-195.
Jensen, J. (2000). Remote sensing of the environment: An earth resource perspective. Minnesota: Prentice Hall
Jensen, J. (2011). Remote sensing of the environment: An earth resource perspective (4th ed.). Minnesota: Prentice Hall.
Jones, H., & Vaughan, R. (2010). Remote sensing of vegetation: Principles, techniques, and applications. Oxford: Oxford University Press.
Langley, A., & McGuire, B. (2006). Natural disasters: Hurricanes, tsunamis, and other destructive forces. New York: Kingfisher.
Manningham. (2014). Climate and energy. Web.
Mattar, Y. (2008). Post-industrialism and Silicon Valley as models of industrial governance in Australian public policy. Telematics and Informatics, 25(4), 246-261.
Montini, M., & Bogdanovic, S. (2011). Environmental security in South-Eastern Europe: International agreements and their implementation. Springer: Dordrecht.
Otto, K. (2005). Yarra: A diverting history of Melbourne’s murky river. Melbourne, Australia: Text Pub.
Pringle, J. (2006). Beyond Melbourne. Edmonton: Alta.
Reynolds, K. (2007). Sustainable forestry: From monitoring and modeling to knowledge management and policy science. Wallingford, UK: CABI.
Shuck, B., & Wollard, K. (2010). Employee engagement and HRD: A seminal review of the foundations. Human Resource Development Review, 9(1), 89-110.
Soudani, K., & Francois, C. (2014). Remote sensing: A green illusion. Nature, 506(1): 165-166.
Taiz, L., & Zeiger, E. (2010). Plant physiology. Sunderland, MA: Sinauer Associates.
Thenkabail, P. (2012). Hyperspectral remote sensing of vegetation. Boca Raton, FL: CRC Press.
Walter‐Shea, E., & Biehl, L. (2010). Measuring vegetation spectral properties. Remote Sensing Reviews, 6(13), 179-205.
Wu, X., & Chen, W. (2005). Land surface temperature estimated by remote sensing data from FY-1D polar meteorological satellite. Journal of Applied Meteorological Science, 16(1), 45-53.