Introduction
Despite sanitary well-being and the advances of modern medicine, it is naive to believe that humanity has conquered infectious diseases. AIDS, tuberculosis, malaria, measles, Ebola, whooping cough, influenza, and other viral infections are constantly raging around the world. The relevance of these diseases gained new prominence at the beginning of the 21st century when the world was experiencing the severe COVID-19 pandemic. This paper will present a study by a medical company regarding viral diseases among different populations and cities.
Cases by City
In 50 cities across the United States, information was gathered in April 2017 to pinpoint particular cases of persons who are afflicted with a hazardous virus. To direct resources to places that require them, my healthcare company is interested in learning where the population is most impacted (Kopackova, 2019). The information gathered, including the cities with the greatest infection rates, the number of cases, the prevalence rate per 100,000, and an overall interpretation of the data, are analyzed in the report that follows.
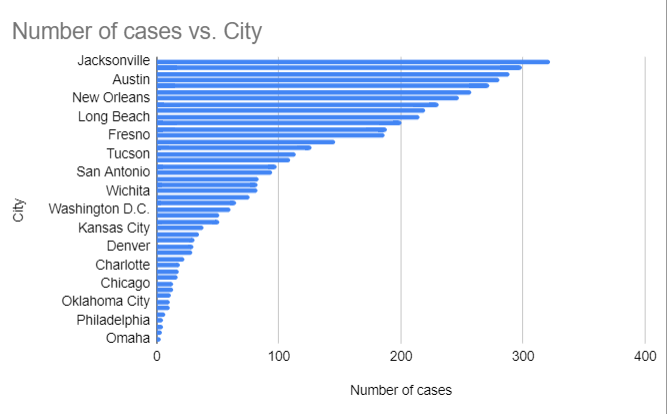
The top five cities for infected cases between April 2 and April 28 of 2017 are Houston, Austin, Phoenix, Miami, and Jacksonville, in that order. These cities’ infection rates are shown in the bar graph below (Figure 1). Houston has 272 cases, Austin has 281, Phoenix has 289, Miami has 299, and Jacksonville has 322, as shown in both the bar graph and Table 1 below.

Top five cities for infected cases
Table 1: virus cases in the top 5 cities
The prevalence of a disease is a measure of how likely it is to exist in a given community. The total number of cases of infection currently present in a population is called the prevalence rate. By dividing the total number of patients in a population by the total population, a prevalence rate can be obtained (Nunn et al., 2021). Thus, the prevalence rate would be determined by dividing the total number of cases in all cities by 100,000 if the viral infection is measured in a population of 100,000.
Prevalence rate = (number of people infected/number of people measured)*100
Here, number of infected = 4852, number of people measured = 100,000 Prevalence rate = (4852/100000) *100 = 4.85%.
The prevalence rate is 4.85% per 100,000 people. Estimation by information and graph The cities most affected are Jacksonville, Miami, Phoenix, Austin, Houston, San Diego, New Orleans, Mesa, Atlanta, Long Beach, and Los Angeles.
A random sample was selected to estimate prevalence from the entire population we wish to illustrate. The city, date, and number of cases are included in the data. The following are prevalence rates per 100,000 population in the five largest cities: Houston, Austin, Phoenix, Miami, and Jacksonville have prevalence rates below 0.00299%. The prevalence rates in Houston, Austin, Phoenix, Miami, and Jacksonville are 0.00272%, 0.00281%, 0.00289%, 0.00299%, and 0.00322%, respectively. All five cities together have a prevalence rate of 0.01463%.
After analyzing the chart, the following conclusions can be drawn: The Southern region of the U.S., home to a considerable population, includes four of the five cities with the highest prevalence of viral infections. Florida is the hardest-hit state, with a total of 621 cases. April falls during the peak of flu season may have contributed to people’s vulnerability to contracting additional viruses, which affected Florida’s numbers. The findings suggest that residents of the five cities with the highest frequency of viral infections have weakened immune systems, making them more susceptible to disease. Quarantine and immunization would be effective strategies to reduce or eliminate the number of people affected by the virus (Nelson et al., 2020). In addition, healthcare providers should conduct vaccination campaigns that can reach areas affected by the virus. Such campaigns can consist of free vaccination of potentially dangerous areas of infection, encouraging vaccinated people with benefits such as free public transportation, discounts on a specific group of goods, etc. It is also necessary to take into consideration the factor of public awareness about vaccination to explain to people why it happens, how it will affect their health, and why they need this manipulation. These actions are necessary primarily to refute possible fears of patients about vaccination itself, to give them confidence, and to provide them with the right to choose.
The cities that were least affected by the viral infection are Omaha, with only 3 cases, Virginia Beach, with 4 cases; Colorado Springs; and Philadelphia, each with 5 cases of virus infection, according to the information obtained after evaluating the bar chart. It can be argued that the population in these cities has a strong immune system that protects their bodies against virus infection. As a result, these cities reported the least virus infections.
The top five cities highlight the regions in need of immediate attention from the healthcare system to control the spread of the virus infection. Cities like Omaha, Virginia Beach, Colorado Springs, and Philadelphia might not need immediate medical attention because there are far fewer infection instances there, which can be controlled by the local healthcare organizations working with the relevant cities.
The histogram also shows the range in the number of viral infections between the city with the highest rate and the city with the lowest rate. In this case, the range can be determined by comparing the cities of Jacksonville and Omaha. The distance between these two cities is 322-3=319 points. The range, however, cannot be used as a suitable measure of dispersion when the set is represented by a histogram, as there are outliers that limit its applicability. The histogram shows that the range is sensitive to outliers, as Jackson Weil contains 322 cases and Omaha contains 3 points.
In conclusion, medical companies can generate and extract the data medical experts need to properly analyze and use the data to find answers to problems such as pandemics, epidemics, and outbreaks of old measles-type viruses in select groups. In addition to providing control of the virus, evaluating this data can help people affected by the virus recover faster (Burrell et al., 2018). More disease prevention, quality control, and health promotion efforts are needed in the five largest cities. For example, it is possible to agitate people for treatment by allocating sick leave at the expense of the company and promoting healthy lifestyles, hygiene, timely treatment, and prevention. Data are often used to ensure good health outcomes related to resources, medicine, quality, and success.
Ages Impacted

The Most Affected Age Groups
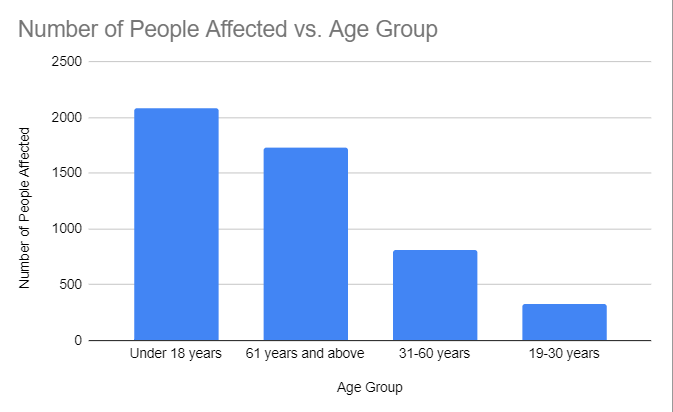
According to the analysis of the age categories affected, people under the age of 18 are the most affected. There are currently 2089 people under the age of 18 who have been affected by the virus. Based on the three age categories, this is the biggest number of people who have been affected by the virus. Additionally, people 61 and older are the second-most affected age group. There are 1731 people affected by the virus among people 61 and older, as shown in Table 3.
The Least Affected Age Groups
According to the analysis of the age groups affected, those between the ages of 19 and 30 are the ones who are least affected by the virus. 323 people have been affected by the virus, among those between the ages of 19 and 30. In comparison to the other three age groups represented in that study, those between the ages of 19 and 30 are the least affected. People between the ages of 31 and 60 make up the second age group that is least affected by the virus. 809 people are affected by the virus who are between the ages of 31 and 60. The age ranges affected by the virus can be ranked from most to least affected, as shown in Table 3 below.
Table 3: Ranking of the age groups affected by the virus
The Prevalence Rate as Per the Age Demographic
Calculating the prevalence rate for each age demographic involves dividing the total number of people affected for all four age groups by the total number of people affected for each age group.
Table 4: Infection per age group in each city
4953 people in total representing the four age groups are affected by the virus. To get the prevalence rate per age demographic, we divide the number of an age group affected by the total number of people affected as shown in Table 4 below (Nunn et al., 2021).
Table 5: Calculation of the Prevalence rate per age demographic
As shown in table 4 above, the Prevalence rate per age demographic for 18 years and younger is obtained by dividing the population of those with 18 years and below by the total number of people infected. This is shown by the work below; 2089/4953 =0.42. The prevalence rate per age demographic for 61 years and older is obtained by dividing the population of those 61 years and older by the total number of people infected. This is shown by the work below; 1732/4953 = 0.35. The prevalence rate per age demographic for 31- 60 years old is obtained by dividing the population of those with 31- 60 years old by the total number of people infected. This is shown by the working below; 809/4953= 0.1. The prevalence rate per age demographic for 19- 30 years old is obtained by dividing the population of those with 19- 30 years old by the total number of people infected. This is shown by the working below; 323/4953) = 0.07
It may be inferred from an evaluation of the chart that the virus affects people of all ages, both young and old. However, the virus affects younger and older people, ages 18 and older and 61 years and older, differently. Most likely, the different response to the virus at different ages is related to the effectiveness of a person’s immune system at a certain age and lifestyle.
Conclusion
Viral diseases are among the most frequent causes of death among the world’s population. Every century, humanity faces new types of viruses and experiences epidemics and pandemics, but it still finds treatment. Quality medical care for patients with viral diseases can be achieved by focusing on the goals of the healthcare system to improve the quality and usefulness of medical care, including the etiological diagnosis of viral infections. As an integral component of quality health care, laboratory diagnosis of viral infections can mean much more than a differential diagnosis of viral disease in patients with specific clinical symptoms. Its results can also be used to predict the effectiveness of alternative patient care tactics, as well as to monitor the effectiveness of treatment regimens and their correction. Increasingly, independent results of scientific research obtained based on etiological diagnosis are used to assess the effectiveness of healthcare services, as well as for value-based purchasing, which aims to optimize the use of healthcare resources and reduce short-, medium- and long-term treatment costs. Pharmacoeconomic analysis can be a priority for identifying new cost-effective technologies to maintain or improve the quality of diagnostic and clinical efficacy of etiologic diagnosis of viral diseases, especially in the context of reforming the modern US health care system.
References
Burrell, C. J., Howard, C. R., & Murphy, F. A. (2018). Epidemiology of Viral Infections. Fenner and White’s Medical Virology, 2(7), 185–203. Web.
Kopackova, H. (2019). Reflexion of citizens’ needs in city strategies: The case study of selected cities of Visegrad group countries. Cities, 84, 159-171. Web.
Nelson, N. P., Weng, M. K., Hofmeister, M. G., Moore, K. L., Doshani, M., Kamili, S., Koneru, A., Haber, P., Hagan, L., Romero, J. R., Schillie, S., & Harris, A. M. (2020). Prevention of Hepatitis A Virus Infection in the United States: Recommendations of the Advisory Committee on Immunization Practices, 2020. MMWR. Recommendations and Reports, 69(5). Web.
Nunn, C., Schneider‐Crease, I., Miller, I., & Muehlenbein, M. P. (2021). Estimating infection prevalence: Best practices and their theoretical underpinnings. Ecology and Evolution, 8(9), 6738–6747. Web.