The company chosen for this write up is Wal- Mart Stores Inc. Financial analysis provided in different parts of this essay are based on financial figures and information provided in the annual report 2007 of the company as the annual report of the competitor for 2008 is not available. The competitor selected for the project is Costco Wholesale Corporation and its annual report 2007 have been used for analysis in the write-up.
Wal- Mart Stores Inc. started its business in 1945 in Arkansas, USA, but today its stores are operating in a number of countries around the world like in Argentina, Brazil, Canada, Costa Rica, El Salvador, Guatemala, Japan, the UK, and many other countries including China. Wal- Mart stores offer daily needs, durable household goods, automotive parts, electronic goods, and all sorts of consumable items to their customers at reasonably low prices. Sam club segment of Wal- Mart provides hard goods, soft goods, and institutional size grocery goods under Members Mark, Bakers, Chefs, and Sam Club brands. The main competitors of Wal- Mart in the industry of Discount and Variety Stores are Costco Wholesale Corporation and Target Corporation. The magnitude of business of Wal- Mart can be realized from the fact that “as of January 31, 2008, Wal- Mart operated 971 discount stores, 2447 supercentres, 132 neighborhood markets, and 591 Sam-clubs in the united states” besides its stores and markets in other parts of the world.
As per a news item reported by Nichole Maestry on November 5, 2008, on Reuters web site, Wal- Mart is organizing special sales on Saturdays to win US shoppers. This has been described as the toughest holiday sales in the last decade. The basic idea behind such holiday sales is to induce shoppers to start their gift buying for the coming festival season. These in-store sales will include items like Sony Video Games Consoles, televisions, laptops among other items. This is really an event to cash upon for cash-starved shoppers.
The profitability performance of an organization can be measured by its operating margins and net profit margins. The operating margins ratio is the percentage of sales remaining after all expenses before interest and taxation. A net profit margin is a percentage of sales after all expenses including interest and taxes. Wal-Mart Stores Inc (WMT) operating ratio is 5.88% as compared to 8.32 % its competitor Costco. Similarly, the net profit ratio of 3.24% of WMT is also lower than 4.5% of Costco. Though ratios of profitability are lower than that of Costco the profitability performance of WMT can in no way be termed as inefficient as it appears that lower profitability ratios may be caused by its higher revenue as compared to Costco. The WMT revenue in 2007 was $348650m as compared to $63367m of Costco.
Assets utilization can better be reflected by the total asset turnover ratio. This ratio indicates the efficiency with which assets have been exploited by the entity to generate sales during the period. Total Asset Turnover of WMT for 2007 was 2.31 times as compared to 1.42 times of Costco. The more is the total asset turnover, the more efficiently and effectively the entity is supposed to have utilized its assets to generate sales. This reflects that Wal- Mart has exploited its total assets in a very efficient manner to generate revenue and that is why sales touched the figure of $348650m in 2007.
The liquidity ratios of a company provide its short-term solvency status. In other words, these ratios indicate whether the company is in a position to meet its short-term obligations as those become due. The liquidity position is better reflected by current and quick ratios. It is a notion that the current ratio of 2:1 and quick ratio of 1:1 is optimum for any organization. WMT has a current ratio of 0.9:1 as compared to 1.42:1 of Costco; and the quick ratio of Wal- Mart is a mere 0.25:1 as compared to 1.03: 1 of Costco. This shows that the liquidity position of Wal- Mart is precarious and the company may be finding difficulties in meeting its short-term obligations. There appears to be a position showing cash crunch as its quick ratio is very low. The position of Costco is also not good but it is certainly better than Wal- Mart so far as liquidity is concerned.
Debt utilization ratios reflect the financing pattern of the total assets of the company and also its capital gearing or leverage position. The debt ratio of Wal- Mart is 0.59 as compared to 0.66 of Costco. This shows that 59% of the total assets of Wal-Mart are financed by debt capital as compared to 66% of the assets of Costco. A company is highly geared when its debt ratio is more than 1. That means both companies are low geared. But the company is not trading in equity as the shareholders of Wal- Mart are not taking the advantage of high gearing as profits after meeting all fixed interest and dividend liability ultimately belong to shareholders, who are treated as residual beneficiaries. The same is the case with Costco. Perhaps both the companies are not prepared to take risks involved with borrowed capital.
“DuPont Analysis is used to dissect the firm’s financial statements and to assess its financial conditions” (Lawrence J. Gitman, 2006). Ultimately it results in showing the performance as return on assets (ROA) or return on investments. The higher the return on assets the better is the performance of the company. As per DuPont analysis the ROA of Wal- Mart is 7.46%as compared to 6.39% of Costco in 2007. Wal- Mart has yielded a more and efficient return on its investment in 2007 as compared to Costco.
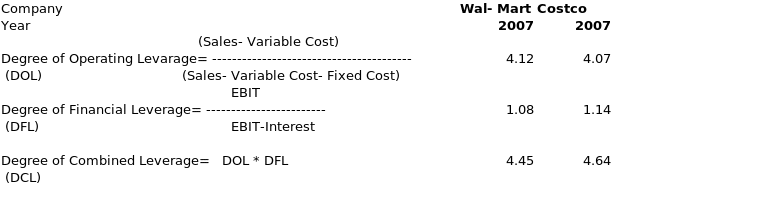
Operating leverage is the interaction or relation of operating profits before interest and taxes (EBIT) with the revenue of the firm. Financial leverage depicts the relation of EBIT with equity employed per share (EPS); and Total leverage is the relation between a firm’s revenue and EPS. Degrees of these leverages are their numerical measurements. Total leverage shows the potential use of both operational and financial costs to show the effects of changes in revenue over earnings per share. DOL is 4.12 for Wal-Mart and 4.07 for Costco. That means the effect of operating fixed expenses on EBIT for Wal- Mart is slightly greater than Costco. On the other hand the effect of financial expenses on changes in revenue for converting into EPS in the case of Wal- Mart is less than that of Costco, as its DFL is 1.08 as compared to 1.14 of Costco. However effect of combined leverage of operating and financial expense on revenue changes to convert into EPS is greater in the case of Costco as compared to Wal- Mart. But the overall difference in leverages effect of converting changes in revenue to EPS in both the company is marginal.
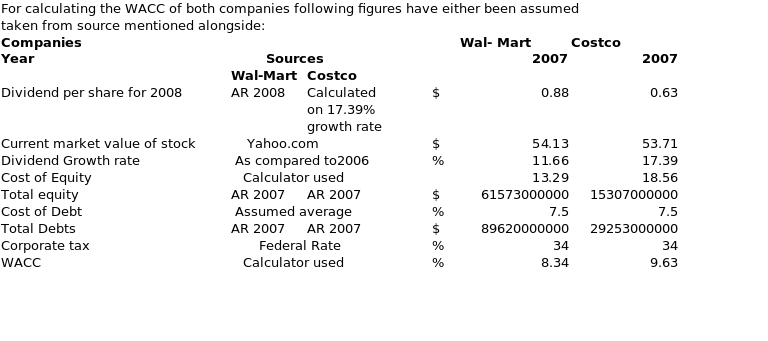
The main assumption used in calculating WACC for Wal- Mart, and Costco was the Cost of debts of 7.5%, and that is based on information provided in annual returns about interest rates on long-term notes payable. Dividend in the case of Costco for the year 2008 was calculated on basis of growth rate calculated for 2007 with reference to dividend for 2006. The tax rate taken is the current federal rate of 34%, though the effective rate would be higher than that.
Based on these assumptions and using the calculator from a website, the weighted average cost of capital (WACC) of Wal- Mart comes to 8.34%, which is lower than Costco’s rate of 9.63%. As the cost of debts has been assumed similar for both the companies, the real effect on WACC has been made by the cost of equity. In the case of Wal- Mart cost of equity comes to 13.39% which is lower than 17.39% of Costco. A conclusion can be drawn that cost of raising large capital has some economies that bring the WACC lower as compared to a situation where a small amount of capital is raised as was the case of Costco as compared to Wal- Mart.
Using data from Yahoo.com the monthly performance of stocks for two years of both companies have shown the following trends:
- Wal- Mart has performed extraordinarily well at stock prices as in Oct 2006 the average rate was $47.56 and that has always been rising during this two year period except for a short period of a month from Sep 2008 to Oct 2008. In September 2008 it was $59.89 and that came down marginally to$55.81 in October 2008. It is a phenomenal performance despite a great onslaught on prices.
- Costco’s stock price performance is also near to Wal- Mart except that it did not have a continuously rising trend since September 2006. In between prices kept fluctuating but the range of fluctuations was marginal. It appears slight reductions of prices every time was due to market corrections on regular basis. Otherwise, the price in Oct. 2006 was $48.75 and it rose to $57.01 in October 2008. The October 2008 price has come down from a high of $ 71.14 in May 2008. The current crisis has affected Costco more than Wal-Mart.
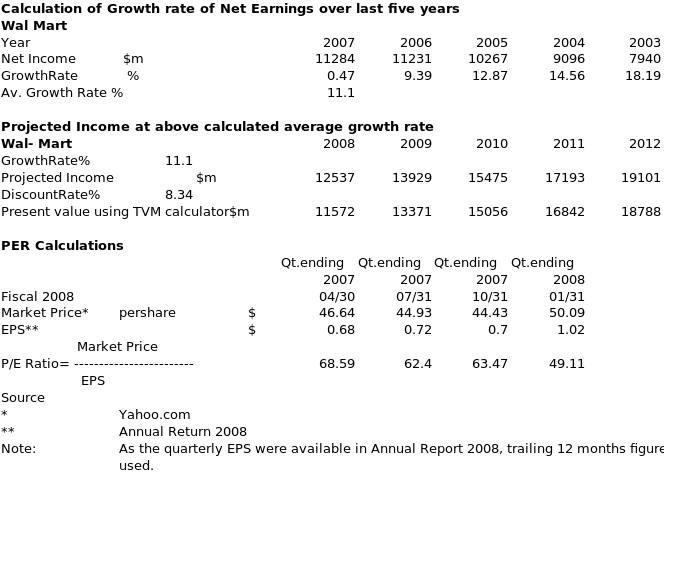
Keeping in view the fall in P/E ratio as calculated above and the fall in prices since September 2008, it is suggested not to buy the shares of Wal- Mart at present, keep the holdings with you and observe the movement of price for few more weeks before making a decision.
Exhibit A:
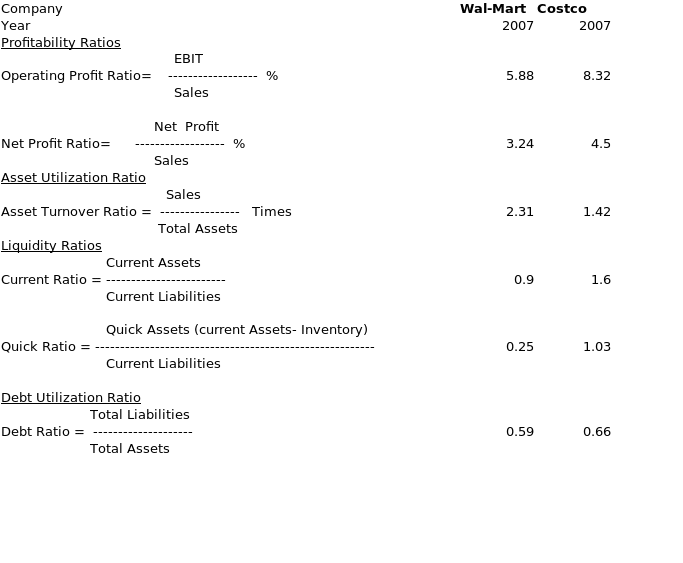
Exhibit B:
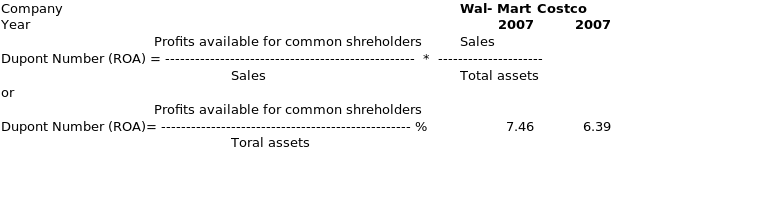
Exhibit C:
Reference
Wal-Mart Stores Inc. Annual Report 2007, Web.
Target Corporation Annual Report 2007, Web.
Wal-Mart Stores Inc., Profile, 2008, Web.
Nichole Maestry, Wal- Mart holding special in-store sales on Saturday, 2008, Web.
Lawrence J. Gitman, Introduction to Managerial Finance, 6th Edition, chapter 2, page 75, Pearson Education.