The basic motive behind any investment is maximizing wealth and minimizing risk so it would be a natural instinct to prefer and select an investment which provides the highest amount of returns and has the lowest level of risk associated with it. In reality this is not the case at all as high risk investments yield high profits and low risk investments yield low profits. This preference of profit can be further divided into two aspects of long term and short term returns. Some investors prefer short term returns and others prefer long term stable earnings. The shares or stock of a company are the most popular investment option available to investors as they provide stable long term earnings in the form of dividends and short term gain in the form of capital gain when the price of the shares increase.
Executive Summary
The financial and trend analysis of a company is quite helpful in evaluating a company’s strengths and weaknesses and making investment decisions. This analysis not only helps investors in evaluating the growth prospects of an investment but also provides investment options based on interest or dividends. If this analysis is carried out using a group of companies in an industry as a comparison a more feasible and valid conclusion can be derived from the analysis. The analysis carried out in this report involves two companies from the retailing industry which are Target Corporation and Wal-Mart Stores Inc. The comparative financial ratio analysis of these companies indicates that both of these companies have their respective strengths and weaknesses. Wal-Mart is quite healthier in terms of asset management and debt management while Target is stronger in the areas of liquidity and profitability. Wal-Mart is a better alternative for investors seeking interest based returns and long time growth while Target is a viable option for investors considering dividend and capital gain based returns. The comparative trend analysis of the two companies with each other and with the S&P 500 Index indicates that the share prices of Target are closely linked with movements in the S&P 500 Index while the share prices of Wal-Mart indicate a higher level of stability as compared to the share prices of Target and the fluctuations in the S&P 500 Index.
Company Overview
The financial analysis has been done on Target based on financial ratios and trend analysis of the company in comparison with Wal-Mart. Target is a retailing company with more than 1719 stores throughout several states of USA with the highest number of stores in the state of California which is 238. The business strategy in Target is to provide high quality products at competitive and attractive prices and increasing revenues through an online shopping portal. The average sales of the company in recent years are more than $60,000 million with average net income close to $2,500 million and average earnings per share nearly $3.13 per share (Target Corporation, 2009). Wal-Mart on the other hand is considered the largest retailer in the US and international market with over 8,000 retail outlets in 15 countries. Wal-Mart follows the same business strategy as Target which is to provide high quality products at the lowest possible prices. The average sales of the company in recent years is close to $370,000 million and average net income around $12,000 million with earnings per share around 3.07 per share on average (Wal-Mart Stores, 2009). The comparison of overall performance of the two companies indicates that though the revenues and net earnings of Wal-Mart are much higher than Target the average earnings per share of Target are slightly higher than Wal-Mart.
Graph Analysis
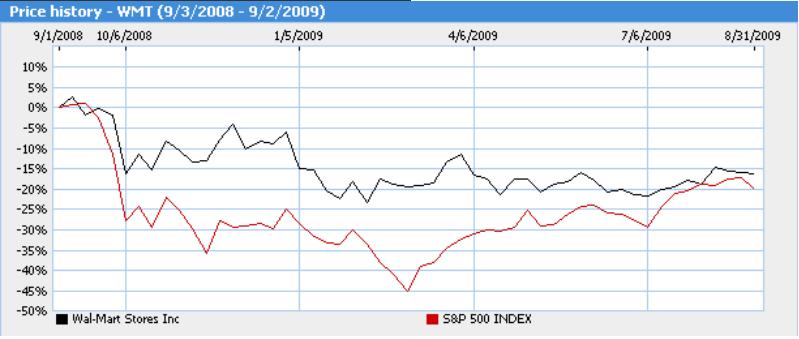
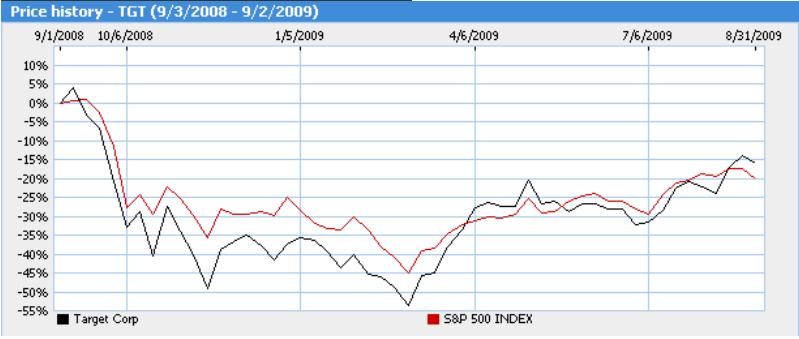
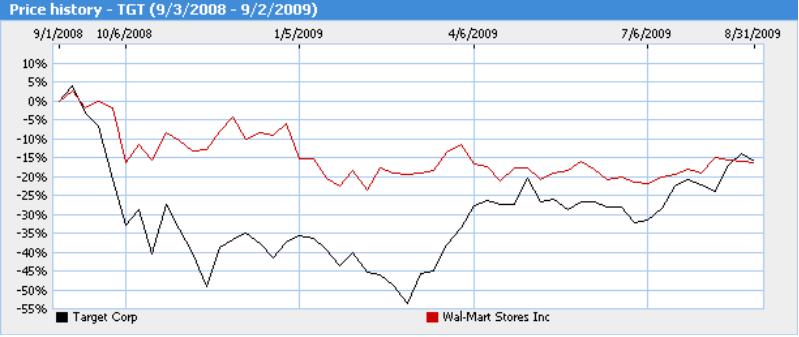
The share prices of Target Corporation and Wal-Mart Stores Inc. over a one year period are depicted in the following graphs in comparison with each other and with the S&P 500 Index. It can be seen clearly from the chart that the share prices of Target Corporation rise and fall in close relationship with the S&P 500 Index. Throughout the year the share price of the company rises and falls closely following the patterns of S&P 500 whereas after touching yearly low, share prices of the company rise slightly above the levels of the S&P 500 Index. The comparison of Wal-Mart with S&P 500 indicates that the share prices of Wal-Mart do not react significantly to moves in the index. Although the share prices of the company rise and fall with the Index but remain at quite a higher level than the index considering percentage change. It can be seen though at the end of the analyzed year that the share price becomes quite close to the levels of the S&P 500 Index. The comparison of share prices of two companies throughout the year indicates that share prices of Wal-Mart remain significantly above the levels of Target Corporation in percentage terms and a huge gap can be seen between the two share prices in the first six months of the year after which the change in share prices of the two companies narrows down to a negative change of 15 percent.
Wal-Mart and S&P 500 Index


Financial Ratio Analysis
The financial ratios of both companies have been calculated from financial data obtained from annual reports. The ratio analysis has been performed in four major areas of liquidity, asset management, debt management and profitability. The liquidity analysis consists of the current ratio, quick ratio and working capital ratio. All these ratios indicate higher levels of liquidity for Target Corporation and the company’s ability to meet short term obligations. The liquidity of Target Corporation is far better than Wal-Mart and all liquidity ratios of Target are almost two fold in value as compared to the ratios of Wal-Mart especially working capital which indicates a positive amount for Target and negative amount for Wal-Mart. The asset management ratios on the other hand paint a completely different picture for the two companies and indicate that Wal-Mart is quite efficient in asset management and inventory turnover, fixed asset turnover and total asset turnover of the company higher than Target. This means that the management of the company is quite effective in managing its current and noncurrent assets and these assets are utilized in business efficiently rather than wasted. The debt management ratios of the two companies indicate a similar pattern with the exception of interest coverage ratio which is quite high for Wal-Mart at a level of 12 as compared to 5.08 in Target. Investors, banks and financial institutions would prefer giving a loan to Wal-Mart rather than Target based on this interest coverage ratio. Profitability ratios are the most significant indicators for investment decisions as investors can easily predict the return on their investment and the level of risk and return on their investment. The profitability ratios relevant to investors and shareholders are profit margin, basic earning power of the company and earnings per share. The profit margin is 4 percent and 3 percent for Target and Wal-Mart respectively. The basic earning power on the other hand for Target is 10 percent and 14 percent for Wal-Mart. The most important indicator of earnings per share is 2.82 for Target and 3.39 for Wal-Mart which makes Wal-Mart a better choice for investment. The P/E ratio of both companies has been calculated based on the earning per share of the companies and it is at 16.69 for Target and 15.2 for Wal-Mart which makes Target a better choice for investors at a current share price of $47.01 as compared to the Wal-Mart share price of $51.57.
Table 1: Financial Ratios
Recommendation
The graph analysis and financial ratio analysis of both companies are reflective of the comparative strengths and weaknesses of the two companies. The graph analysis indicates that share price of Wal-Mart remain quite stable as compared to Target throughout the year. The financial ratio analysis indicates that Target is in a much better position with reference to liquidity and profitability while Wal-Mart is better in the areas of asset and debt management. If an investor requires fixed income or interest on investment Wal-Mart would be a far better option but quite risky as well due to low liquidity ratios. Target on the other hand would be a better option for direct investment in the company with an intention of dividend and capital gain. Although both companies are in a good financial position Wal-Mart is a better and viable option considering the long term growth prospects and overall strengths of the company.