Executive summary
This paper studies the phenomenon as to why the presence of huge amounts of oil in a country has not helped to transform their economies into prosperous ones. This paradox which is not apparent to most people has several reasons. There are several countries rich in oil that have developed or developing economies. There are others who are not rich in oil, but still have managed to have a well developed economy or is in the process of having one.
Then there is the paradox of countries rich in oil, but poor in economy. It is clear that it is not the presence of oil that is the criteria for development. There are many factors like polices, infrastructure, literacy, quality of labour force and a stable governance to achieve this. To study this, a general analysis is done and a further analysis of selected countries that appear to be in this category also is done. It is seen that the presence of oil is not a criteria for economic development. Certain relevant reasons that are responsible for this state of affairs are given. Also, suggestions as to how this might be corrected are also stated. The research methodology followed by reflections and conclusions is given at the end of this paper.
Introduction
To the general population the word ‘oil’ conjures up visions of riches and prosperity to any region that is blessed with an abundance of the product. Oil or petroleum, as everyone knows, called ‘liquid god’. So there would be a general assumption that all countries with rich oil resources are prosperous. This paper deals with facts that demystify that assumption, because in reality this is not the case. To highlight this point an example is given. The economic benefits of the new oil boom in many African nations have yet to reach the common man. A lot of money which could have been used for the economic welfare of the society is being wasted through squandering by the people concerned.
According to a report by the newspaper ‘Independent’ many African nations with a healthy GDP is not using the money in the best interests of the country. United Nations data shows Angola having a healthy per capita income, but according to the report, it is the worst performing state in Africa with respect to infant mortality. The country’s infant mortality rate up to 5 years is a shocking 25%, i.e. only four out of 5 children reach up to the age of five and beyond.
The nest biggest offender is Sierra Leon, followed by South Africa and Nigeria. It would be interesting to note that Angola and Nigeria are members of the OPEC. Bangladesh has a much better record than these countries. Corruption and political unrest are the major reasons for the unhealthy state of affairs. “Some of Africa’s biggest “success stories” are accused today of squandering money they could be using to help prevent millions of children dying.” (Butler 2008).
This is a situation that creates a paradox that can be titled ‘rich, but poor’.
The History of Oil
The general public has an assumption that oil is found in large caverns under the ground and once detected; it can be pumped out from underground. This assumption is false. Oil is found in the pores of rocks and it is the quantity of oil found in these rock beds that ultimately determine whether the oil found is commercially exploitable. Oil has been discovered more than 2000 years ago and ever since has been used for variety of purposes like cooking, transportation, power generation etc. apart from quantity, the quality of oil is also of importance in evaluating the richness of the well. Quality is ascertained by the percentage of sulfur found in the crude.
Crude low in sulfur content is of higher quality as is known as sweet crude and high sulfur content crude, considered to be of poorer quality is referred to as sour crude. Before the modern day technique of drilling for underground oil was discovered, people used it from seepages to the surface of the earth due to underground pressure. The commercial large scale exploration began almost 200 years ago in the US and is the forerunner of the giant high tech oil wells seen today. Before an analysis of facts, figures and the reason for the ‘rich, but poor phenomena, a summary of the world’s most powerful oil organization is appropriate.
The Organisation of Petroleum Exporting Countries (OPEC)
The OPEC was formed in 1960 in Baghdad, Iraq by its founder members consisting of Iran, Iraq, Kuwait, Saudi Arabia and Venezuela. Initially, its headquarters was situated in Geneva in Switzerland, but after a period of four years it was shifted to Vienna in Austria in 1965. Libya (Socialist Peoples Libyan Arab Jamahiriya) and Indonesia became members in 1962. The United Arab Emirates became a member in 1967, followed by Algeria in 1969. Nigeria entered the picture in 1971. Ecuador formed a part in OPEC in 1973, but it was expelled for a short period form 1992 to 1997, after which it rejoined in October 2007. Gabon joined in 1975, but lost its membership in 1994.
The latest entrant into this elite group was Angola which became a member in 2007. The organisation started with the five founder members and later on added another nine members. The present strength is thirteen since Gabon was expelled not taken back to till date. The organisation has three types of memberships, namely founder members, full members and associate members. Full members include the original five founder countries plus other countries whose membership has been approved by the OPEC. Associate members are admitted with certain conditions set by the organisation.
Then there are the observer members and the OPEC currently recognises Egypt, Sudan and Equatorial Guinea as such. With regard to controlling the price of crude oil, the OPEC is a powerful body. It sometimes decides to restrict crude oil output to maintain or hike the price of crude oil in the world market.
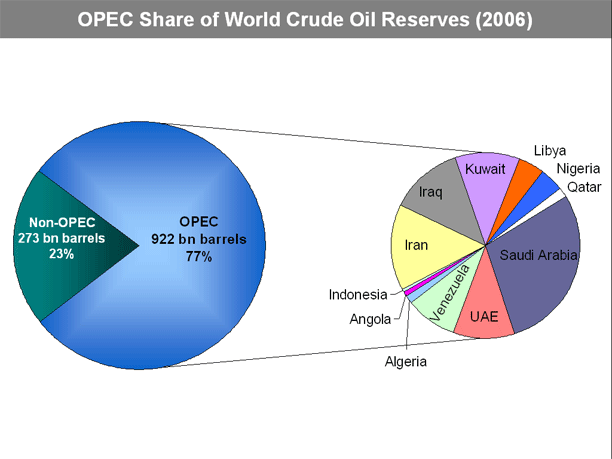
The power of OPEC in the world can be seen from the following estimate of crude oil reserves owned by OPEC and the rest of the oil producing world. “The OPEC Statute stipulates that: “any country with a substantial net export of crude petroleum, which has fundamentally similar interests to those of Member Countries, may become a Full Member of the Organization, if accepted by a majority of three-fourths of Full Members, including the concurring votes of all Founder Members.” (Who are OPEC Member Countries? 2007).
With today’s hunger for oil, the price and demand for the same is growing steadily. Both these factors indicate more wealth to nations who have these resources. Wealth leads to power, greed and corruption. Oil becomes inexplicably linked to politics and all these can create many problems for the economy otherwise.
Literature Review
In the industrial age oil was, and is a source of power for those who own or control it. The first instance when oil was used a ‘weapon’ was in the six day war when the oil producing countries of Saudi Arabia, Kuwait, Iraq and Libya put sanctions on selling oil to the United States and UK. The review first gives a picture of the world oil scenario, the major producers, exporters, consumers and importers and selects nine countries that fall into the category of oil rich, but poor. Certain social and economic indicators prevailing in each country is given, based on which the core analysis will be given.
Causes of poverty in oil rich economies
Exploration and extraction
Exploring and extracting usable oil reservoirs involves technology intensive operations and hence very expensive. This is another paradox of oil. Many countries rich in oil reserves do not have the funds to discover, let alone extract this resource and is one of the main reasons why many countries blessed with this abundance are unable to harness commercial gain from this. A large number of wells have to be explored and tested before a commercially viable one can be found. Chance or luck plays a major part in finding the right well.
Oil companies and the oil producing country – The early days
Many of the oil rich countries lost valuable earnings which could have been of enormous benefit because of the way by which oil exploration was carried out from the beginning of the nineteenth century. As mentioned earlier, most of the oil rich countries did not have the resources to exploit their oil reserves. In many instances the country was not even aware of the existence of oil on land and their territorial waters. It was up to the multi national oil companies to take up this task. Most major oil rich countries were, with the exception of a few, economically backward. Discovery of oil seepages to the surface made such countries aware of possible oil reserves.
Such countries were then approached by large oil companies and were made to accept their offer of exploring the find. The agreement generally would give the oil company a lease of up to 90 or 99 years and a percentage of profits ranging from 10 to 12% of the profits of the company. The end result was that the oil companies earned high profits from their concessions while the host country ended up with practically nothing. They also lost control of the oil fields till the lease period ended. Things began to change in the 1960 when the producer country woke up to this fact and agreements were made or changed that were more favourable to them.
In the 1950’s the Venezuelan government standard agreement was to allow an exploratory period of six years and a lease period of thirty years, a dramatic decrease form the ninety year leases of the early 1900’s. But the unease between the producers and the oil company remained which ultimately led to nationalizations which started after 1970, except for Mexico in 1938 and Russia in 1920. Utilised properly, such lost earnings could have transformed such economies into developed ones had the situation been more favourable to them. “Essentially, two situations occur simultaneously: the build-up of a country’s oil industry and the country’s build-up of frustration toward the oil companies.” (Falola & Genova 2005, p.46).
Corruption
Corruption has turned out to be the single biggest factor hampering economic welfare in the twenty first century. The injustice meted out to oil producing countries in the ninetieth century has all but disappeared. Corruption in such developing or underdeveloped economies is rampant in the government and bureaucracy. Transparency international has also given low score for in honesty in government to the following counties who are members of OPEC.
They are Angola, Iran, Iraq, Libya, and Venezuela A large proportion of benefits arising out of exploitation of natural resources is negated because the money is channelled to the hands of company executives, middlemen and government servants. “In these countries, public contracting in the oil sector is plagued by revenues vanishing into the pockets of western oil executives, middlemen and local officials,” Eigen said in the news release.” (Corruption Undermining Global Anti-Poverty Fight, Group Says. 2004). It has been estimated by the Berlin based Transparency International that governments worldwide loose about USD 400 million in because of rampant corruption.. It was not that corruption started after investment involved in oil exploration started to come in. This practice had existed even before that.
Developing economies worldwide lack transparency in operations. A lack of transparency lessens the chance of being apprehended for corruption charges. This lowered risk in turn encourages corruption Incentives for honest behaviour is outweighed by the prospect of earning more through accepting bribes. This situation is further hampered by the fact that in such situations, selection of honest officials and investing companies become difficult. Resource rich countries face another problem that encourages corruption. Such a country will be focused more on exploitation of resources than other methods of economic growth like developing skills and industrialisation. Exploiting natural resources requires a large number of unskilled workers, but few numbers of skilled workers. This will result in high disparity of income which promotes corruption.
Damages to rural areas
Oil wells may be found on land or under sea beds. Undersea exploration causes little or no disturbances in the life of the common man. But land based wells, depending on its location, could be found near populated areas like villages and small towns. Presence of oil in close proximity to large cities prevents its exploration because of the massive relocating involved. But this is not so in the case with villages where people have no means of protest. Explorations near villages can cause disruptions and damages to the village community collectively or individually
Nigeria – A case study
A few instances of the consequences of oil drilling operation in Nigeria is given so as to illustrate the point abut how village communities are negatively affected by such operations. In the first case, the supposed damage was caused by underground blasts for conducting seismic surveys by the oil company. The plaintiff claimed that certain buildings in the village were damaged as a result of such explosions. A representative from the oil company inspected the site and agreed that some damage had occurred. The company retracted its stand in court and denied that any such damage had occurred.
The lower court ordered the company to pay damages, but this order was later reversed by the Supreme Court and consequently no damages were paid. In another instance, damage to ponds and well caused by dumping of oil waste caused extensive damage to plant life and the aggrieved persons had to approach the court to claim damages. Construction of approach roads to and from the drilling site, clearing of vegetation used for agricultural or grazing by the villages are other problems that oil exploration causes to village communities. Getting a court verdict in the villager’s favour is time consuming and most of them do not have the resources or knowledge to go about it.
Proving and assessing the damage is again a problem for the villagers. Apart from the damage caused none of the villagers benefit in any way by the presence of these companies.” But the case suggests that, even if the damage has convincingly been proven in court, oil companies may continue to adversely affect village communities without paying compensation.” (Frynas 2000, P.162).
Intellectual Capital: Intellectual capital refers to the quality of labour available in a country. This is turn is dependent on the quality of education that a country is able to provide for its citizens. Lack of centres of higher education will result in the country being saddled with unskilled labour that is unqualified for technical work. As mentioned earlier, exploitation of natural resources requires more unskilled labour than skilled. An oil rich country is not motivated to create a pool of skilled labour, since money would come into the economy even with the existing quality of its labour force. Moreover, setting up institutions for technical learning involves long term investment and vision, and monetary returns for the same would take at least a decade to become a reality.
This is evident when economies of countries like Korea and Japan are compared with those of Nigeria and Angola. Both the former countries are not resource rich, but have economies that are far more advanced than those of the two African States. “Surprisingly, nations with few natural resources demonstrate greater economic growth rates than OPEC countries. Japan’s economic growth, driven by technological superiority, outpaces that of Saudi Arabia; South Korea is growing faster than oil-rich Nigeria; and Taiwan’s economy has moved well beyond that of oil-rich Venezuela.” (Emeagwali 2007).
Technology
Most oil rich or resource rich economies that still remain poor are unwilling or unable to invest in technology and research. This result in unavoidable out souring of technology, as and when the need arises, resilitn in more resources have to be spent. This would not have been the case if they had a highly skilled or qualified labour. As revenues form oil sales increase, expenditure for infrastructure development will also increase.
But all technical expertise required for this will have to purchase at higher cost form other countries. Even relatively prosperous economies like Saudi Arabia and Kuwait, two countries rich in oil reserves spend very little of their GDP on research. This is because they feel that they have enough capital that can be generated though its available oil reserves. “Saudi Arabia, Qatar and Kuwait spend about 0.2% of their gross domestic product (GDP) on science — less than one-tenth of the developed-country average of 2.3% and about a third of that spent by less wealthy Iran.” (Giles 2006).
Wastage of natural gas
Many oil producing countries waste natural gas the extremely valuable by-product of crude oil production. It is estimated that all the oil producing countries waste about 150 billion cubic meters of gas annually. This figure is comes up to 25% of gas consumption in the United States and 30% of gas consumption of the European Union. A close cooperation between the respective governments and the industry has to be worked to be able to make use of this gas instead of it being burned or flared off. This gas if utilized properly could be used for domestic proposes, a major source of energy for households in many developing countries, thus bringing revenue for the producers.
This is part from helping to reduce harmful emissions that contribute to global warming. Even though some attempts have been made to find a solution, not much progress has been made. “About 300 representatives from major oil producing countries and companies are coming together for the next two and a half days to share best practices, learn about new technologies and identify opportunities for further gas commercialization and market development that will allow them to reduce the burning or flaring of natural gas.” (Oil Producing Countries, Companies Need to Step up Efforts in Reducing Gas Flaring. 2006).
The World Oil Scenario: A list of the top fourteen oil producers, their exports, consumption, and imports are given below.
Top World Oil Producers, Exporters, Consumers, and Importers, 2006 (Millions of barrels per day).
It can be seen that Saudi Arabia is retains the top spot, both in terms of production and exports. In terms of consumption it holds 10th place. It does not import any oil. The country does not import any oil. Russia is the second largest producer and exporter and holds fourth place in terms of consumption. This indicates that both the above countries have surplus production and is earning considerable revenues through export of oil.
The United States is the third largest producer. But its energy requirements are so huge that it is forced to import oil and achieves the number one position among oil importers. It is also the number one consumer of oil in the world. This shows the enormous power and size of the US economy. Iran is the fourth largest producer and retains the same position for exports also. It does not figure among the top consumers of the world indicating a low level of industrial development. Mexico does not import any oil. Mexico comes at number five in terms of production and number ten in terms of exports. It shows that its economy is big enough to warrant a big consumption of oil. In terms of consumption it ranks eleventh below Saudi Arabia, but has enough surplus to eliminate the need for import.
China stands at sixth place in terms of production, but like the US, it is unable to export any of the same. China is the second largest consumer and the third largest importer. Canada is at seventh place in production and due to its requirements does not have surplus oil to export. It ranks seventh in terms of consumption, showing that it is self sufficient in this area. The United Arab Emirates (Abu Dhabi, Ajman, Dubai, Fujaira, Ras el Khaimah, Sharjah and Umm al-Qaiwain) is the eighth largest producer and sixth largest exporter. It does not figure in the list of top consumers and importers. The ninth largest producer is Venezuela and is the sixth largest exporter. It is not a top consumer and does not import oil. Norway it the tenth largest producer and third largest exporter. This country is not a major consumer and does not import oil.
Kuwait holds eleventh position among producers and seventh position in exports. It is not a major consumer and also not an importer. Nigeria stands at twelfth place in production and eight place in exports. It is not a major consumer an imports no oil. Brazil is the thirteenth largest producer, but does not export oil. It is the eight largest consumer, but is at present self sufficient in oil. The last place among the top fourteen major producers is occupied by Iraq. It used to be the twelfth largest exporter, but the invasion of the US and coalition forces have the changed the equation, at least for the time being.. Iraq has sufficient oil not t warrant an import, but does not figure among top consumers.
The following is the abstract from the above table of countries who figure in the list of top exporters, but is not among the top producers. This is an indication of extremely low oil requirements. The top place in exports in this category is Algeria, and is the ninth largest exporter in the world. This is followed by Libya at 11th place, Angola at thirteenth place and Kazakhstan at fourteenth place. None of these countries are top consumers nor do they import any oil.
Next a list of top consumers and importer who are not in the list of major producers is given. In terms of consumption, Germany ranks fifth, followed by India at number six. The ninth largest consumer is South Korea, and France and Italy holds twelfth and fourteenth positions.
Another category is a list of countries who are not major producers, but figure among the top importers. Japan holds the top spot in this category and is the second largest importer after the US. Germany comes next at fourth spot and South Korea at 5th place. India, Italy, Spain and Taiwan hold the next positions in that order.
A critical analysis
Oil Consumption
Requirement for oil is an indication of consumption requirements, which in turn is an indication of economic activity. So a high requirement of oil indicates that the nation is either industrially and technically advanced or is going though this process. The purpose of this analysis is to select countries that seem to fall into the category of ‘oil rich, but poor’ economies for the purpose of individual study.
It is interesting to note that out of the top fourteen consumers, eight are not among the top producers. Those countries are Japan, Germany, India, South Korea, France, UK and Italy. This is again a proof that being resource rich is not a prerequisite for economic growth. One nation that stands part here is India because all the rest fall in the category of advanced economies. This indicates that even though India is not an oil rich country, it does not stand in the way of economic growth.
The first criteria is to select countries that are among the top producers but do not figure in the list of top consumers. They are Iran, Iraq, UAE, Venezuela, Norway, Kuwait, and Nigeria. Norway can be excluded because it is an advanced economy. This indicates that all the other countries, namely Iran, UAE, Venezuela, Kuwait and Nigeria do not have much demand for oil, and hence low industrialisation.
The second criteria is to list countries that do not feature as top producers, but can be found in the list of tope exporters. It indicates that those countries have moderate production, but still have surplus oil to export, here again indicating low industrialisation and advancement. They are Algeria, Libya, Angola and Kazakhstan.
To sum, selection has been made in the manner given next.
- Countries who are among the top producers, but do not appear in the category of high consumers. The countries are Iran, UAE, Venezuela and Nigeria. (Norway and Kuwait eliminated for reasons given above). The UAE is not taken up because it is a conglomeration of small independent countries.
- Moderate producers of oil (that do not appear in the top producers list), but feature among top exporters list. The countries are Algeria, Libya, Angola and Kazakhstan. Kazakhstan is not included because it is a relatively young country.
- This selection can be further validated buy the table given below. The table shows how dependent these countries are on petroleum exports for running their economy. Countries having more than 50 % dependence are selected. Saudi Arabia is not selected because it features in the list of high consumers. It can be seen that the only country not included in the list is Qatar. So this country too has been included for individual study.
The final list comprises of Libya, Kuwait, Iran, Nigeria, Iraq, Venezuela, Qatar, Algeria, and Angola
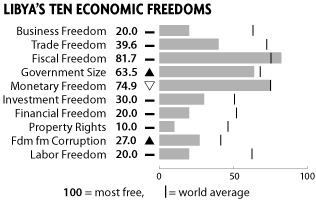
Libya is a dictatorship and its economy is strictly government controlled in this country. Business freedom in Libya is very low at 20%. This means that free enterprise is limited which results in accumulation of wealth in the hands of the few who manage to run private institutions. Its trade freedom at 39% is below average mainly due to its high import restrictions. Taxes are extremely low, with the highest rate being just 15%, and this accounts for its very high rank in fiscal freedom.
Government expenditure is very high coming up to 34 % of its total GDP. Inflation is low at about 2 and a half percent per annum and hence its high monetary freedom. Investment freedom is relatively low due to heavy restrictions on FDI. Property rights score is very low because very little property is privately owned and there is always the risk of government nationalising property. Private practice of law is banned. Corruption is very high indicated by its low score of 27. High restrictions on employment make job seeking difficult and unemployment levels are very high.
Kuwait
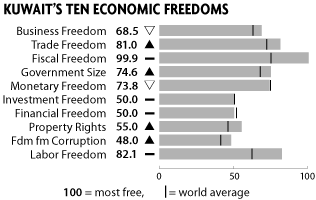
The economic indicators of Kuwait do not make it appear to be oil rich but poor. There is reasonable business freedom and very high trade freedom. With zero income tax, its fiscal freedom is one of the highest in the world. Corruption is quite high. Fiscal freedom is high due to heavy government spending up to 29 % of its GDP. Foreign investment is very relaxed in some area like water, power generation, communication, tourism etc. Monetary freedom is very favourable due to low inflation rates of around 3%. With few restrictions on labour, the country’s labour freedom is high at 82%.
Iran
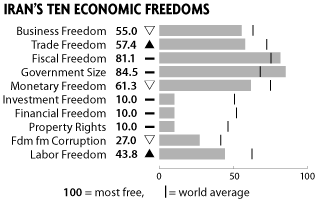
Starting private enterprises is quite restricted which given this country an economic freedom of 55%. Import restrictions, high tariffs cumbersome regulations etc give Iran a moderate score of 57% in Trade freedom. Fiscal freedom is low due to a reasonably heavy rate of personal income tax and it stands at 81%. Heavy government spending of up to 22% of GDP gives a very high value on Government size which stands at 81%.
Investment freedom is low and many areas are restricted. Privatisation is not encouraged which gives it a low score of 10%. There is no private banking sector in Iran, and percentage of credit by money lenders is high. Low respect for intellectual property rights and ineffectual legal system gives a low score of 10% in property rights. Corruption levels are high, indicated by a low score of 27%. Labour is highly regulated and finding employment is difficult, which gives the country a relatively low score of 43.8%
Nigeria
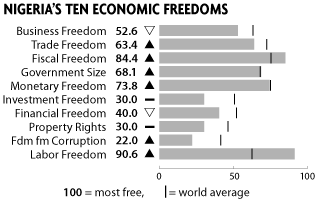
Existence of restrictions on starting private enterprises gives a average score of just 52.6% for Business Freedom. Even with liberated foreign trade policies, high duties, lack of uniform policies etc gives Nigeria an average score of 63.4%. Reasonable tax rates give Nigeria a high score of 84% in fiscal freedom. Government spending of 32.6% of GDP is quite high and government size gets a score of 68.1% only.
High inflation, unstable prices and lack of market mechanisms gives a poor score of 73% for monetary freedom. 100% FDI is allowed only for oil industry. Corruption, poorly formulated laws, infrastructural problems, violence etc gives a low score of just 30% for investment freedom. Reasonable availability of credit gives this country a score of 40% for financial freedom. Problems in the legal system like delays, corruption etc has been the reason of a low score for property rights. Rampant corruption is the reason for a score of just 22% in freedom from corruption. Very low restrictions of labour gives Nigeria a high score of 90.5%
Iraq
The ten economic freedoms cannot be given because it is unavailable due to political problems existing in that country. A run through without corresponding figures is given here. Moreover this is not the appropriate time to grade this country because of the nature of the problems faced by this country is not long lasting. Private investment situation has improved slightly, but there is room for improvement. Business freedom cannot be judged accurately, but trade tariffs are low at can give this high ranking for trade freedom. The current rate of direct tax is fixed at 15% which would give Iraq a high score for fiscal freedom.
But it cannot be estimated as to the rates that might be fixed, once normality returns to the region. Current government spending is estimated at 95% of GDP and will affect Government size negatively. This figure cannot be considered as realistic since heavy spending is inevitable for rebuilding this country. Understandably high rates of inflation of 46% exist in Iraq. Even though this is not a long term trend, this figure would negatively affect its monetary freedom.
Investment freedom should be very high because of the need for FDI in Iraq is required for reconstruction. New policies on banking and finance could positively affect its financial freedom At this juncture, property freedom cannot be judged even with a fair degree of accuracy. Even though no figures are available, existence of corruption is very high. Labour freedom could get a high rank because of the need for labour for ongoing projects will force any nation to ease its labour laws.
Venezuela
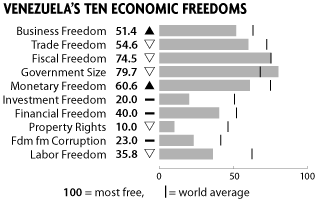
Restrictions on starting private enterprises is very high in that country, resulting in a poor score of 51.4%. Trade freedom at 54.6% is low due to corruption, lack of transparency, adverse tariffs, confusing labelling regulations etc. A high personal tax rate of 34% has given a bad score of 74.5% for fiscal freedom in Venezuela. High inflation rates of 14.9%, coupled with high protection to agricultural prices give an adverse score of 60% for monetary freedom. FDI policies are not investor friendly. There is also a risk of nationalisation of companies engaged in exploitation of natural resources exits. FDI of only 20% is allowed in many areas.
There are also regulations on the number of foreign workers employable in hat country. All this gives a very low score of just 20% for investment freedom. Even though there are private financial institutions in that country financial freedom gets a score of just 40%. Government controls as to the areas of finance is causing problems and the number of foreign banks operating in that country is coming down. Holding of private property is difficult, there is low respect for intellectual property rights and partiality towards foreigners in its legal system has given a low score of just 10% for property rights,. Corruption levels are high indicated by the low score of just 23%. Rigid regulations regarding labour has restricted job opportunities and its score regarding labour freedom is just 35%.
Qatar
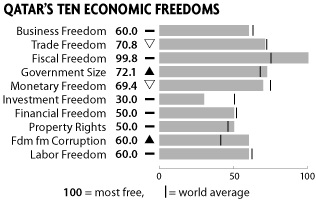
Reasonably heavy restrictions as to starting private enterprises gives a modest score of 60% for business freedom. Even with high tariffs, restrictions and strict regulation a score of 70% for trade freedom exists in Qatar. Like most Gulf States, Qatar too enjoys a very high fiscal freedom of 99.8% mainly due to the absence of direct taxes. Government spending of more than 30% of total GDP has given an adverse figure of 72.1% for government size. Even with price controls, inflation is high at 10.6% giving this country moderate monetary freedom f69.4%. 100% FDI is permitted in areas like agriculture, tourism, health etc.
The government has strict controls as to ownership of share in Qatari companies to prevent take over and share of ownership in local commonages is limited to 49%. Heavy infrastructure areas like steel do not allow FDI. All these restrict the country’s investment freedom to just 30%. Qatar’s strict foreign policy and economic policies that are comparable to international standards have given financial freedom a score of 50%. Problems in the legal system, like bias towards locals, lethargy and legal bureaucracy has given a moderate score of 50% for property rights. Qatar is reasonably corruption free. Even though transparency is a problem, freedom form corruption gets a decent score of 60%. Points like lack of minimum wage restrictions and the presence of a large number of worker from other countries gives a good score of 60% for labour freedom.
Algeria
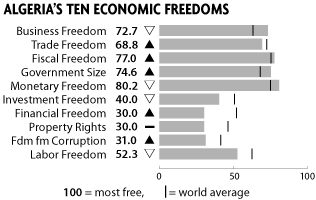
High protection is given to investors who start business in Algeria. Even though getting licenses is quite difficult the score for business freedom is quite high at 72.7%. Trade tariffs are quite high at 10.6%. Attempts are being made to bring about a better investment atmosphere. Procedures are cumbersome and time consuming and all of these give Algeria a trade freedom of 68.8%. Algeria’s personal tax rate is high at 40% and its corporate tax rate is an attractive 25%.
This gives a score of 77% for fiscal freedom. Government spending is 29% of GDP and this gives government size a score of 74.6%. Inflation rate is very low at just 2.5% and price satiability mainly through subsidies and government interference exists. This gives monetary freedom a high score of 80.2%. Procedural difficulties give Algeria a relatively low Investment freedom score of just 40%. Heavy regulation and interference in the financial sector gives a low score for financial freedom at 20%. Inefficiency of the judiciary gives low score in fiscal freedom which stands at 30%. Corruption levels are high and as a result score for freedom form corruption is only 31%. Rigid regulations of labour are obstructing employment opportunities. The score for labour freedom is a moderate 52.3%
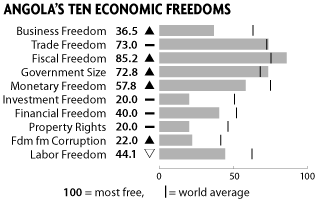
Angola
Obstructions to set up business in Angola are very high and hence it gets only a low score of 36.5% for business freedom. The country’s trade tariffs are low at 6%. But other difficulties such are obstructive regulations and lack of transparency exist. The score for trade freedom is a healthy 73%. Low personal tax of 15% and corporate tax of 35% gives fiscal freedom a high score of 85.2%. With government spending at 30% of GDP, the score given for government size is 72.8%.
High rate of inflation at 18% and unstable prices gives a low score of 57.8% to monetary freedom. Strict laws with regard to capital and market, requirement of local labour in foreign owned companies and other problems give a very low score of just 20% to investment freedom. An undeveloped financial market has given a score of 40% for financial freedom. A weak legal system again is not in favour of Angola. Property rights just gats a score of 22%. Rigid employment regulations are also a negative factor and it gets only a score of 44.1% for labour freedom.
Critical Analysis
It can be seen that there are certain factors that are common among all these economies. The over riding factor is freedom form corruption which is high in all these countries except for Qatar and Kuwait. This is understandable, because both Kuwait and Qatar are Muslim nations governed by strict personal laws. Business freedom is the highest in Algeria at 72% and lowest in Libya at 20%. Almost all courtiers have high fiscal freedom due to low or absence of personal taxes.
Government spending is high in most countries and these shows in the levels of high values given to government size. Monetary freedom is good in most countries with most of them having low levels of inflation. This could also be due to government interference in price fixing. Investment atmosphere is not very conducive in all cases and this could be why investment other than in oil is not being done. Financial freedom is also poor due to difficulty in obtaining credit. Problems in the legal system like corruption and bias are high and this shows in low scores for all countries. Labor freedom is poor except for Nigeria and Kuwait.
At this stage the ‘economic freedoms’ of a developed nation can be analysed with those of the above countries.
Japan
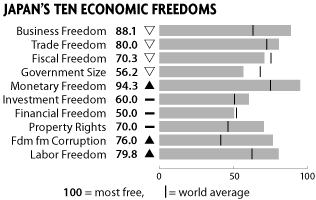
Japan was selected because it is not an oil rich country. To start a business in Japan takes only about 17 days when compared to the world average of 34 days. Businesses are well protected and this gives business freedom in Japan a score of 88%. With very low trade tariffs of 2.5%, the trade freedom gets a score of 80%. The only thing that is unfavourable in Japan when compared to the other nations is the tax rates which are quite high at 35% and which may even go up to 50%. Fiscal freedom is rated low in comparison to the fiscal freedom of the above countries at 70%. Inflation in Japan is as low as.01%, which gives as score of 94% for monetary freedom.
High government and lack of transparency gives financial freedom a low score of only 60%. Foreign investment is welcomed in Japan, but takeover of Japanese firms is difficult and investment freedom is only at par with other countries. The legal system in Japan is efficient and non discriminatory and hence a high score of 70 is given to property rights. Corruption levels in Japan are low and freedom from corruption gets a high score of 70%. Lack of rigid regulations on labour gives a score of 79.8% to labour freedom. So, freedom to start a business, trade and import tariffs, levels of inflation, the legal system, lack of corruption and restrictions of labour are strong motivators for both private and foreign investment.
Now an example of a poor or developing economy that is not oil rich can be compared with the same set of parameters. From that comparison, it will become clear that these parameters are not the only criteria for economic growth.
India
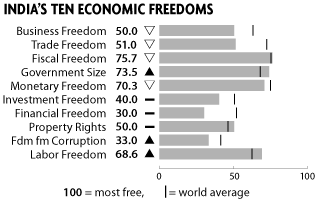
India is a developing nation and is not oil rich. But it figures among the top consumers of oil. We can see from the parameters that India does not fare off much better or worse when compared with the oil rich nations. It indicates that there are more reasons as to why an economy is rich, developing or poor. Considerable restrictions still exist as to starting a business in India and it receives a low score of only 50%. High tariffs of 14.5% give trade freedom a poor 51%. A rate of 30 to 33% is taxed on direct income. This gives a reasonably good score of 75.7% to fiscal freedom. Government spending is high and comes up to 29.7% of GDP and its score on government size is 73.5%.
With low rate of inflation at 5.4% gives a score of 70% for monetary freedom. Finance is controlled largely by state owned banks and existence of restrictions on foreign banks gives a poor score of only 30% to financial freedom. Complex regulations and restrictions of FDI restrict the score to 40% for investment freedom. Delay in reaching legal decisions and a huge backlog of unresolved cases gives a score of only 50% to property rights. Corruption levels are high and freedom from corruption gets a score of just 33%. Labour freedom stand at 68.6% because labour regulations are not very rigid.
This clearly indicates that there are other factors that are critical for economic development. In this instance, India scores on these points rather than on the indicators given above.
How the BRIC economies prove this assumption
Pace of economic growth has shifted for west and south East Asia to other regions and this pace is not related to a particular region. The term BRIC was coined by Goldman Sachs to include the four fastest growing economies of the world. It was done after a study of the four economies by Goldman Sachs in 2003. BRIC is the acronym derived from the first letter of the alphabet of the countries, Brazil, Russia, India and China. The report does not specify the presence of oil or other natural resources as a criterion for growth and the presence of Brazil, China and Russia is not because of reasons other than oil. A brief look at the four countries would be appropriate.
India
It is surprising to know that the Indian Economy was the second largest economy in the world during the time of the industrial revolution. India could produce 20% of world output during those days (1770’). During the early 1970’s its share of global output was only 3%.
This shocking slip was mainly due to policies that were myopic in nature, stressing on undue protection for domestic business. Ever since 1984 when this country started its open door policy things began to change for the better. Adaptability to rinsing international expectations, better infrastructure and a visionary policy were the factors that contribute have been critical in the turnaround. “From 2007 to 2020, India’s GDP per capita in US Dollar terms will quadruple (one-third higher than the original BRICs projections). Indians will also consume about five times more cars (up from 3.5 times) and three times more crude oil (up from 2.3 times).” (India’s rising growth potential. 2007).
Russia
After the collapse of the Soviet Union, the economy of Russia was in shambles. There was rampant corruption, economic slowdown, and very high levels of organized crime. This change in the state of affairs started with Gorbachev’s Glasnost and Perestroika and continued during Yeltsin’s presidency. Things began to change with the advent of Vladimir Putin whose strength and vision has helped to correct the downward trend and move the nations on a path of economic stability and growth.
Putin was a man who had the support of the public and was man who could grasp and understand the workings of the market. It was his effort that changed the outlook of Duma, the Russian parliament, on market reforms resulting the turnaround seen in Russia today. “He immediately began to reverse the political pluralism that had frustrated many of his predecessor’s efforts at reform and had contributed to the breakdown of central state authority.” (Russia: A smooth political transition. 2007, p. 29).
China
Like the former Soviet Union, China is a strong follower of communist ideals. event though it still remains a communist country, the economic reforms initiated by the Chinese government was instrumental in opening up the Chinese economy and fuelling the rapid growth seen in Chins today. The rate of investment in China has been such that many experts fear that this country may not be able to keep up the pace of reforms, mainly due to the increase of non-performing loans. “One of the most widely-held misconceptions about China is that the economy contains an
over-investment time-bomb, which will soon result in a sharp correction in both investment and GDP growth, resulting in rising non-performing loans (NPLs) and in deflation.” (China’s investment strength is sustainable. 2006, p.61).
Brazil
When compared to the growth rate of the other three economies, their rate of growth is Brazil was not up to expectations. This was the opinion of Goldman Sachs, when current growth rates were compared to the study conducted in 2003. But there appears to be a valid reason for this under performance. Brazil has been laying heavy stress on market stability at macro levels, which is an important factor for economic growth. So this situation could improve after a while. Like the other BRIC economies, the change came about through the implementation of forward looking market reforms. “The main reason for Brazil’s underperformance is that, until now, the government had been in the process of implementing a stabilisation programme, with a view to achieving macroeconomic stability.” (The. B. in bricks: unlocking Brazil’s growth potential. 2006, P. 75).
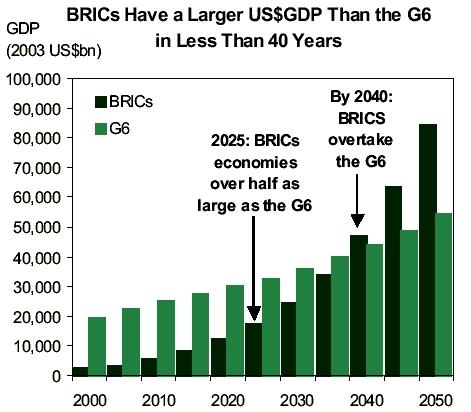
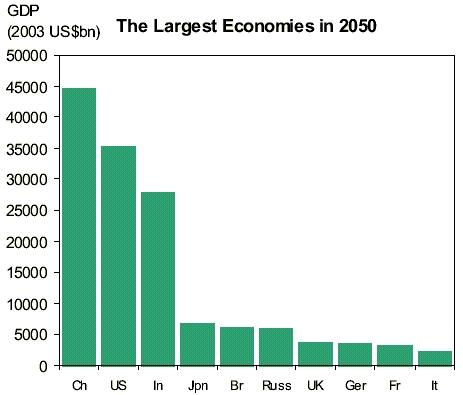
Two charts showing the potential growth of these economies by the year 2050 is given below: The fist graph shows how the BRIV economies will compare with the economy of the G6 nations (United States, Japan, United Kingdom, Germany, France and Italy)
The second graph shows how the individual BRIC countries will compare with the individual nations comprising the G6 nations.
The criteria for economic growth
It is quite clear that the criteria for economic growth and prosperity are not the availability of natural resources like oil. This part deals with many of the necessities of economic growth that has been followed by many countries that have been proved successful. If the oil rich economies can emulate it , they too can reap the rewards of growth with the additional advantages of the huge natural resources they have been blessed with. The next common thread is low business freedom with Libya having the lowest freedom at just 20%. The highest freedom in this category goes to Angola at 73% closely followed by Algeria at 72%.
Economic policies
The most important factor that determines the growth of an economy is the type of economic policy that is followed by that country. Economic policies include both domestic and foreign policies. The last decade has seen a massive change in the policies of many nations, especially in the areas of foreign direct investment. Many other factors like the collapse of the Soviet Union and the unification of Germany has had an impact on the rest of the world, financially, politically and ideologically. The fall of the Soviet Union speeded up the change in economic polices of China to an area that is favourable for attracting foreign direct investment. China has been a communist country with rigid domestic and foreign policies for a long time. Even without changing its communist government, China has been able to bring about massive change to it economy. The formation of the European Union is another example of how countries are forming regional groups in pursuit of economic and political stability.
Infrastructure
One important factor that needs to be present is the right infrastructure that will attract investment, both domestic and foreign. There should be adequate, power, facilities for transportation like roads and railway, availability of problem free land for biding factories and other business institutions, availability of finance, a strong judicial system and a qualified and professional work force.
Domestic Policy
Domestic policies have an important bearing on economic growth. Policies should be formulated in such a way that it encourages private participation. Private participation is essential for distributing of the nations wealth among its citizens. An atmosphere that encourages private participation and growth will ensure that new entrepreneurs are created. This will pave the way for job opportunities which will further the economic well being of its citizens. A vibrant bureaucracy is required to ensure that investors are not discouraged. Labour laws should be formulated or changed so as to create a hassle free atmosphere, advantageous to both the explorers and employees.
Foreign Policy and Foreign Direct Investment
Once infrastructure is in place and an environment for investment is created, a country is ready to attract foreign direct investment. It can be seen from the experience of the BRIC economies to understand the importance of FDI. Some of the FDI policies followed by these economies will highlight the reasons that caused the inflow of high amounts into these countries. For example, India was a country which had strict laws regarding the entry of multinational and import of foreign good. A high level of protectionism was given to the local industry. This was a policy that it followed right from its independence to the early 1980’s.
The policy now followed by India is to allow FDI in most of the sectors of business. It even allows such investment in certain areas without government approval. “Major initiatives such as industrial decontrol, simplification of investment procedures, enactment of competition law, liberalisation of trade policy, full commitment to safeguarding intellectual property rights, financial sector reforms, liberalisation of exchange regulations etc., have been taken, which provide a liberal, attractive, and investor friendly investment climate.” (Investing in India. 2004). China also allows 100% FDI in many sectors.
Investment is allowed in the form of joint ventures, cooperatives, and even companies whose equity is fully owned by foreign companies. Is to that country’s economic advantage that almost 85% of all foreign direct investment is in the manufacturing sector. . “A majority of FDI has gone into the manufacturing industry because China possesses a competitive edge thanks to its lower costs of production and relatively powerful ability to supply supporting parts.” (Long).
The biggest advantage of foreign direct investment is that apart from receiving a steady flow of capital, infrastructure creation will also be done. Allowing of special tax incentives and forming special economic zones are steps that can attract FDI.
Stable Government
It is imperative to have stable governance to lay a foundation for economic growth. Many of the oil rich economies were until recently ruled by foreign powers. Most countries achieved independence by the start of the 1900’s and in some instances, even later. So they had had not much experience in democratically elected way of governing. Again some of these countries had a situation where dictatorships followed dictatorships.
In such a situation, it is no surprise to find a lack of stable governance. Only a strong government can enforce and maintain the necessary change that will result form an investor friendly policy, by not bowing down to internal and external pressures. A lack of stable governance will make investors unsure as to how secure their investment will be in the long run. Heavy investments need long periods to fruity into results and hence a feeling of security for the investors can only be achieved trough stability. It does not really matter whether the form of governance is monarchy, democracy or dictatorships, even though history shows a poor record of economic growth for dictatorships.
Qualified labour force
This is an important factor for attracting investments as a forerunner for economic growth. Investments without the required quality of labour will result in the country being forced to bring in expatriate labour form other countries. Such a situating will not be beneficial to creating job opportunities within the country. The infrastructure development that followed the oil boom in the gulf during the 1970,s is an example,. Lack of qualified man power in that case created an influx of skilled and semi skilled labour to the Gulf region from India, China and other developing countries from Asia.
Education
In order to create a pool of qualified labour, institutions of higher learning have to be created. This would not be problem since most of the oil rich economies do have large reserves of cash, or at least, are in a position to get capital by exploitation of their oil reserves. Otherwise, people will have to be sent to other countries where such facilities exist, at high cost and with government help. This method is expensive and not practical to create a large numbers of quality labour. Along with initiative of creating centres of high learning, primary and basic education facilities will have to be created. People, especially those from rural areas have to be encouraged to send their children to school. This is a long term goal, but there is no alternative to this policy. China and India are aggressively perusing such a policy.
Age of the population
Aggressive economic growth requires a young country. This means that the proportion of youth and middle aged people should be higher than the number of senior citizens. This is important in the sense that it is easier to train younger people. Moreover with cost of training remaining the same, the average period of service derived form younger people will be much more than from what is got from older people. With shorter service periods, the frequency of training will be much more, resulting in increased expenditure.
Bringing down corruption
It has been mentioned at the start of this paper that one of the factors of poverty in oil rich countries is the high levels of corruption that exists there. Corruption will divert funds that have been earmarked for such poverty alleviation programs into the hand of corrupt officials. If the funds marked for projects do not ultimately come down to the level of the common man, the effectiveness of such programmes will be low. High levels of corruption will result in a situation where by companies will be forced to incorporate the cost of corruption onto their goods and services. This higher cost will ultimately be borne by the consumers living in the country. It also implies lower profits for businessmen, which may discourage investment in the future.
Transparency
Low levels of transparency are a factor that is common to almost all the ‘oil rich, but poor’ countries. Such a situation will help in creating an atmosphere of suspicion among potential investors. But achieving a combination of low corruption and high transparency is difficult, especially in resource rich counties. But this has not been too serious an issue, since heavy inflow of foreign funds has happened in China and India, where the above mentioned situation exists to a high degree.
Taxation
As shown earlier there is high level of fiscal freedom due to the tax structure prevailing there. Provisions for moderate taxation will bring for funds to the government for development purposes.
Oil Conflicts
Oil as a commodity is extremely powerful. Almost every country in the world is dependent on oil, some more than others. The more industrialised an economy is, the more oil it needs. This can be seen from the fact that the United States is the world’s largest consumer of oil. In a non industrialised advanced nation like Switzerland, oil consumption is relatively low. In any case, the need for oil has given rose to conflicts since the beginning of the twentieth century. Some conflicts are regional in nature and have implications for that region only. The invasion of Kuwait by Iraq is an example. Such events become a concern of the whole world if the conquering country decided as to who the oil be sold.
It can stop oil being sold to countries that are perceived enemies. The reaction to the invasion by the United States is an instance of this situation. The US, knowing that if Iraq had control over Kuwait’s oil, knew that oil supplies form from Kuwait to the US could be stopped by Iraq. This would have developed into a serious situation for the US and would have sparked off an energy crisis in that nation. The power of oil is such that nations can go to war with each other. It is clear availability of oil is more important than the consequences of a war. There are two basic reasons why countries go to war with each other. The first reason is that it is essential to fuel an industrialised economy and the second reason is that countries with high military power need oil to run the military. The war with the United States had cost the Iraqi nation and its people dearly.
Funds that could have been deployed for humanitarian and other development; purposes had to be diverted for the war effort and the subsequent reconstruction of the nation. Such conflicts have occurred in other parts of the world like Nigeria, Sudan etc. and such conflicts have proven to be costly to the economic development of the economy. “Conflict over the control of valuable oil supplies has been a persistent feature of international affairs since the beginning of the 20th century.” (Oil Conflicts. 2004).
Theoretical framework
Oil is a natural resource like coal or iron. Three are many theoretical models that explain the factors required for economic welfare and development and an analysis has to be made whether natural resources do play a part in the economic development of a country. It would not be possible to look into all those theories because it would entail too much space. But an analysis of the major theories is done so as to give a picture as to why oil rich countries remain poor.
For more relevance theories that came into being after the mid 1940’s are given more importance. Four theories of economic development or ‘schools of economic thought’ are prominent. They are structuralism, the linear stages growth model, the neo-Marxist or dependency theory and revival of the neo-classical theories during the 1980’s.
“These schools fall under the general rubric of “development economics,” a branch of economic analysis that responded to the perceived inability of classical, neo-classical, and Marxist economics to address the economic reality that plagued the poor countries of the world.” (Contreras). For the purpose of this study, the first three theories, namely the structural theory, the linear stages growth model and neo-Marxist approach is used. The early theories of economic development stressed mainly on effective allocation of scarce resource. In this instance, resources are not scarce and hence those theories do not have much relevance in this context.
The Structural Approach
This approach argued that each country had distinctive structures and that economic development was dependent on developing or modifying the individual structure of the economy in each country. The view was that under developed economies were suppliers of raw materials for the developed world. Since they had a ready market, most countries were concentrating on attaining efficiency in getting the raw materials ready for export, virtually ignoring other aspects of growth..
This approach argues that each country should transform its local economy from an agricultural based economy to a more industrialised economy that had the capability to produce goods and not just raw materials. For this purpose, state intervention in protecting the local economy (for example, by restricting imports) is necessary. This assumption of government intervention was proved to be a fallacy, and many economies like India and China have switched over to a more open door policy. This situation is found in many oil rich countries who are concentrating in exploiting oil for export. Government intervention is also high in most of the oil rich countries.
However, the importance of this school of thought has diminished over the years. “However, as time moved on, these policies seemed to fail to yield their promised fruit, and a Neoclassical (or, more accurately, Neo-Liberal) countermovement initiated by the lone voices of P.T. Bauer, I.M.D. Little, Deepak Lal, Bela Balassa, Anne Krueger and Harry G. Johnson began to gain more adherents.” (Structuralism and its Discontents, Economic Development).
Linear Stage Growth Model
This theory suggests that every nation has to go through a predetermined linear stage during the course of its development. This linear stage of growth does not distinguish between growth of developed nations and developing or underdeveloped nations. This style of reasoning was first introduced by W W Rostow in 1960. according to Rostow, the five stages which a nations has to go through is the traditional society, preconditions for take off, the take off stage, the drive to maturity and the age of high mass consumption.
- Traditional Society: This is the stage from which all development starts. There is no surplus of goods since all production is consumed within the society. The society will be predominantly agriculture based. Capital investment will be very low and existing industries will be labour intensive.
- Preconditions for takeoff: Productions increase causes surplus which can be traded. This is helped by the development of better transport facilities. The economy sees the growth of businessmen or entrepreneurs. The concept of savings and investments begin to emerge.
- The takeoff stage: The growth of industries causes high switching of jobs from agriculture to the industrial sector. But at this stage growth will be imbalanced and only few types of industries will be present.
- Drive to maturity: This is the stage where an economy begins to be recognised as nearing the advanced stage. Technology will be widely used.
- The age of high mass consumption: The society will have moved away form the need for basic necessities and would begin to purchase and consume items that do not constitute a basic need (e.g. consumer durables). This shift will be enjoyed by a large majority of the population since purchasing power exists.
Certain prerequisites are like heavy investment for infrastructure development. Earnings should have reached such a level that savings and its subsequent investment is possible. This process will act as a catalyst to economic growth. The limitations are that even though investment can be made possible through foreign aid, the quality of labour, level pf technology and quality of governance are not considered. This model had worked for Europe after the destruction it faced after World War 2, because it had the technology and quality of labour. Through the Marshall Plan, aid was given by the US to the tune of USD 13 billion starting in 1948.
“Between 1948 and 1951 the U.S. provided about 13 billion dollars in cash, goods and services to help Europe rebuild its war torn economies.” (E-Book Glossary). The quality of labour and technical expertise of underdeveloped economies was not on the same level as of Europe. This was the main drawback of the theory. In reality, massive aid to developing countries has not shown the desired results in developing and underdeveloped economies. “Rostow explains the development experience of Western countries, well.” (Limitations of Rostow’s Model, Development Models – Rostow). As per this theory the lack of quality education and technology would have prevented economic development of oil rich countries.
The neo-Marxist theory or Dependency theory: This is basically an extension of the views expressed by Carl Marx on Marxism. The theory basically states that poorer countries are dependent on rich countries who in turn, exploit the poor countries. Poor countries have very few items in the form of raw materials left as surplus and they depend on the richer economies for finding a market for these goods. External forces like multinational corporations and international markets influence the growth of the economies of the poorer countries. Exploitation of the poor by the rich within the country is also a factor, since this will lead to unequal distribution of wealth.
It is true that the oil rich countries had only one raw material as surplus. With regard to oil rich countries, this situation of exploitation existed early in the 20th century, but the situation changed by the formation of the OPEC, the nationalization of oil companies and the rising price of oil. “Moreover, to a large extent the dependency models rest upon the assumption that economic and political power are heavily concentrated and centralized in the industrialized countries, an assumption shared with Marxist theories of imperialism.” (Ferraro 1996).
Research Methodology
The methodology used for research is secondary in nature. Sources of information are primarily form books and web sources. Care has been taken to see that data from web sites owned by organizations that have expertise in economics and business. There have been instances where information have been sourced from purely commercial web sites. Primary sources of data were not resorted to due to geographic distance limitation to countries relevant to this study. None of these countries are in the United Kingdom or Western Europe.
Reflections
The purpose of this paper was to show that oil rich economies need not necessarily be rich economies. It might come as a surprise to the common man to know about the existence of this paradox of being ‘oil rich, but poor’. The availability of natural resources like oil is a natural phenomenon. It is also true that availability will be evenly spread out over the surface of the earth. This makes some nations rich in resources, while others are moderately rich or downright poor. Such resources cannot be created artificially or even of done, will be commercially unviable because of the high cost of developing it. But it has to be seen whether a country blessed with natural resources is to considered to blessed or cursed.
Switzerland with little resources to speak of is economically advanced. At the same time, it is relatively or totally free from problems or conflicts that happen in different parts of the world. Even during the two World Wars, with that country being practically in the middle of action, had managed to remain neutral. Economically rich Japan had numerous and damaging conflicts in its long history, like the dropping of the atom bomb. In the gulf region, only Iraq and Iran have a long history of conflict with each other and in the case of Iraq with its neighbours. Tiny countries like Dubai or Singapore have enviable record of growth. Every country with rich resources of oil is, currently undergoing conflicts, had a history of conflicts or is near to areas where such conflicts are occurring.
The way a country is governed over a period of time is of paramount importance for the economic prosperity of its people. Proper policies with regard to education, infrastructure, transportation and trade have to be formulated and maintained. In democracies, there have been instances of a newly elected government change the policies of its predecessor not because they were poor, but due to political gain. All the oil rich countries studied here have rich resources that, if properly exploited can transform the economy positively. But it should incorporate all those changes that is required for economic growth.
Developing all this is a slow process and requires patience and persistence from those who govern them. The case of the BRIC economies is an instance that proves this. Even though all the three countries had heavily regulated economies, they had built up an infrastructure that became a huge advantage when their markets were opened. When globalisation became a reality, there were fears that the advanced economies would take financial control over weaker economies. There were protests from many quarters that markets should not be opened up. But with right policies a mutually beneficial atmosphere and cooperative atmosphere can be developed. With the increase of terrorism and unrest, such cooperation will bring greater benefits than just monetary gains.
Conclusion
Countries that still remain poor even with abundance of natural resources have to learn from others who have succeeded. This change has to come, not just form the government, but form its citizens as well. It will require hard and concerted effort. With the advancement of communication, it is no longer possible to keep realities hidden from the people. Sooner or later, they will come to know what is happening with other economies. This was not the case a couple of decades back. The government could find means of censorship of news to keep its people in the dark about the outside world.
Resentment of the citizens can be kept controlled, but not for too long. The people in certain communist ruled countries have come out in open protest against the way they have been governed. Even though many such uprisings have been quelled with brute force, there came a time when the government had to bring major changes or face the threat of major unrest or even civil war. It is still within the capacity of these countries to come out of the present predicament with the help of prudent polices. This process will be accelerated with discovery of an alternative to petroleum or when the oil available runs out. Both the advent of both these scenarios happening in the near future seems to be a distant possibility.
Bibliography
A BRIC through our window? The global war for capital. (2007). A second hand conjecture. Web.
Butler, Katherine. (2008). Rich African states ‘squander their wealth’ as children die. The Independent – World. Web.
China’s investment strength is sustainable. (2006). Chapter 4. p. 61. Web.
Contreras, Ricardo. Competing Theories of Economic Development. The University of Iowa Centre for International Finance and Development. Web.
Corruption Undermining Global Anti-Poverty Fight, Group Says. (2004). Transparency International issues “Perceptions Index” for 2004. International Information Programs USINFO. Web.
E-Book Glossary. The University of Iowa Centre for International Finance and Development. Web.
Emeagwali, Philip (2007). Technology Widens Rich-Poor Gap. The Perspective. Web.
Falola, Toyin & Genova, Ann (2005). The Politics of the Global Oil Industry: An Introduction. The Dual Buildup. Published by The Greenwood Publishing Company. P. 46. Web.
Ferraro, Vincent (1996). The Structural Context of Dependency: Is it Capitalism or is it Power? Dependency Theory: An Introduction.[online]. Massachusetts Institutes of Technology. Web.
Frynas, Jedrzej Georg (2000). Oil in Nigeria: Conflict and Litigation between Oil Companies and Village Communities. Mechanics of Oil Operations in Village Communities. LIT Verlag Münster. P.162. Web.
Francis, Mohan G. The world oil market. Web.
Giles, Jim (2006). Islam and Science: Oil Rich, Science Poor. News Feature. Nature –Internal Weekly Journal of Science. Web.
Index of economic freedom. (2008). Libya. The heritage foundation. Web.
Index of economic freedom. (2008). Kuwait. The heritage foundation. Web.
Index of economic freedom. (2008). Iran. The heritage foundation. Web.
Index of economic freedom. (2008). Irque. The heritage foundation. Web.
Index of economic freedom. (2008). Qatar. The heritage foundation. Web.
Index of economic freedom. (2008). Nigeria. The heritage foundation. Web.
Index of economic freedom. (2008). Angola. The heritage foundation. Web.
Index of economic freedom. (2008). Venezuela. The heritage foundation. Web.
Index of economic freedom. (2008). Algeria. The heritage foundation. Web.
India’s rising growth potential. (2007). India’s Scope for Catch-Up. P.11. Web.
Investing in India. (2004). Foreign Direct Investment, Policy and Procedures. Introduction. Secretariat for Industrial Assistance. Ch. 1. P.1. Web.
Limitations of Rostow’s Model, Development Models – Rostow. Web.
Long, Guoqiang. China’s Policy on FDI: Review and Evaluation. Distribution of FDI various Chinese Industries. Web.
Oil Conflicts. (2004). PAWSS. Web.
OPEC facts and figures. (2008). OPEC – Organisation of the Petroleum Exporting Countries. Web.
Oil Producing Countries, Companies Need to Step up Efforts in Reducing Gas Flaring (2006). Port of Entry, innovation, sustainability, development. Web.
Russia: A smooth political transition. (2007). Re-centralisation under Putin. P. 29. Web.
Structuralism and its Discontents, Economic Development. Economics New Schools. Web.
Top World Oil Producers, Exporters, Consumers, and Importers. (2006). Info please. Web.
The. B. in bricks: unlocking Brazil’s growth potential. (2006). P. 75. Web.
Who are OPEC Member Countries? (2007). OPEC – Organisation of the Petroleum Exporting Countries. Web.