Independent-Samples T-Test
The independent-samples t-test was used to determine the movies that predispose children to a higher number of injuries. According to the assumptions of this form of the t-test, the independent variable should exist on a nominal scale with two categories (Elliott & Woodward, 2015; Pallant, 2016). Hence, “before” and “after 1980” comprise two categories of time of exposure to movies measured on a nominal scale. The assumptions related to the dependent variable are measurement on a continuous scale, lack significant outliers, have homogeneity of variance, and normality of distribution (Field, 2017; Stangor, 2014). The number of injuries is a dependent variable that meets the assumptions of scale and homogeneity of variance, but it violates the lack of significant outliers and the normality of distribution.
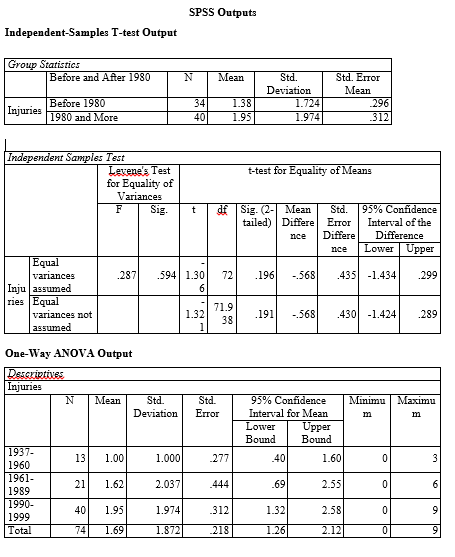
Inferential statistics (Table 1) derived from the independent-samples t-test reveal that children exposed to movies created after 1980 (M = 1.95) did not experience a statistically significantly higher number of injuries than those exposed to movies created before 1980 (M = 1.38), t(t (72) = -1.306, p = 1.96. Thus, the inferential statistics imply that the exposure to movies created after 1980 did not predispose children to experience a statistically significant higher number of injuries compared to exposure to movies created before 1980.
Table 1. Independent Sample t-Test Results.
One-Way ANOVA
Descriptive statistics generated from one-way ANOVA were used to determine the group of children who experienced the most injuries among children exposed to movies created between 1937-1960, 1961-1989, and 1990-1999. The number of injuries comprises a dependent variable that exists on a continuous scale and exhibits homogeneity of variance, which are two assumptions of one-way ANOVA (Gravetter & Wallnau, 2017). This test also requires the independent variable to constitute a nominal variable with more than two categories (Jackson, 2015). The duration of exposure has three categories, namely, between 1937-1960, 1961-1989, and 1990-1999.
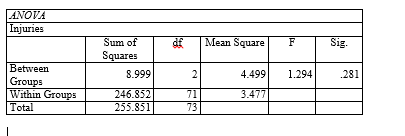
Results of ANOVA (Table 2) show that children exposed to movies created between 1990 and 1999 experienced the most injuries (M = 1.95, SD = 1.974) followed by those exposed to movies created between 1961 and 1989 (M = 1.62, SD = 2.037) and between 1937 and 1960 (M = 1.00, SD = 1.00). Hence, the descriptive statistics show that the number of injuries increases with the time when the movies were created.
Table 2. ANOVA Results.
References
Elliott, C., & Woodward, A. (2015). IBM SPSS by example: A practical guide to statistical data. Thousand Oaks, CA: SAGE Publications.
Field, A. P. (2017). Discovering statistics using IBM SPSS statistics (5th ed.). Thousand Oaks, CA: SAGE Publications.
Gravetter, F. J., & Wallnau, L. B. (2017). Statistics for the behavioral sciences. New York, NY: Cengage Learning.
Jackson, J. (2015). Research methods and statistics: A critical thinking approach (5th ed.). Belmont, CA: Cengage Learning.
Pallant, J. (2016). SPSS survival manual: A step-by-step guide to data analysis using SPSS (6th ed.). Maidenhead, England: Open University Press.
Stangor, C. (2014). Research methods for the behavioral sciences. New York, NY: Cengage Learning.

