Executive Summary
We conducted a training program to improve the customer service skills of the support staff of Zayed University at the Dubai campus. There were concerns about an increasing number of complaints from students or customers. Therefore, the purpose of the training was to minimize the number of complaints. An organization may lose dissatisfied customers and thus the need to improve customer satisfaction. All the levels of a return on investment (ROI) study were followed up so that we can measure the impact of the training program. These levels include Reaction, Learning, Application and Implementation, Business Impact, and ROI.
Using control groups, we isolated the factors that influenced the impact. Data from the Abu Dhabi campus was compared with that of the Dubai campus, which revealed that the impact was indeed influenced by the training program. We then calculated every dollar saved from retaining customers through improved customer service skills. The data after training was compared with data of the previous year in the same period as that of the training to estimate the number of customers saved from not leaving the institution. We calculated the costs of the training program as well as the benefits or the saved costs, which helped in determining the return on investment of the training course.
Objectives of the study
To determine the effectiveness of the training support staff on customer service skills.
To evaluate the participants’ reaction to the training program and what they plan to do with the material.
To evaluate the learning through the training program.
To evaluate what has been applied and implemented from the techniques taught in the program.
To measure the training’s impact on the support staff.
To measure the ROI of the training: whether the monetary value of the training exceeded the cost of the program.
Background
Just like any organization, Zayed University has to maintain a positive image. To do this, improving the customer service skills of the support staff (grade 5 and 6) is important. This is because employees working to deliver customer service are actually the face of the university to the customers. Therefore, an increase in the number of complaints from customers would put the organization in a precarious position.
We conducted a training course on 182 of the support staff in various departments to improve their customer service skills which could ultimately reduce the number of complaints from customers. The costs of the training program were calculated. Moreover, we measured the benefits of the program. These measures were the basis of the measurement of the ROI of the training program. We studied and analyzed all the levels: Reaction, Learning, Application and Implementation, Impact and ROI calculation. We also isolated the effects of the training and learning program to find the factors that might have contributed to the performance improvement.
Data collection
Level 1: Reaction and Planned Action
We undertook a collection of data to measure the participants’ reaction to the relevance and the success of the training program. We attempted to evaluate the relevance of the program (program evaluation), training benefits, the trainer’s effectiveness (evaluation), training tools, and recommendations to others. We used a questionnaire to evaluate the satisfaction of the participants towards the training program. The average measures from 182 trainees were calculated and are shown in table 1. The satisfaction of trainees about the training program was as shown below:
Program Evaluation = 4.38/5
Trainer’s Evaluation =28.11/30
Training tools = 4.08/5
Training benefit = 14.18/15
Recommendation to others = 4.83/5
Table 1: Reaction and Planned Action.
Level 2: Learning
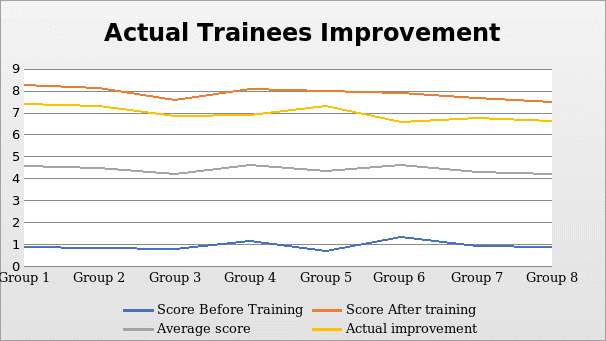
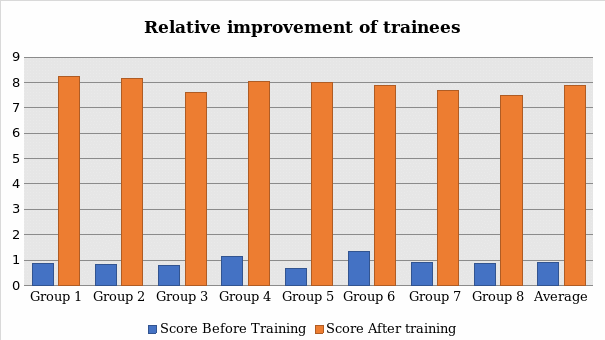
We measured learning from the training program by testing the trainees before and after the training using the same questions. The maximum score on the test was 10. The trainees were grouped into eight groups, and we were able to find their actual and relative improvement levels shown in table 2.
Table 2: Trainee improvement.
Table 1 shows that the overall relative trainee improvement was 1.95 or 195%. This indicated that learning improved through the training program.


For learning improvement to be measured, we need to have the initial score and the final score. In this case, the initial score was taken before the training, where a set of questions that covered the training objectives were administered, and the scores were recorded. And the final score was recorded after the training, where the trainees were given the same questions that were given at the beginning of the training program. Figure 1 and figure 2 show the learning improvement of the trainees after the training. They indicated that there was learning improvement.
Level 3: Application and Implementation
To evaluate the application and implementation of the skills taught in the training program, we used an action plan and questionnaires to collect data. Supervisors and direct managers of the trainees were asked to evaluate on a scale of 1 to 10 the extent to which the trainees were applying what they have learned. The questionnaires had very specific questions covering the objectives of the program. The results for each trainee were statistically manipulated to find the average for each of the objectives that the program aimed to achieve.
Table 3: Application and implementation.
From the supervisors’ evaluation, as indicated in table 3, it was concluded that most of the trainees applied and implemented what they had learned during the 5-day training program.
Level 4: Impact
The major aim of the training program was to reduce the number of complaints from Zayed University customers/students. The university management has placed suggestion boxes in every department where students leave their complaints and possible suggestions for improvement in service provision. To measure the impact of the training on the initial objectives of the training program, we used the data from the university. We used the number of complaints recorded before and after the training program was conducted.
Table 4: The impact of training.
When data after training was compared with the one before training during the same period in the previous year, there was an improvement in complaint reduction. On average, the number of complaints reduced from 102 (before the training period) to 25 (after the training period). Consequently, the number of complaints was estimated to reduce by 77 per month.

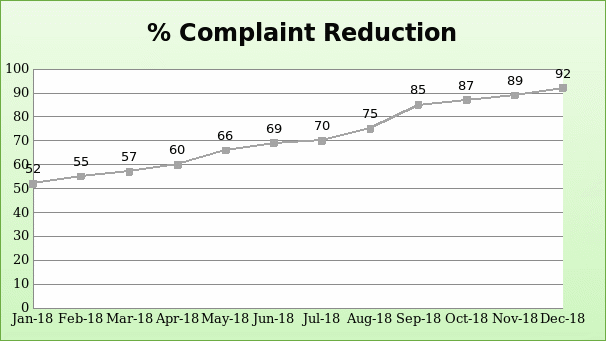
Figure 3 is a line graph that shows an improvement in the reduction of complaints in the institution after the training course. By the end of the first month (January 2018) after the training, the number of complaints recorded reduced by 52%. By the end of the second-month complaints had reduced by 55%. The third month recorded a 57% decrease while in the fourth month there was a 60% decrease.
On the other hand, the fifth and sixth months displayed a reduction of 66% and 69% respectively. The seventh month recorded a 70% reduction, while the eighth month displayed a 75% complaint reduction. The number of complaints recorded in the ninth month reduced immensely to 85%, while the tenth, eleventh, and the twelfth months recorded 87%, 89%, and 92% complaint reduction, respectively. There was a tremendous change twelve months after the training with an overall reduction of 92%. However, until this point, we did not know whether this improvement was entirely attributed to the training course. As such, we had to conduct an analysis to isolate other factors from the training impact.
Isolation of factors
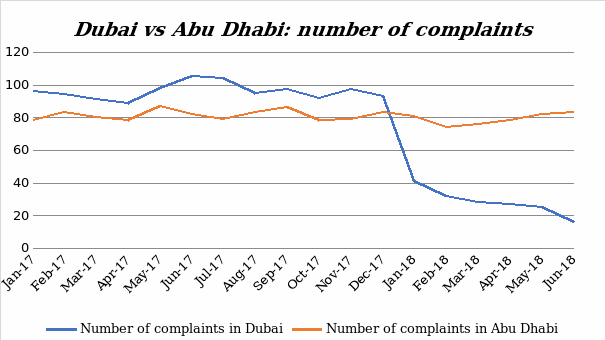
This training program was conducted for the staff of the university in Dubai. Since the university has another branch in Abu Dhabi, we used it to compare the results as a control group. We measured the number of complaints about poor service for the same period. This was meant to determine whether the results discovered were actually due to the training program. Table 5 shows the results for the Abu Dhabi branch. The number of complaints from customers at the Abu Dhabi branch was actually a bit lower than that of Dubai before the training. However, after the training, the number of complaints at the Dubai branch became lower than at the Abu Dhabi branch. Consequently, the reduction can be attributed to the training program that was conducted in Dubai.

Level 5: ROI measurement
Costs of the training program
We accurately calculated the costs of the program, including the trainer salary cost as well as the costs in terms of the days lost to the training. The information from the HR department was that the average salary of an employee in grades 5 and 6 is 7000 UAE Dirhams or $1907. $1 = 3.67UAE Dirhams. The training took five days, and to be accurate in our ROI calculation; we had to consider the costs the HR department incurred as a result of the activity.
Table 5: Cost summary.
Benefits or cost savings of the training course
Participant estimations and internal experts were very useful in the conversion of the data to monetary value. From their estimations and expert opinions, we were able to calculate the benefits of the training program as a result of improving customer retention. Expert opinions suggested that unmanaged complaints lead to customer dissatisfaction which slowly kills the institution. A complaint was treated as a lost customer. As such, a model that estimates customer acquisition and retention costs was used to estimate the value of a customer to the institution as profits. Experts from various departments were involved in estimating the value a customer brings to the university. This helped us to calculate the costs that were saved as a result of the training program.
We compared the average number of complaints between the period after the training and the same period in the previous year, and we took the difference as the number of customers that have been retained and saved from leaving the institution. From calculations, the average number of retained customers was 77 customers per month, as shown in table 6. We were convinced to take this figure to represent the retained customers due to the training because it was reported by the management that a complaint that fails to be addressed leads to a possible loss of the complainant. Therefore, to the best of our knowledge, this was a significant way of converting the training benefits into monetary value.
Table 6: The average number of customers “retained” as a result of the training program.
It was estimated that, on average, a customer gives the institution a profit of 13946 UAE Dirhams or $3800 in a year. In one month, a customer will give the institution a profit of $3800/12 = $317. Therefore, improving the retention of customers through the reduction of complaints due to poor customer service would save the institution 77 trainees x $317 x 12 months = $292,908.
ROI Calculation
ROI = (Benefits – Costs)/Cost
Benefit – Cost = 292,908 – 76,574 = 216,334
ROI = 216,334/76,574 = 2.8252 x 100%
ROI = 282.62%
The ultimate goal of this study was to find out if the benefits from the training program exceeded the costs of the program. ROI is a positive value indicating that the benefits surpassed the costs. Therefore, the training program was effective. Besides the return on investment of the training course, other intangible benefits include job satisfaction among the trained employees, commitment, customer satisfaction, and increased employee productivity.
Conclusion
The main purpose of this ROI study was to determine the effectiveness of the training program. To be able to measure this objective, we had to go through all the ROI study levels. Therefore, the study sought to evaluate the trainees’ reaction to the training, evaluate the learning through the program, evaluate the application and implementation level, evaluate the training program’s impact, and finally to measure the ROI, which would determine the effectiveness of the program. The evaluation of the participants’ reaction to the program revealed that trainees were satisfied with the program and could highly recommend it to their colleagues.
A study on the learning level indicated that the trainees’ learning had improved after the training. Moreover, the score on application and implementation was high, as provided by the trainees’ supervisors indicating that they applied and implemented most of the techniques they were taught. The number of complaints after the training was lower than before training. When it was compared with that of the Abu Dhabi campus, it was concluded that the reduction was a result of the training program. Finally, from the ROI calculation, it was revealed that benefits exceeded costs; thus, the program was effective.