Main products and general characteristics of the firm
Background of the company
The paper analyzes Abu Dhabi National Energy Company (TAQA). The company was established in 2005. The headquarters of the company is in Abu Dhabi, UAE. The total revenue for the year that ended on 31st December 2013 amounted to AED25,757 million, while the loss for the year amounted to AED1,768 million (Abu Dhabi National Energy Company PJSC, 2014).
Products and services
The company focuses on generation of power, desalination of water, manufacturing and storage of gas and oil. The first product that will be analyzed is oil and gas. Oil and gas accounts for about 47% of the total revenue earned by the company. The second product is power while the third product is water. The total of water and power accounts for 53% of the total revenues.
Table 1.0: Sales of power, water, and oil & gas for 2012 and 2013
Continuation
The price of oil and gas dropped by AED0.19 during the period while the quantity sold increased. This resulted in an increase in total sales by 1.44%. In the case of power and water, there were no changes in the prices. This can be explained by the fact that prices for the commodities are regulated by the government. However, the total units sold increased. These changes resulted in the growth of total sales by 4.98%.
Opportunity costs
When making business decisions, especially on expansion, the company needs to analyze the forgone costs (Mankiw, 2009). For instance, there is a large and untapped market for power in Africa. Therefore, if the company wants to increase the production of power to a level that can meet demand, it will have to forgo the annual increase in the production of water and oil & gas. Therefore, the first opportunity cost will amount to AED173 million. This will be for oil and gas. The second opportunity cost will be AED170 million (for water).
Scarcity issue
One major scarcity issue that the company deals with on a regular basis is the lack of adequate capital that can be invested in all the available opportunities. The company addresses this scarcity by raising additional funds through debt (Mankiw, 2009). For instance the amount of long term debt rose from AED70,297 million in 2012 to AED73,170million in 2013.
Analysis of the firm’s supply and demand
Consumers’ income
The product that will be analyzed in this section is oil and gas. The product is a normal good. This implies that if income increases, then the demand for oil and gas will also grow. This can be attributed to the fact that oil and gas are important commodities in the economy. Even though they have limited substitutes, an increase in income will cause growth in quantity demand.
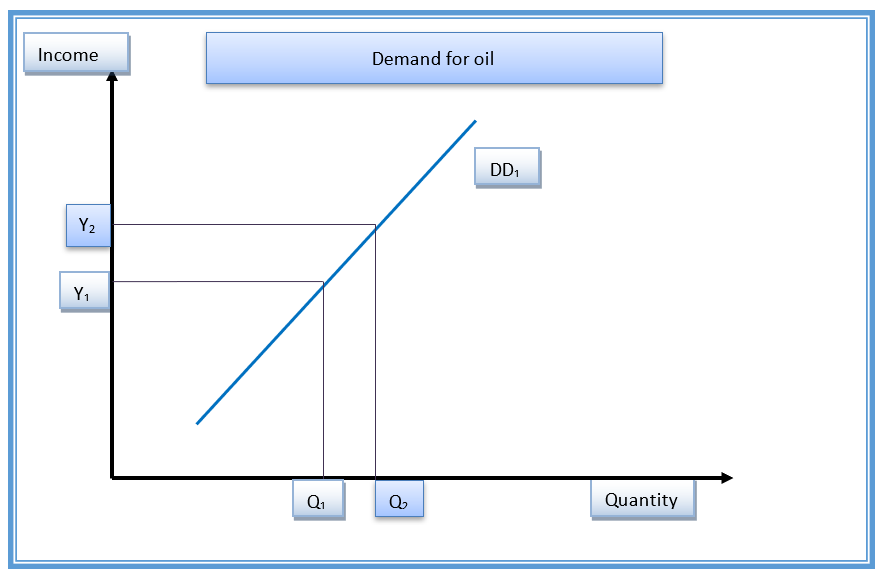
The original demand curve is DD1. The equilibrium income is Y1 while the equilibrium quantity is Q1. An increase in income to Y2 will cause a movement along the demand curve. The new quantity demanded will be Q2.
Prices of competing products
Oil and gas have few substitutes. Examples are electricity and solar among others. If the price of the substitute increases, then its demand will fall. Then, consumers will increase the quantity of oil and gas they purchase.
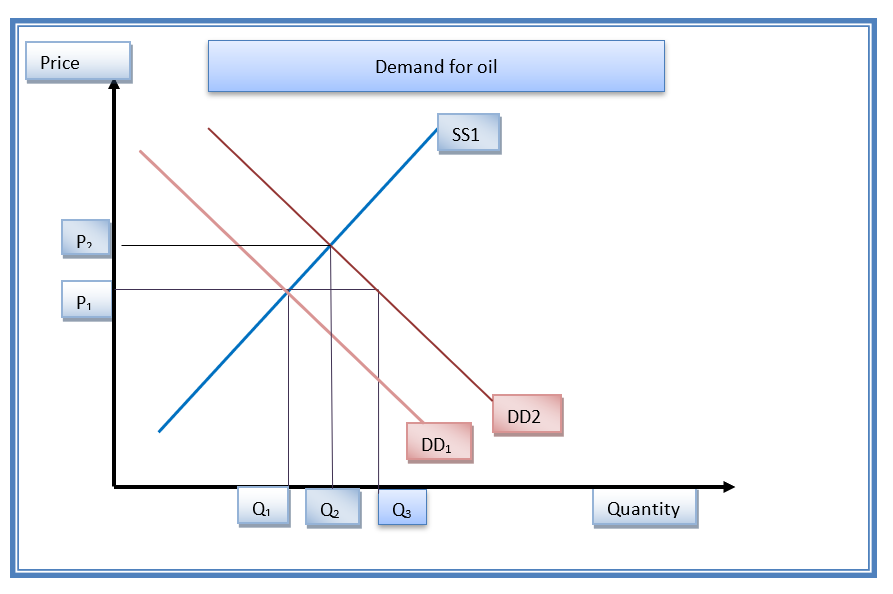
An increase in the price of the substitutes will cause the demand curve to shift outwards that is, from DD1 to DD2. This causes the quantity demanded to rise from Q1 to Q3 at the same price P1. This new position is disequilibrium. Therefore, the market forces will cause the price to increase to P2 and the quantity demanded will fall to Q2. In case of a decrease, the demand curve will shift inwards. This will cause a decline in quantity demanded.
Number of consumers
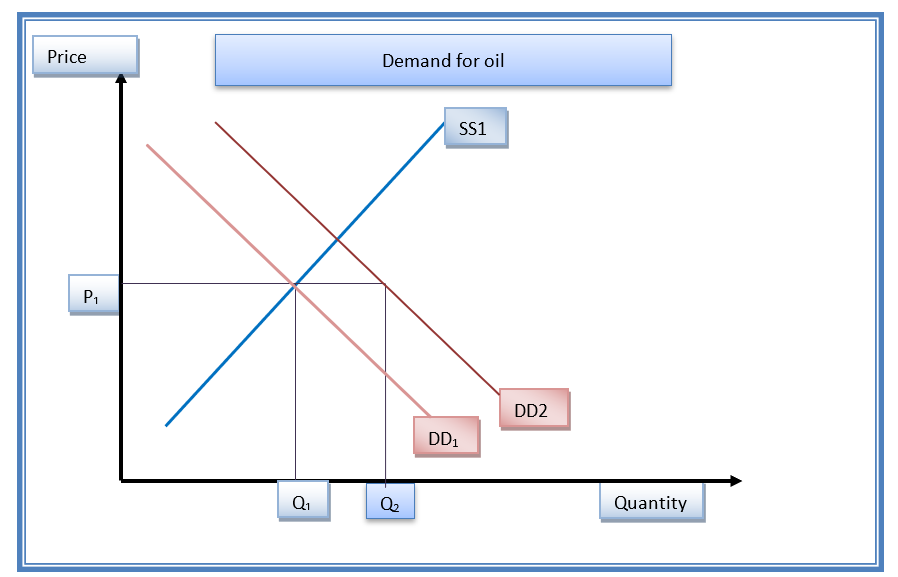
Oil and gas are consumed by all consumers in the economy because they are used for transport and in the house for various activities such as cooking, among others. However, the amount consumed by older people and high income group is higher than the amount consumed by young people and low income group. A change in demographics, such as an increase in the percentage of the high income group, will cause rise in quantity demanded as illustrated below.
An increase in the percentage of the high income group will make the demand curve change from the original position (DD1) to the new position (DD2). This causes the quantity demanded to increase from the original position Q1 to the new position Q3 at the same price P1. This new position is disequilibrium. Therefore, the market forces will make price to increase to P2 and the quantity demanded will fall to Q2. In case the percentage of low income group increases, the demand curve will shift inwards. This will cause a decline in quantity demanded.
Technology
An improvement in technology will enhance efficiency in the company. This will cause the quantity supplied to increase. The supply curve will shift outwards as illustrated below.
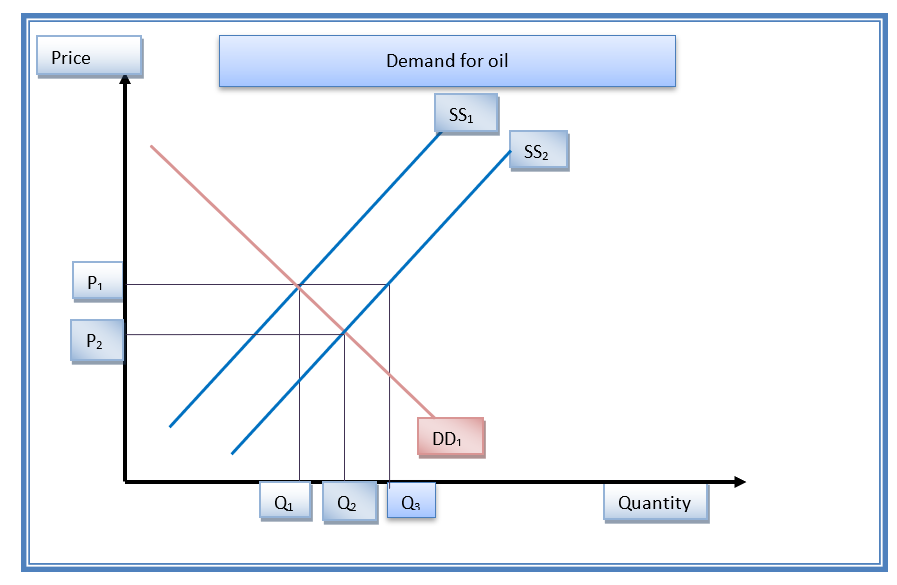
The supply curve will shift outwards that is, from the original position SS1 to the new position SS2. The resulting effect is a rise in the quantity supplied from the original position Q1 to the new position Q3 at price P1. However, the market forces will restore equilibrium. Price will fall to P2 while the equilibrium quantity demanded will be Q2.
Competitors
Examples of competitors for the company are Abu Dhabi Gas industries Limited, Abu Dhabi National Oil Ompany, and Dana Gas.
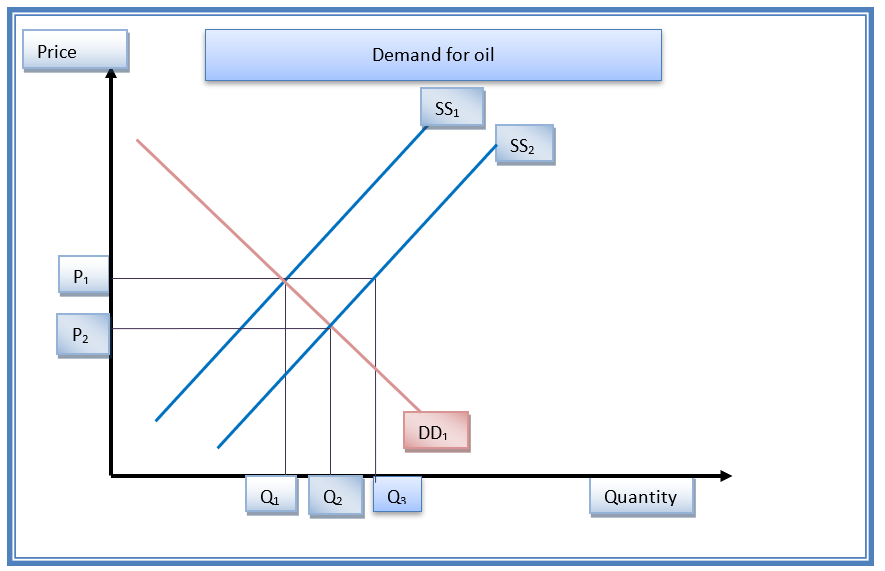
The entry of a new firm will cause growth in supply in the market of oil and gas. The market supply curve will shift from the original position MSS1 to the new position MSS2. With the increase in supply, the price of the commodity will fall.
Costs of production
An example of the cost of production as indicated in the income statement is operating expenses amounts to AED11,346 million.
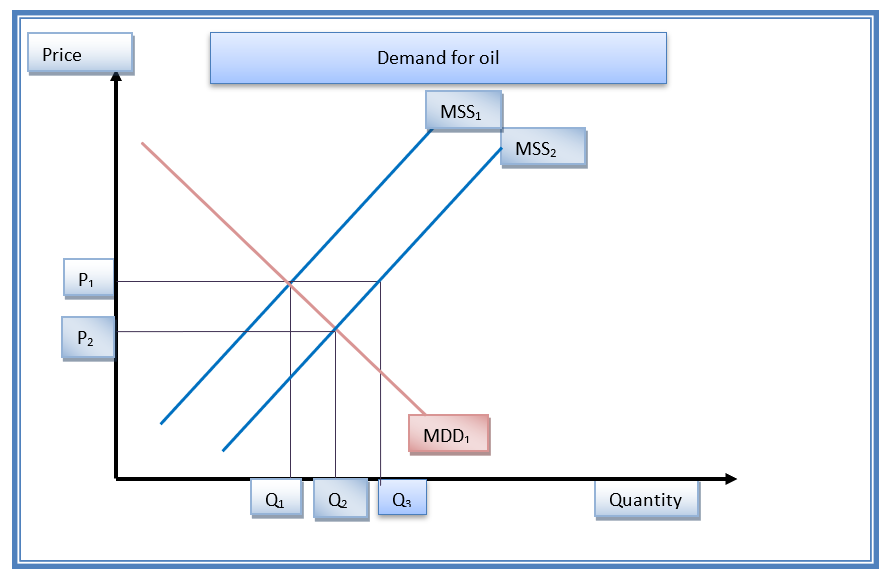
A decrease in operating expenses will result in a decline in cost of production. This will make the units supplied to increase. The supply curve will shift from the original position (SS1) to the new position (SS2). The price will fall from P1 to P2 while equilibrium quantity will increase from Q1 to Q2.
Non-price determinant
Another factor that can affect the equilibrium price and quantity is government intervention. An example is through subsidizing the production of oil (Henderson, 2004).
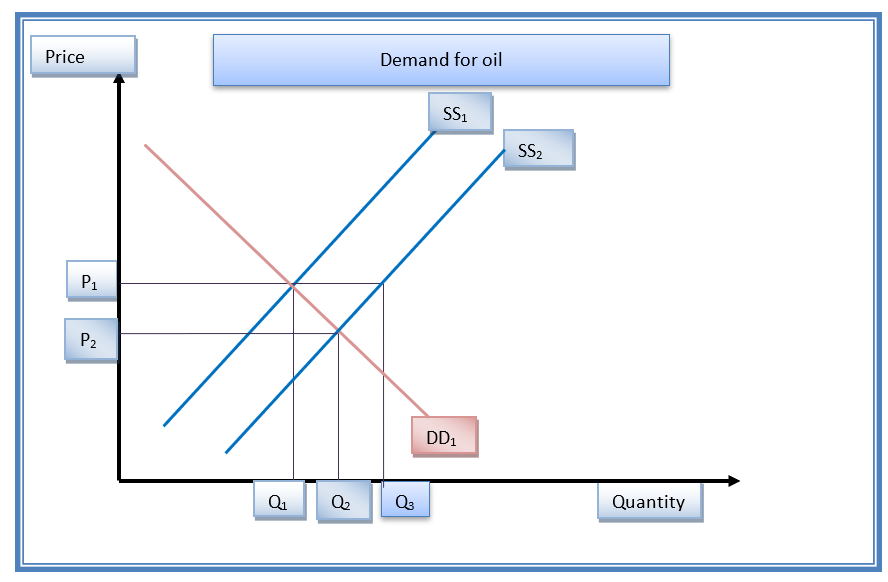
If the government subsidizes the production of oil and gas, then the cost of production will fall. The resulting effect is a rise in the quantity supplied from the original equilibrium Q1 to the new equilibrium Q2. Further, the equilibrium price will fall from P1 to P2.
Analysis of the price elasticity of demand
Price elasticity of demand
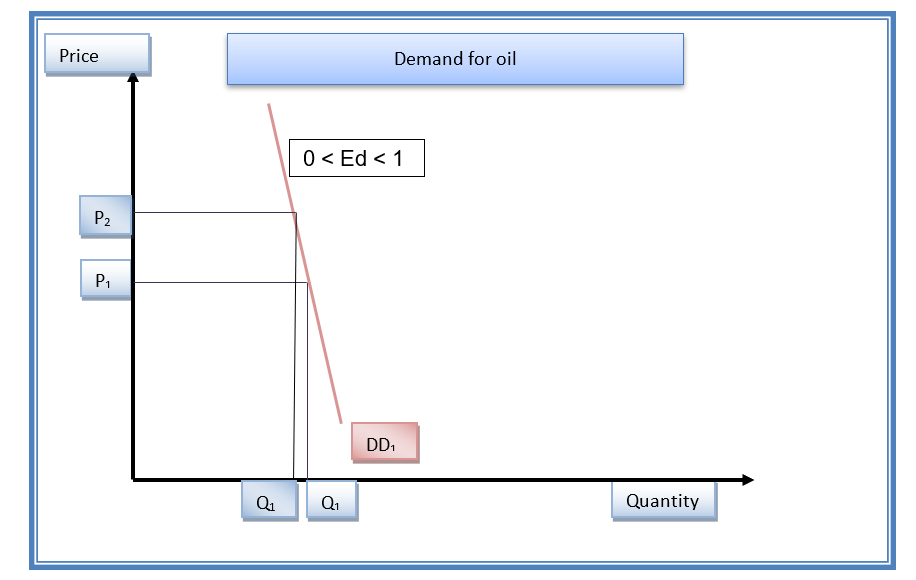
The demand for oil and gas is moderately inelastic with regard to price. Thus, an increase in the price of oil and gas by one unit will result in a less than one unit decline in the quantity demanded (Adil, 2006).
Therefore, an increase in price from the original position P1 to the new position P2 leads to a trivial drop in quantity from Q1 to Q2.
References
Abu Dhabi National Energy Company PJSC. (2014). Annual report and accounts 2013. Web.
Adil, J. (2006). Supply and demand. USA: Capstone Press.
Henderson, D. (2004). Supply and demand. USA: Kessinger Publishing.
Mankiw, G. (2009). Principles of microeconomics. USA: South Western Cengage Learning.