Introduction
American Express Inc. was incorporated in the year 1965 as a New York Corporation. Its primary objective was to serve as an international money payment, interacting and travel services Company throughout the world with branches in principal global cities. The main lines of its business have been in the following areas:
- Global credit and debit card networking source.
- Green, Gold, Platinum Charge card and credit card for different varieties of consumers and global business travelers and fliers.
According to the Brand Survey conducted by Interbrand, American Express enjoys the 14th Spot in the List of Top 100 Global Brands in 2006 period only goes after citation (The 100 Top Global brands 2006, 2000-2007 ).
The elements of analysis based on the Annual reports of Amex would be:
- Analysis of revenues net of interest, expenses
- Analysis of returns on average equities
- Dilution of earnings per share, from continuing operations
- Current ratios
- Fixed assets turnover ratios
- Debts to total assets ratios.
- returns to shareholders on total assets ratios
- Five years profitability analysis
- Five years profits earnings ratios.
Present scenario
American Express has been going through a difficult phase in recent years, mainly due to strong competition in the cards and travel trade markets. In order to consolidate its position, American Express has taken recourse to enter into affiliations with around 40 other credit card companies in order to offset their competitors and retain vital market share. Besides, credit card markets are high risks since the occurrences of default and non-payments by cardholders are very high, and there are quite frequent occurrences of bad debts and non-realization of bills in credit card segments. The main reasons could be that credit cards do not carry collateral securities and the company could only proceed legally against the defaulter for non-payment of accumulated debts.
Besides, the global credit card has been shorn of exclusivity, and clients are often not fully screened before being offered credit card facilities, with the net result that risks of default and non-payments run high and many customers may vanish or become bankrupt after using substantial credit limits, incurring heavy losses for the company.

Lure of competition
While the credit card company needs to ensure that credit cards are utilized by genuine customers, there are also the risks that potential customers could be lured away by competitors, offering more attractive deals and facilities to customers. Therefore, it becomes necessary for credit card companies to woo customers who may not always be high potential customers but to increase customer base and generate business for the Company. Its ambitious credit card network can be seen from the fact that “American Express has issued more than 86 million cards worldwide” (American Express company, 2008).
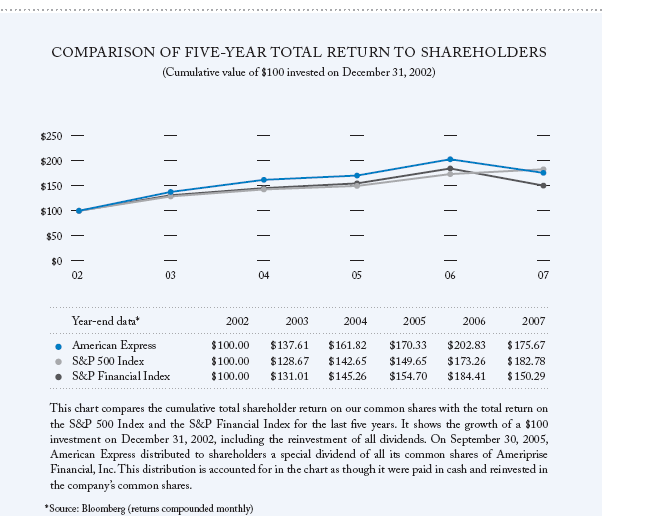
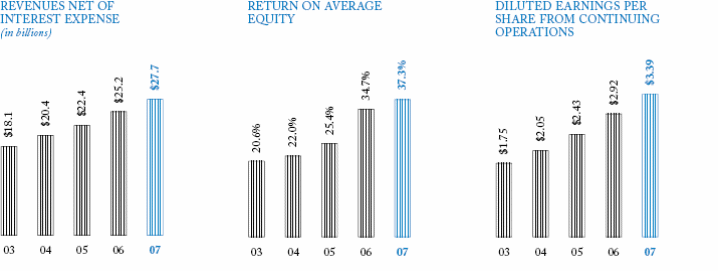
From the graphs below, it is discernible that the growth of the Company is present, despite tough competition in these areas, and American Express needs to make its global presence more strongly felt, especially in the developing Third World Countries, like India, China, Brazil, and several Far East countries. (Consolidated financial highlights. 2007).

The first chart deals with revenues net of interest, expenses for the years 2003 thru 2007. There has been an average rate of growth in this area to the tune of around 10% pa. The second chart deals with ROE. The average rate of growth in ROE is around 17%pa. The third chart portrays diluted earnings per share, where the average rate of growth during the period under review is around 18% pa.
Current ratios
The current ratios of Amex need to be improved since now it stands at an average of less than 2 over the five-year period whereas the industry standards is around 4.There is a need to improve realizations from credit cards business and this is reflected in its current ratios. Therefore it needs to pursue credit cards and other receivables aggressively if it were to improve its present current ratio and remain competitive in this business. In the years to come, it is believed that, with increasing competitiveness from other major players like Standard Chartered, Thomas Cook, and Visa card, it not only needs to consolidate its market position but also build a robust business.
Table 1: Five-year Computation of current ratio.
Ratio of fixed assets to turnover ratio
It is observed that the ratio of fixed assets to turnover ratio in the case of Amex, or the proportion of the fixed assets that contribute to turnover during the years under review is very low in the case of Amex. While the industry standards are hovering around 3 times, in this case, as computed from the Annual reports for the periods under review, it is just around 0.428. However, it is needed to know that Amex is in the service sector, and therefore the deployment of fixed assets may not be as significant as a manufacturing industry.
Five-year Computation of Asset management ratio:
Table 2: Fixed Asset Turnover (millions).
DTA ratio
Coming to the DTA ratio, that is the deployment of debts to total assets, it is seen that during the financial years 2003 and 2004, according to their Annual Financial Statements, Amex has shown above-average DTA ratios. However, from 2005 onwards, it has begun to post below-average ratios, and against an industry average of 40%, it has registered 49%. Therefore, Amex needs to either substantially reduce debts in future years or increase its fixed assets base with new assets acquisition in order to improve asset value.
Table 3: Total debts to total assets (millions).
Table 4: Five-year Profitability analysis of American Express Co. (millions).
Ratio of net income available for distribution to shareholders
According to the figures provided in its annual reports for the 5-year period under review, the ratio of net income available for distribution to shareholders seen as a proportion of total assets is average 2.44 over this period against the industry standard of 9%. Therefore, it has become imperative for the company to address the factors of falling income and escalating costs in order to set right these anomalies. Amex needs to improve performance in profitability areas and also implement strategies for lowering costs in future years.
Table 5: Price per Share/Earnings per Share.

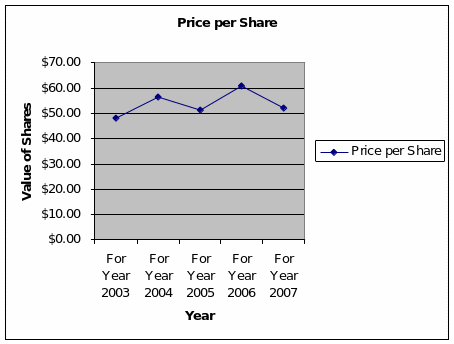
The Market Value of AmEx Company has been fluctuating considerably over the years since 2003 and in the year 2007, it stands at $52.02 cite. Thus, it is seen that from the point of view of investments, it may not be a safe bet to invest in AmEx shares in the near future, until it registers a higher market value and is able to consolidate its market position in the trade. It is expected that the stock prices will dip in the future too.
A potential investor would look in terms of earnings and long-term value for his shareholdings, which are both at low levels at present. Therefore, investors need to adopt a wait-and-watch attitude before placing monies in AmEx Co. The element of risks in shareholdings being evident, it would be some time before investors’ confidence and market activities could boost the market value to higher value in the future. Until such time, it is seen that investor confidence would be low at least in the short-term period.
It can be judged that the financial performance of American Express Co. over the five-year period has not been up to stockholders’ expectations. It is necessary that such comparisons be made so that a wealth of information about the actual performance of service companies is made. “An analysis of its statements can highlight a company’s strengths and shortcomings, and this information can be used by management to improve performance and by others to predict future results ” (Brigham & Ehrhardt, P 74).

Price/Sale and Price/Earnings Ratios
Coming to the aspects of the performance of American Express Co. to that of the industry and also the markets, it could be said that its Price/Sale Ratio at 1.63 is higher than industry standards, but falls below the market standard of 1.69. Similarly, its Price-earnings and Price/Cash flow ratio at 12.98 and 6.04 are much lower than markets standards of 16.25 and 10.38 respectively. (American Express Company. 2008).
Conclusions
American Express enjoys the prerogative of being the largest credit card company in the world. In order to retain this position, it has invested in advanced technologies to serve customers with optimum efficiency and effectiveness. For this, they have entered into strategic alliances and internet applications.
“Web-enabled applications allowed the company to handle 78% of their customer transactions – from payments to disputes – via the Internet, with over 5.5 million U.S. cardmembers… resulting in unit cost reductions of up to 60% for certain transactions, reduced rates of credit problems of credit card fraud (by up to 96% at certain merchants and overall by over 25% in 2001) and of customer disputes (by up to 50%).” (Case Study in “on-demand” computing, 2007).
It is expected that in the time to come the company would be able to add brand value and reinforce its customer base by serving a large segment of the global community desirous of using its products and services.
References
The 100 Top Global brands 2006. (2000-2007). McGraw-Hill company. Business Week. Web.
American Express company. (2008). Hoovers. Web.
Consolidated financial highlights. (2007). American Express Company. Web.
Consolidated financial highlights: Financial Review. (2007). American Express Company. P 29. Web.
American Express Company. (2008). Hoover: Web.
Consolidated financial highlights: Uncommon Service: ANNUAL REPORT 2007: American Express Company. Shareholders’ Returns: P. 16. Web.
Brigham, Eugene F., & Ehrhardt, Michael C. Financial Management Theory and Practice (10th Edition), Analysis of Financial Statements, P. 74.
Case Study in “on-demand” computing: American Express Company: American Express Company’s internet initiative. (2007). Outsourcing Law. Web.