Introduction
Today, the presence of cybercrime and related fraud represents a significant issue. The statistical data analysis can provide insights on the trends in the occurrence of the electronic crimes, the frequency of the incidents depending on the region, and help to classify the offenses. It is crucial to evaluate the statistical data on one of the aspects of crime because the Criminal Justice System occupies the fourth place in terms of public expenditures (MacDonald, 2002).
Hence, with the active utilization of information technology advancements, it is possible to claim that the field of cybercrime and electronic fraud got more opportunities to spread. The use of statistical datasets in the research is more than computing and reporting numbers, but using this data to reach the conclusions about the significant aspect (Dowdy, Wearden, & Chilko, 2011). In such a way, it is critical to analyse the statistics about a particular area within the crime field because it can create a bigger picture and view the issue from different angles.
The statistical data chosen for this report is the additional tables on fraud and cybercrime provided by the Office for National Statistics. The application of statistical information represents a part of learning process leading to “informed decisions and actions,” and it is beneficial for the research to implement statistics (Pfannkuch & Rubick, 2002, p. 4). Moreover, different industries conduct a statistical investigation “to learn more in the context sphere” and to synthesise new ideas, thus adopting a rational way of thinking (Pfannkuch & Rubick, 2002, p. 4).
The area of crime analysis and prevention, including a broad area of cybercrime and fraud, are not the exclusions and can utilise the collected datasets for its benefit. The use of this data implies the fact that it is useful and beneficial for the research because it provides an inexpensive way of collecting the information. Besides, it gives broader opportunities to analyze and evaluate the provided numbers and come up with a conclusion within the narrow topic.
The analyzed dataset represents a piece of information that was officially collected from numerous processes and practices in the juridical system. Even though this data is organizational, it is still critical to consider possible variations and unaccounted incidents. Hence, one should reckon the units presented in the statistical figures because it can help to identify whether the used aggregation level can lead to prejudices in the conclusions (Rengert & Lockwood, 2008). It is vital to remember this factor because statistical analysis also serves as a prediction tool to estimate the possible number of crimes in the future.
The two estimation methods include relying on the rates from several months’ data or calculating based on the nation’s standards (Barnett-Ryan, 2006). Checking through both of those estimations can be critical for ensuring the integrity of the statistics because it depends on “whether different measures of the same phenomenon yield similar results” (Rosenfeld, 2006). Consequently, the guarantee of the data’s validity and reliability are significant factors in using specific datasets for the research.
Data Source
As the section above mentions, the analyzed statistical data was provided by the Office for National Statistics. The data represents the estimates from the Crime Survey for England and Wales (CSEW) and the information from Home Office police recorded crimes (Office for National Statistics, 2019). The findings provide specific information on fraud and computer misuse, eliminating other types of crime from the statistics to generate a clearer and objective picture. The analyzed data includes information on the local level, describing the situation, not in the UK, but in two of the primary areas. Besides, the latest dataset released and portrayed in the Appendices provides the information until December 2018. However, the data explanation and discussion section also account for the figures from the previous years.
New datasets are released every year to reflect the latest statistical information on the cybercrimes within the area. Consequently, it is critical to keep in mind that the numbers for the year ending December 2019 were not published yet and might be different. Hence, the situation with fraud and computer misuse might have changed throughout the previous year and will require further assessment once available.
Another crucial feature of the presented dataset is that it uses descriptive statistics to show the information. It is a quantitative measure of analysing the data, which is used to describe the findings of the groups of fraud and electronic crimes and the distribution of incidents among the groups of specific regions. Descriptive research plays a fundamental role in information gathering because one of its primary concerns is external validity, which is crucial for the investigation of cybercrime and fraud (Adams & Lawrence, 2019).
Besides, some of the information presented in the statistical findings refers to experimental statistics, because it provides the comparison in the crime rates on an annual basis. Although the general principle for the research in crime and justice is the implementation of non-experimental methods due to the significance of external and internal validity, experiments can be useful (Lum & Yang, 2005). Thus, the findings show different statistical methods, and, for further evaluation, it is possible to integrate correlation methods to come up with more insights.
Data Presentation
The information from the Crime in England and Wales: Additional tables on fraud and cybercrime are presented in the Appendices (Office for National Statistics, 2019). The figures below provide the numbers revealed in the statistics to gain a clearer understanding of the findings for future interpretation in the research. The information is organized in three graphs for a precise visual representation. The explanation and analysis of the statistical information can be found in the next section of the paper.


Data Explanation and Discussion
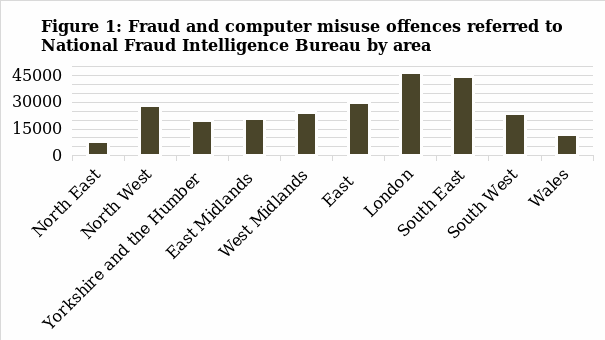
The section above provides the figures representing trends in crime. Figure 1 shows the frequency of fraud and computer misuse offences by area, from which it is possible to claim that region with the highest number of incidents, is London and South East of England. According to Levi, Doig, Gundur, Wall, & Williams (2015), London represents one of the world’s largest financial centres, which at the same time opens up more opportunities related to cybercrime. The daily turnover in London exceeds £2.5 billion, where most of it depends “on a highly interconnected electronic infrastructure and supporting technology” (Levi et al., 2015, p. 2). In such a way, London presents numerous possibilities for the criminal to perform their activities, which can explain the fact that the city occupies one of the first places in terms of cybercrime occurrence.
With different cybercrime incidents across England and Wales, various measures are implemented within the areas. For instance, the City of London Police is one of the institutions that actively work on the reduction of fraud. The operations include providing additional training in both private and public sectors, leading a victim care unit based in London, and collaborating with law enforcement (Levi et al., 2015). Consequently, the areas’ authorities work hard towards positively impacting the statistical data for the next period. They aim to reduce the number of cybercrimes during the times when the expansion of online activities becomes an attractive platform for criminal acts and machinations.
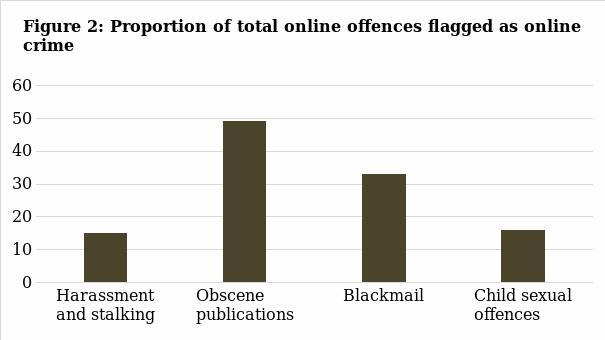
The next substantial piece of information provided by the statistics is the proportion of particular offence groups in the total number of online incidents. One can notice here that the more significant part is taken by obscene publications and blackmail, which implicates that those offence types are most common within electronic crimes. Those types of misdeed involve such factors as the use of the programs that “do not fir under the classification crimeware” and the frequent contact among the criminal and the victim (Gordon & Ford, 2006). It is also vital to consider that there are different types of blackmailing. One of the dangerous and problematic areas is sextortion or webcam blackmail when the criminals befriend the users with the purpose of further offence (National Crime Agency, 2020). Thus, this type of online offence represents severe dangers for individuals and requires careful attention and rigid measures from the authorities.
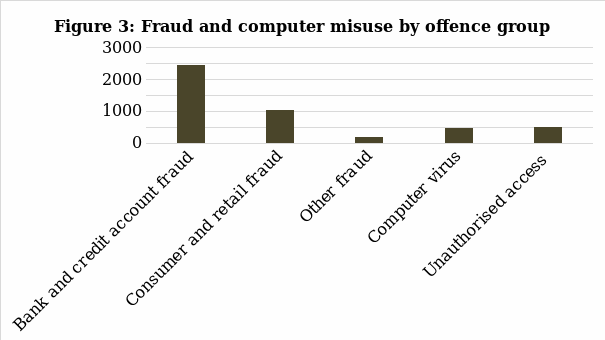
In Figure 3, one can see that the most common type of crime connected to fraud or computer misuse is the bank and credit account machinations. First, it is essential to understand the concept of this type of fraud and how it affects individuals. One of the definitions suggests that it is “the process of creating and making an understanding between consumers and e-fraudsters through online activities that exchange false ideas” (Mahdi, Rezaul, & Rahman, 2010, p. 232). Thus, in those cases, the e-fraudster comes out as a winner while the consumers are the fraud victims. Such crime types as ATM & internet, theft & fabrication, counterfeit, application and transaction of funds, and manner & timing can be identified in the field of fraudulent bank activities (Delamaire, Abdou, & Pointon, 2009). Consequently, the diversity of possible operations related to bank and credit account fraud point out the frequency of those incidents.
In Figure 3, one can notice that the next class of fraudulent online activities is occupied by consumer and retail fraud in terms of occurrence. It can be explained by the growing influence of technologies on different spheres of everyday life, which leads to the increased demand for online commerce. Numerous strategies to protect online retail businesses from fraud exist on the market, including blacklists, the review of individual transactions, or the implementation of hand-crafter rules designed by experts (Altendorf, Brende, Daniel, & Lessard, 2005). It is possible to say that the current measures do not provide the highest effectiveness in protecting e-commerce from financial or information breaches machinations. Some of the additional techniques that the businesses can implement include the integration of analyst simulator into the system or utilising the fraud classifier at the final steps of the purchase (Altendorf et al., 2005). Hence, the use of numerous safety and protection tools can have a positive impact on reducing the number of consumer and retail fraud.
Evaluations and Conclusions
The sections above provide the information about statistical data on fraud and computer misuse in England and Wales and its analysis with the help of graphical representation. One can claim that the conducted assessment provides insights into the situation within the discussed areas in terms of cybercrime. The findings reveal useful facts, such as which regions are more affected by online offences, which groups are most spread, and which ones occupy the highest proportion within the electronic criminal activities. Hence, the analysis served as an efficient tool in assessing information in search of the primary trends and potential conclusions.
Still, it is critical to mention that the data represents that information year ending December 2018, as mentioned in the data source section, which implies potential changes for the upcoming release of the latest numbers. Moreover, the dataset includes the figures gathered by the crime survey, which gives a particular level of ambiguity to the findings. Nevertheless, the data is provided by the Office for National Statistics and is supported by the conducted research based on the analytical results. One can conclude that the information is relevant and represents the situation in the chosen area, portraying the seriousness of the fraud and cybercrime issue.
The statistical analysis emphasises the significance of the measures’ implementation to improve the situation and continue to fight this crime sector due to its expansion with the technological advancements. The strategies to combat cybercrime should establish the right balance between pursuit, prevention, protection, and preparation (Saunders, 2017). It is crucial to account for the offenses’ diversity and for their spread among different areas, which requires the creation of a broad-based approach. Some of the steps taken by the UK government include the support to the victims, the increase of protective security, and the identification and prosecution of the worldwide criminals (Saunders, 2017).
Furthermore, it is essential to raise public awareness about the issue of fraud and computer misuse. Hence, the suggestions include possessing strong password, security software installation, and timely operating system updates (National Crime Agency, n. d.). Compliance with those strategies and the implementation of stricter procedures aim to tackle the frequency and spread of cybercrime.
References
Adams, K. A., & Lawrence, E. K. (2019). Research methods, statistics, and applications (2nd ed.). London, UK: Sage Publications, Inc.
Altendorf, J., Brende, P., & Lessard, L. (2005). Fraud detection for online retail using random forests.Web.
Barnett-Ryan, C. (2006). Introduction to the uniform crime reporting program. In J. P. Lynch & L. A. Addington (Eds.), Understanding crime statistics: Revisiting Divergence of the NCVS and UCR (pp. 55-92). Cambridge, UK: Cambridge University Press.
Delamaire, L., Abdou, H., & Pointon, J. (2009). Credit card fraud and detection techniques: a review. Banks and Bank systems, 4(2), 57-68.
Dowdy, S., Wearden, S., & Chilko, D. (2011). Statistics for research (Vol. 512). John Wiley & Sons.
Gordon, S., & Ford, R. (2006). On the definition and classification of cybercrime. Journal in Computer Virology, 2(1), 13-20.
Levi, M., Doig, A., Gundur, R., Wall, D., & Williams, M. (2015).The implications of economic cybercrime for policing.Web.
Lum, C., & Yang, S. M. (2005). Why do evaluation researchers in crime and justice choose non-experimental methods? Journal of Experimental Criminology, 1(2), 191-213.
MacDonald, Z. (2002). Official crime statistics: Their use and interpretation. The Economic Journal, 112(477), 85-106.
Mahdi, M. D. H., Rezaul, K. M., & Rahman, M. A. (2010). Credit fraud detection in the banking sector in the UK: a focus on e-business. In L. Berntzen (Ed.), The Fourth International Conference on Digital Society (pp. 232-237). St. Maarten, Netherlands: IEEE.
National Crime Agency. (n. d.). Cybercrime. Web.
National Crime Agency. (2020). Sextortion (webcam blackmail). Web.
Office for National statistics. (2019). Crime in England and Wales: Additional tables on fraud and cybercrime. Web.
Pfannkuch, M., & Rubick, A. (2002). An exploration of students’ statistical thinking with given data. Statistics Education Research Journal, 1(2), 4-21.
Rengert, G. F., & Lockwood, B. (2008). Geographical units of analysis and the analysis of crime. In D. Weisburd, W. Bernasco, & G. Bruinsma (Eds.), Putting crime in its place: Units of analysis in geographic criminology (pp. 109-122). New York, NY: Springer.
Rosenfeld, R. (2006). Explaining the divergence between UCR and NCVS aggravated assault trends. In J. P. Lynch & L. A. Addington (Eds.), Understanding crime statistics: Revisiting Divergence of the NCVS and UCR (pp. 251-268). Cambridge, UK: Cambridge University Press.
Saunders, J. (2017). Tackling cybercrime–the UK response. Journal of Cyber Policy, 2(1), 4-15.