Introduction
England, Northern Ireland, Wales and Scotland all make up the United Kingdom (UK).The UK has a long and rich history in international affairs (Office for National Statistics 2011). In addition, it plays a vital role in the UN, NATO, and the EU.
The Stonehenge people are believed to have been the earliest occupants of Britain, followed by the Celtic people. They were followed by the Romans in 1st century B. C. by the end of the 5th century A. D., they had already withdrawn from the UK. As a result, Britain was invaded by the Jutes, Saxons, and Angleles, who moved in from Scandinavian countries (Mathias 2004).
Nonetheless, the Celtic people who occupied Scotland and Wales were least affected by these invasions. The invasions also led to the establishment of seven large Anglo-Saxon kingdoms. In the 10th century, the kings of Wessex assumed control, in effect uniting the country. In 1066, Edward the Confessor died and as a result, a dispute ensued about his successor.
At this time, Harold II, the king of England was defeated by William, Duke of Normandy at the battle of Hastings. Once he had conquered Britain, The Norman introduced feudalism and French law. Britain still retains the honors of the first industrialized country in the world. In addition, it has one of the largest global economies.
For a long time, Britain’s economy has relied heavily on service industries as opposed to manufacturing (IMF 2006). In addition, the pound has enjoyed stability against some of the major currencies, even in the face of the recent global financial crisis. Although Britain is a member of the EU, it remains outside of the Euro zone. Lately, the UK has embarked on a plan to hand over power to Wales and Scotland.
Although the UK remains ethnically diverse, in recent years, the country has had to deal with issues of immigration, multiculturalism, and national identity. The current report is an attempt to undertake an economic analysis of the UK. In this case, the report shall undertake a macroeconomic study of the UK. Some of the country’s macroeconomic indicators like real GDP growth shall be examined.
In addition, the report will also examine UK’s fiscal indicators, as well as the international indicators. The critical problems facing businesses in the UK shall also be examined, in addition to analyzing the future business prospects in the UK.
Macroeconomic Study
Major macroeconomic Indicators
Real GDP growth rate
In the third quarter of 2011, the GDP of the UK increased by 0.5, in comparison to a similar quarter in 2010. This growth was driven by strong production and service sectors. In the third quarter of 2011, production industries recorded a 0.5 percent reduction in output. This was a slight improvement over the 1.2 percent reduction in output recorded in 2010.
During the same quarter, the construction industry also registered a slight drop in GDP of 1.1 percent. Chart One below illustrates the UK’s GDP growth rate.
The slight increase in GDP is good news because it may help to lower unemployment. Consequently, we are likely to witness an increase in consumer spending power because people have more money. However, increased spending may trigger inflation, in effect ushering in a vicious cycle.
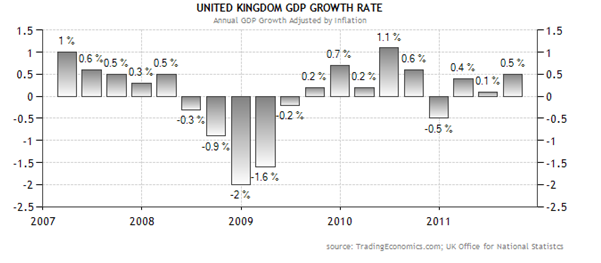
(Source: UK Office for National Statistics 2011)
Unemployment
According to the Office for National Statistics (2011), the UK had an unemployment rate of 8.1%, between July and September 2011. The increase in unemployment has come about because not many businesses are hiring staff because of the volatile business environment both in the UK and in the Euro zone. This has been occasioned by recent global recession.
The increase in the rate of unemployment has also been exacerbated by the turmoil in the financial and housing market. An increase in unemployment means that consumers have a reduced spending power. As such, businesses are likely to record reduced sales revenue as well. This will also have a knock-on effect on the national economy because the government will end up collecting less revenue.
Current Balance in the balance of payment
In Q1 2011, the UK had a current account deficit of € 1,031 on its balance of payment (Central Statistics Office 2011). This was an upward improvement compared to the €1,468 deficit recorded in Q1 2010. The merchandise balance for Q1 2011 was €9,117m, almost similar to the €9,176 m recorded for Q1 2010, according to Table 1 below.
(Source: Central Statistics Office 2011)
Fiscal Indicators
Ratio of gross fiscal deficit to nominal GDP
In 2008, the UK registered an improved ratio of nominal GDP to fiscal deficit, at -7.3, compared to the -14.3 recorded in 2009, at the height of the global financial crisis. In 2010, the ratio was estimated at -11.7, showing a slight improvement following the reduction in government spending and the introduction of a stimulus package to revive the economy (Global Finance 2011).
The negative ratio of UK’s fiscal deficit to nominal GDP means that the government could be using foreigners’’ savings to cater for the shortfall in the budget. This is a risky move because it may lead to a crowding out effect. It can also result in currency depreciation.
Levels of government expenditures and their ratio to nominal GDP
In 2010, the UK’s actual government expenditure was at £ 660 billion. This figure is estimated to increase to £ 683 billion by the end of 2011 while in 2012, 2013, and 2014 the total government expenditure is forecasted at £ 703, 722, and 744 billion, respectively (UK Public Spending 2011). At the same time, the UK GDP is estimated to increase in tandem with an increase in total expenditure, according to figures I and II below
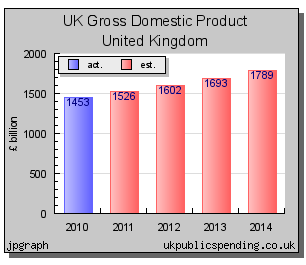
(Source: UK Public Spending 2011)
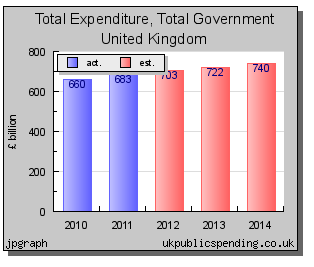
(Source: UK Public Spending 2011)
Levels of revenue (tax plus non-tax) and their ratio to nominal GDP
In the 2007/08 fiscal year the UK’s overall government revenue was 39.2 percent relative to its GDP. At the same time, National Insurance contributions and net taxes were estimated at approximately £600 billion, or 36.9 per cent of the country’s GDP (OECD Revenue Statistics 2008). In addition, UK’s tax revenue as a percentage of GDP compared favourably with that of the EU and other OECD countries, as per Chart II below.
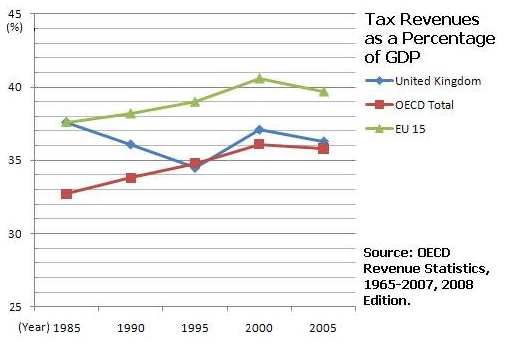
(Source: OECD Revenue Statistics 2008).
Between February 2011 and September 2011, the UK’s one month money supply averaged 0.9 per cent, while the 12 month money supply was projected at an average of 1.8 % growth rate (Evans 2011).
Rate of inflation
In September 2011, the U K recorded an annual inflation of 5. 2 percent and the following month, the figure dropped to 5.0 per cent. The change in CPI annual inflation during this period is attributed to good harvest for certain farm produces, and a reduction in air fares, petrol, and cost of food. At the same time, the cost of electricity, gas, and clothing went up.
Between 1989 and 2010, the United Kingdom recorded an average inflation rate of 2.72 percent and in April 1991, the UK recorded a historical figure of 8.50 per cent inflation (Trading Economics 2011). Chart III below shows the historical data and news of the UK from July 2008 to July 2011.
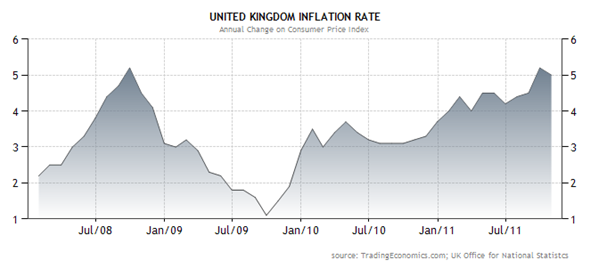
The high inflation, compared to the average figure recorded above may result in reduced investment in the UK. People have low savings because money was depleted by increase in price gas, clothing, and electricity. This may also trigger an increase in interest rates, owing to reduce consumer purchasing power.
(Source: UK Office for National Statistics)
International indicators
Openness index (defined as imports plus exports as a ratio of GDP)
The UK has witnessed a steady increase in total trade flows relative to the country’s GDP. In the 1960s, UK’s imports plus exports was estimated at one third of the country’s GDP. By 2010, this figure had increased significantly to more than 60 per cent of UK’s GDP (Bank of England 2011). At the same time, the UK has witnessed increased investments by multinational businesses.
Levels of exports and rate of growth of exports
The UK continues to experience an increased rate of growth in its exports but over the last quarter, the rate of growth has somewhat eased as a result of the economic fragility that has engulfed the Euro zone. Consequently, this has hindered plans by exporters to expand.
Nonetheless, more than half of exporters are optimistic that their profitability and turnover could improve in the next twelve months (Clarke 2011). The increased uncertainty about how the Euro zone debt crisis will be resolved, along with the fragile nature of UK’s economic recovery implies that exporters in the country are reluctant to increase the number of employees.
Levels of imports and rate of growth of imports
For the past one year, the rate of growth in imports has increased by 10 per cent (Smith 2011). In 2011, exports alone have increased by 17 per cent, in effect fueling the manufacturing revival. In spite of the collapse of the global economy in 2008-09, the revival of UK’s export performance has been impressive. In 2009, the growth of imports fell by approximately 12 per cent but in 2010, it increased by between 12-13 per cent.
Levels of foreign exchange reserves
The UK government sought to increase its foreign reserve levels by $ 2.253 in March, 2011.This came hot on the heels of the decision by the Bank of England to help in bringing stability to the Japanese yen after it had been stabilized by the March 11 tsunami and earthquake (Market News International 2011).
Following this decision, the country’s net foreign exchange reserves increased to $ 41.139 billion (Office for National Statistics 2011). At the same time, the total foreign exchange reserve also rose, to $85.507bn.
Critical Problems
The number of firms in the UK faced with ‘significant’ financial problems is on the increase. This shows that vulnerable firms are making the painful transition to ‘critical’ problems. Some of the sectors that have been hit hardest by this transition include hotels and accommodation (47 %), Travel and Tourism (31 %), and General Retailing (17 %) (Grant 2008).
Businesses in the UK also have to contend with complaints from customers that they are bombarded by too much advertising. Reports indicate that many consumers are more interested in services and products that enable them to block or skip advertising.
On the other hand, there is no sign of improvement by firms in the property services sector, with many of them having already recorded a 42 % critical distress quarter on quarter.
The Logistics and Haulage sectors have especially been hit hard owing to the impact of the increasing fuel process (Manufacturing & Logistics IT 2011). In addition, figures from the Food and Beverage Manufacturing reveal a 24 % year-on-year rise in ‘critical’ problems. This is the first actual increase for the sector in question (SMEWeb 2011).
Concerns over job security and inflationary pressures have squeezed a large proportion of the population and as a result, they have become increasingly cautious about how they spend their money. This has impacted on the tourism and travel industry in a negative way.
The UK hotel market has been hit hardest. For example, since the last quarter, the sector has experienced a 47 % rise in critical problems. Moreover, the UK economy is still reeling from a depressed consumer spending. This, along with the effects of the significant utility bills and the rise in fuel costs, may result in additional serious consequences for those businesses that rely on discretionary spending.
The depression within the property market does not show any signs of improvement, given that there has been a 42 % increase in critical problems quarter-on-quarter (Out-Law 2011).
Both commercial and residential real estate have been affected by this distress, and recent surveys forecasting that we may not be experiencing the property prices of 2007 for the next 10 years. The increase in oil prices, along with the decision by the government to increase value added tax (VAT) in January has seen a lot of businesses prioritizing on credit control and cash flow.
Some of the businesses have even turned to courts as a way of seeking payments. The volatile nature of oil prices in recent years has had a dramatic impact on the UK economy. Considering that the UK is a net importer of oil, the impact of oil shocks are still not very clear because increased oil prices should ideally lead to increased oil revenues.
Future Prospects
In 2009, UK’s GDP reduced by 4.75 % but in the fourth quarter of the same year, the GDP was once more in the positive territory. In early 2011, the quarterly growth of the GDP somewhat slowed down after VAT had been reverted to 17.5 %.
However, the economy has been on a gradually recovery for the better part of 2011 due to the effects of past monetary and fiscal policies loosening feed through (Out-Law 2011).
Compared to 2009, the UK economic growth was more balanced in 2010 and 2011. In 2009, consumer spending fell by 3.25 % and in 2010 it fell further by 0.25 %. Such a fall is indicative of a squeeze on household spending powers as a result of prolonged credit constraints.
It is also predicted that the level of unemployment, which hit the 3 million mark during the second half of 2011 will keep on increasing in 2011. This is because businesses are feeling the heat of reduced consumer spending and the increase in the global oil prices and inflation. As such, businesses are less likely to employ more staff when recovering from a recession.
As such, business investment in the UK may be expected to remain weak for the remainder of 2011, as was the case in 2010. This is a reflection of continued influence of comparatively tight credit conditions, as well as subdued final demand growth. Nonetheless, these may be expected to ease over time.
In addition, we can also expect that housebuilding shall remain somewhat subdued in 2011, although the worst decline phase in the construction industry may have already passed. In 2009, 2010 and 2011, net exports had a positive impact on the GDP growth of the UK.
Since 2007, the pound has fallen in value, thereby helping to boost exports. In addition, the Euro zone and the United States have made gradual recoveries from the effects of the global economic crisis. On the other hand, strong growth in India and China, as well as other emerging economies may not benefit the UK economy directly, given that only a fraction of UK exports head to these fast-growing markets.
The UK’s inflation and GDP growth are less likely to remain below target by the end of 2011 as inflation may still be volatile owing to the increase in VAT. Should the economy recover further in 2011, inflation could increase, and this may result in a sharp increase in interest rates later in the year or even in 2012. If this is the scenario, business entities may find it hard to conduct business in the UK.
The recovery of the UK economy may also restrained by the need to ensure that public finances remains under control, at least in the medium term. The government has tightly constrained public spending in 2011, moving on into 2012. This is part of the fiscal austerity programme.
Also, we may also expect tax rises in an effort by the government to reduce its budget deficit. Consequently, this would make the business environment in the UK unattractive, at least in the short term.
Studies estimate that we may need approximately extra fiscal tightening of roughly 1.8 % of the UK’s GDP by 2013/14. This translates into approximately 26 billion every year. Consequently, the government has no choice but to institute public spending and increased taxation.
Conclusion
In spite of the negative effects of the global financial crisis on UK’s economy, the country has managed to record a 0.5 percent increase in GDP in the third quarter of 2011, compared with a similar quarter in 2010. However, unemployment is still high at 8.1 per cent. The UK also recorded an improved current balance in the balance of payment, in 2011 compared with 2010.
On the other hand, the country’s ratio of gross fiscal deficit to nominal GDP has not improved much since the start of the global recession. The UK’s tax revenue as a percentage of GDP compares favorably with that of the EU and other OECD countries. In October 2011, the UK recorded a 5.2 per cent inflation which is high compared with the 2.7 per cent average recorded between 1989 and 2010.
Although the UK has been experiencing an increase in the growth of imports, nonetheless, this rate has somewhat reduced over the last quarter owing to the economic fragility that has engulfed the Euro zone. The rise in fuel cost, concerns over job security and inflationary pressure are all some of the critical problems facing businesses in the UK.
Consumer spending is still depressed, and this has really hit the hospitality industry, which relies heavily on discretionary spending. The property market is still depressed, with no signs of improvement. The future prospects of business in the UK may look bright but business owners are advised to tread carefully. Some of the major economies in the Euro zone are still fragile, and this could spill over into the UK.
In addition, oil prices keep on fluctuating, further increasing the uncertainty of businesses that are dependent on oil. Also, the increase in VAT by the government, coupled with reduced consumer spending all combine to make it rather difficult to transact business. However, these are mainly short-term setbacks and in the mid-term and long-term, it would be worthwhile to invest in the UK.
Reference List
Bank of England., 2011. Setting UK monetary policy in a global context. Web.
Central Statistics Office., 2011. Balance of International Payments. Web.
Clarke, M., 2011. UK exports grow, rate slows. Web.
Evans, M., 2011. U.K. September M4 Money Supply, Lending Growth Rates. Web.
Global Finance., 2011. Public Deficit by Country. Web.
IMF., 2006. Report for selected countries and subjects. Web.
Grant, J., 2008. UK companies in distress double. Web.
Manufacturing & Logistics IT., 2011. Uncertainty could delay investment in manufacturing sector. Web.
Market News International., 2011. UK Official Foreign Exchange Reserves Rose $2.253bn In March. Web.
OECD Revenue Statistics., 2008. Revenue Statistics 2008. Web.
Office for National Statistics., 2011. Labour market statistics. Web.
Office for National Statistics., 2011. UK Trade statistical bulletin. Web.
Office for National Statistics., 2011. Population Change. Web.
Out-Law., 2011. More construction companies facing financial problems, report says. Web.
SMEWeb., 2011. UK firms on financial ‘critical’ list rises 12 %. Web.
Smith, D., 2011. UK: Wave of Imports Hits Export-Led Growth. Web.
Trading Economics., 2011. United Kingdom GDP growth rate. Web.
Trading Economics., 2011. United Kingdom Inflation Rate. Web.