Introduction
Background Information
Ashtead group provides rental solutions in various situations such as facilities management, nonresidential construction markets, disaster relief, traffic management and major event management. It provides equipment such as lifts, powers, generates, moves, digs, pumps, and directs for rental purposes.
It was founded in 1947 as Ashtead Plant Hire Equipment Limited. The Group trades in the London Stock Exchange under the ticker symbol AHT (Ashtead Group PLC. 2012a; Ashtead Group Plc. 2012c)
Markets Division
The company operates in the United States of America and the United Kingdom. In the US, it operates under the brand name Sunbelt Rentals and A-plant in the UK.
Sunbelt has over 372 outlets across various cities in the US while A-plant has over 110 outlets in the major cities of the UK. In the US, the Group has engaged about 6,822 employees while in the UK, it has employed about 1,916 employees.
The operating revenue for Sunbelt as at 31st October 2012 amounted to 1,041 million while for A-plant amounted 199 million. Based on the comparisons above, it is evident that the operations of Ashtead Group in the US are greater than the operations in the United Kingdom.
Market share of Ashtead Group is greater in the US than the UK. In the US, it is the second largest in the equipment rental business while in the UK it is the third largest (Ashtead Group Plc. 2012b; Ashtead Group Plc. 2012d, Ashtead Group Plc. 2012f).
Issues Facing the Management
The key issue facing management is how to manage the leverage level of the group so as to attract new investors (Smith & Smith 2003). The company aims to seek new funding that can help in expanding the business but the company cannot receive either equity or debt because of the high leverage (Ashtead Group Plc. 2012g).
Commercial Financial Environment
Ashtead’s Business Environment
Ashtead Group operates in construction equipment rental business industry both in the US and the UK. Since it operates in various locations and deals in a wide range equipment, the Group faces a complex business environment.
The location of the businesses offers the Group a diverse legal and political environment for operation (Berkshire Hathaway Company 2013). It is necessary to analyze both the internal and external environments of the Group so as to ascertain the strengths, weaknesses, opportunities, and threats that the entity faces (Skinner & Kim 2010).
Ashtead Group has a strong brand both in the US and UK. This enables it to be on top of the competition. The strong brand name has been built for over six decades. Another strength of the company is that it has a wide range of products and services to offer.
Diversification is a source of financial strength for the company because if one product does not perform as expected in the market, revenue from other products will cushion the company finances (Shim & Joel 2008). Thirdly, the group has extensive and well built distribution network both in the US and the UK.
It enables the Group’s products and services to penetrate the markets easily. Also, the Group engages qualified personnel to run businesses. This ensures quality work in all areas of operation (Sirman, Hitt, & Ireland 2003). Further, the Group makes use of latest technology in the market.
Finally, the Group has good business relations with the host countries. It complies with all the regulatory framework. This creates a conducive environment for its operations (Siddidui 2005). A major weakness for the company is that the markets are concentrated in the US and the UK only.
Any major changes in the two markets are likely to impact heavily on the financial performance of the Group.
The company has a number of opportunities to venture into. To start with, the global recession that hit the global economy made the Group to stop most of its expansion programs (Steven 2007). Therefore, the Group has a number of investments to make (Rachels 2009).
Secondly, the company should consider investing in regions outside the US and the UK. This offers the Group opportunity to expand its global presence and increase revenues (Samuels, Wilkes, & Brayshaw 2005).
The company faces a number of threats. First, the constantly changing regulations impacts on the operations of the business (Power, Walsh, & O’ Meara 2007).
For instance, the US came up with a law which requires a change from the use of off road diesel engine to full compliance with the Tier 4 carbon emission regulation (Ashtead Group plc. 2012e, Ashtead Group Plc. 2012h; Ashtead Group Plc. 2012i).
This change is capital extensive and would impact heavily on the finances of the company. Further, the environmental, health and safety regulation are quite expensive to comply with. Stiff competition is another threat that the company faces (Shapiro 2005).
It is one of the top equipment rental companies both in the US and UK. The company faces competition from other large companies such as United Rentals, RSC Equipment Rental, Hertz Equipment Rental Corp, and Home Depot Rentals.
Ashtead Competitive Position
The key driver for the construction rental business is the construction of non-residential and heavy constructions (The American Rental Association 2012a; The American Rental Association 2012b).
The construction equipment rental business does well in the US more than the UK. In the US there are over 12, 200 construction rental businesses. The US industry has experienced tremendous growth in the recent past.
The growth is characterized by increasing fleet utilization rates. Large companies have increased their fleet sizes. In addition, there is significant acquisitions and mergers geared towards increasing the market size (Penton Business Media 2012a).
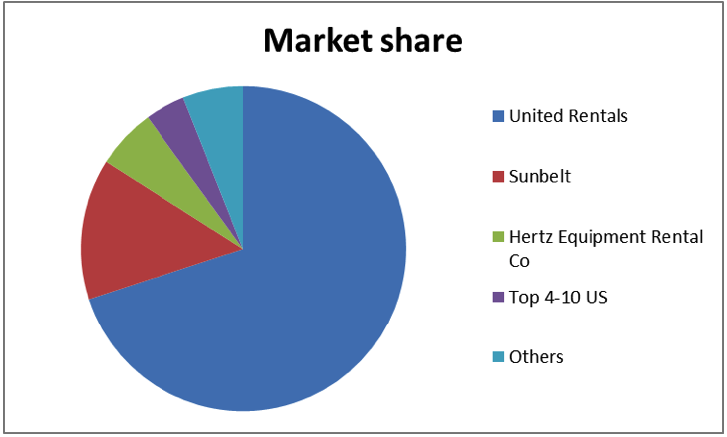
As at 2011, the four large companies these are, United Rentals, RSC, Sunbelt, and Hertz Rental Equipment (The Financial Times Limited 2011) accounted for 22% (equivalent to $27 billion) of the market share for the construction rental equipment industry in the US.
The remaining 78% is shared among the other small companies. It shows the existence of stiff competition among the top four large companies. The table below shows the top companies in the US their market share. Source – (Penton Business Media 2012b)
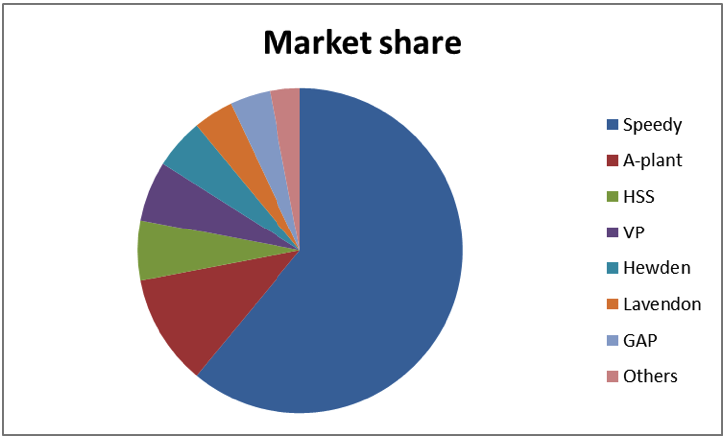
Construction rental equipment industry is not booming in the UK as compared to the US market. In the UK the company Ashtead faces competition from companies such as Hewden, Hawk, Speedy. The top ten companies account for about 53% of the plant hire industry.
Speedy takes 15% of the market share. Based on the gross book value, Speedy Hire is the largest followed by HSS Hire Service, A-Plant Tool Hire, GAP Group, and Jewson Tool Hire (Executive Hire News 2007). The market share of the companies has greatly changed over the years. The tables below show the market share in 2012.
US market
UK market
Source of data – Ashtead Group Plc. 2012j; Ashtead Group Plc. 2012k
Potential for Future Growth and Major Market Risks
With the shift to rental business in the US, the market is likely to grow to a greater extent in the near future. Further, the global financial crisis caused a number of firms to shut down due to their inability to make sales that can cover the fixed cost of operation (Choi 2003).
Also, the rapid change in technology and regulations is quite expensive for small firms comply with (Bragg 2006). Therefore, they are forced to shut down. The industry is capital intensive and only stable firms like Ashtead Group can survive the market dynamics. This creates a big opportunity for growth.
Despite the availability of opportunities, the Group faces a number of market risks that cast doubt on its ability to tap the opportunities. First, is the economic conditions. Down swings slow down the rates of growth of the Group (Brealey & Myers 2009).
Secondly, competition from local established firms reduces the market share and revenues for the Group. Thirdly, since the industry is capital intensive, obtaining financing is a challenge. For instance, debt financing is limited to a fixed number of years.
One source of financing cannot be adequate for the nature of the business (Brigham & Joel 2009). Fourthly, rapid changes in technology are a major threat to the continuity of the business because the business relies on technology. Investing in the latest technology is a risk to the Group.
Also, attracting and retaining highly qualified personnel is a key risk for the company (Bull 2007). Finally, compliance with health, safety, environmental, and other regulations is a major hindrance to the future success of the Group (Campbell 2005). These regulations change from time to time.
Analysis of Performance Over Past Five Years
The financial statement as they are providing the users with a narrow insight into the financial strength and weaknesses of the company (Dubrin 2008). Therefore, it is of essence to carry out an in depth financial analysis of the performance of the Group.
The analysis makes use of the income statement, statement of financial position and the cash flow statement. The financial analysis is carried out from a debt provider and a shareholder point of view (Dayananda, Irons, Harrison, Herbohn & Rowland 2002).
The shareholders if mostly concerned with the profitability and returns of his investment while a debt provider is mostly concerned with the leverage of the Group. Ratios analysis and graphs will be used to carry out financial analysis of the group for a five year period (Erricos & Cristian 2007).
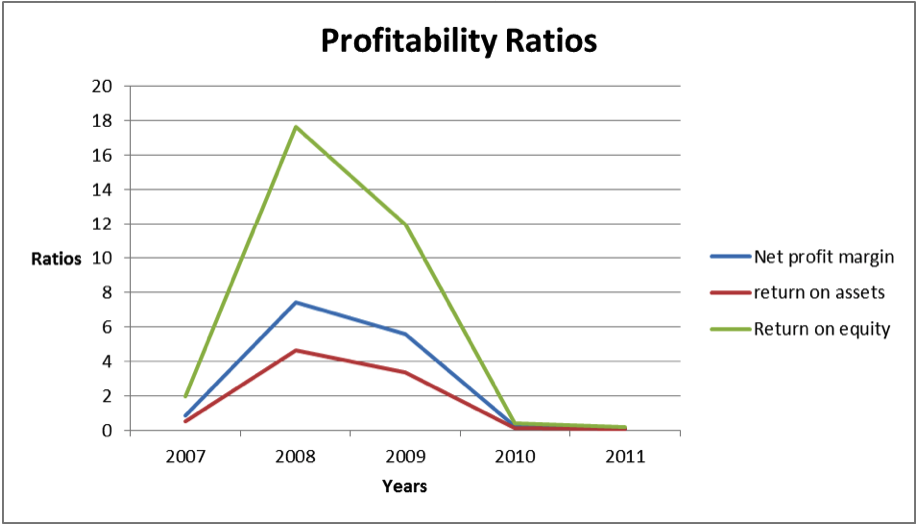
Profitability and financial gearing ratios will be computed for the company. The table below shows the profitability of the company.
The profitability ratios for the company are low. The net profit margin range from 0.09% to 7.41%. Return on assets range from 0.06% to 4.65% and return on equity range from 0.19% to 17.62%. The Group experienced an increase in profitability from 2007 to 2008 thereafter financial performance declined sharply.
The profitability of the Group is on a downward trend since 2008. This might not attract a potential investor. The graph below shows the trend of profitability from 2007 to 2011.
Leverage Ratios
Gearing ratios looks at the capital structure of the company (Eugene & Michael 2009). It focuses on the amount of capital financed by debt in relation to the amount financed by equity (Collier 2009). It also focuses on how well the company’s profits cover interest expense.
This ratio is of essence to a potential debt provider sine it shows them how levered a company is and the ability of the company to meet the interest expense as they fall due (David 2003). The table below shows the gearing ratios for the company of the five year period.
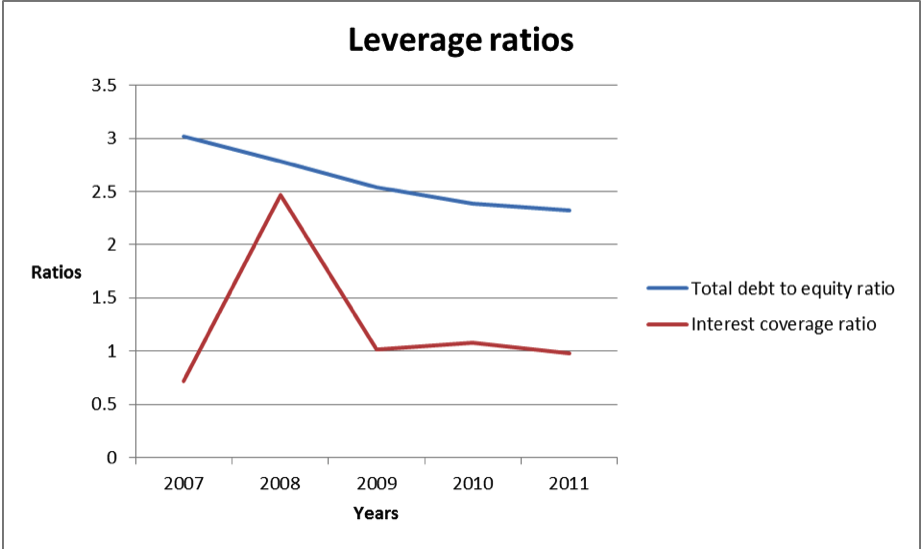
In the above table, the total debt to equity ratio is greater than one for the five years. This implies that the proportion of debt financed by debt is greater than the proportion financed by equity. This shows that the company is highly levered and not desirable for a potential investor. Equity financing takes a small proportion of the capital structure.
A low debt to equity ratio is desirable. Further, interest coverage ratio ranges from 0.7144 to 2.467. These ratios are low and they indicate that the company has difficulties in paying the finance cost. For instance in 2007 and 2011, the company’s operating income could not pay the cost of interest.
Therefore, leverage of the company is very high. It might be very risky for a potential debt provider to out in mode debt in the company. The graph below displays the trend of gearing ratios for the five year period.
From the above review, it is evident that the company relies more on debt financing than equity financing. Total debt exceeds the total equity. The company uses debt from the bank and finance lease.
The situation is not desirable since it increases the finance cost and reduces amount attributed to shareholders. The company’s financial position is not desirable for potential debt provider and a shareholder.
Three Year Forecast for Operating Profits
The Group focuses on maintaining an organic growth of returns in excess of 20%. The growth is achievable due to the fact that there is a potential for growth in the US market because the infrastructure in the US is quite dilapidated and there is need to replace or repair. Besides, the target markets are recovering from the period of recession.
Therefore, there is a possibility of achieving the growth of 20%. Also, in 2011 and 2012, the company has recorded growth in performance which is likely to continue for a few more years. It is evident that the company experiencing a phase of growth in operation.
The forecasts for operating income is based on the assumption that the operating income grows at 10% annually in the first year, 15% in the second year and 20% in the third year. This rates portrays an organic growth. The company will achieve the20% growth in the third year.
The table below shows the forecasts for the next three years. It also shows the current operating profit for the group.
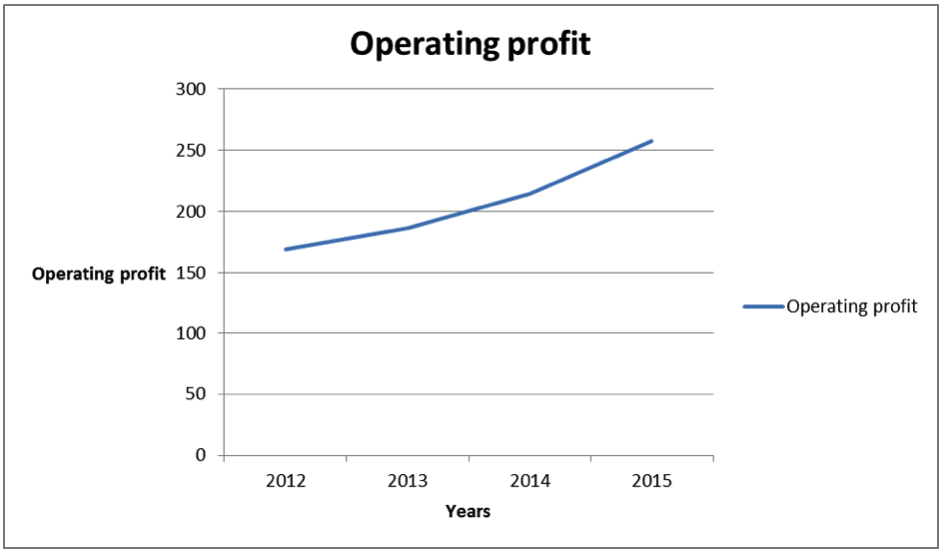
Based on the forecast above, the company will make an operating profit of £186.5 million in 2013, £214.42 million in 2014 and £257.30 million in 2015. Forecasts are conservative and they take into account risks arising from the exchange rate fluctuations.
Besides, considering that the economy just recovered from the recession, it is most certain that it will experience recovery thereafter a boom. This also applies to companies.
Therefore, the forecasts are based on a 90% confidence that the Group will earn the forecasted annual operating profits or even more but not less. The graph below shows the trend of forecasted operating profit for the next three years.
Future Cash Flow and Funding Needs
Funding is required to achieve the growth in operating profit forecasted above. The funding should be adequate so as to meet the working capital and capital expenditure needs (Mark 2002). From the income statement of the group, it is evident that the a great proportion of revenue originates from rental income.
Therefore, it is important that the company incurs adequate amount of money on fleet planning. This is with regard to size, number and fleet utilization. The graph below shows the cash flow and funding for the past five years.
Based on the market conditions, the management is optimistic about improvements in performance and a strong market. The revenue might grow up to 50%. However, this depends on the growth of the fleet and improvement in yield. The management also intends to reduce leverage status of the group up to twice the value of EBITDA.
The Group also intends to reduce fleet age to between 34 and 38 years. Fleet size is likely to increase up to about 25% and EBITDA is also likely to exceed the previous peak up to 35%. Finally, the return on investment is likely to increase in the coming years.
The expected performance can be used to forecast future cash flow and funding needs for the next three years. The table below shows the forecasts for the next three years.
Revenue will grow at 10% in 2013, 15% in 2014 and 20%in 2015. The growth is conservative and achievable due to expansion of the US market. Cash flow will also grow over the years. It is based on the assumption that the debt will reduce while equity will remain constant thus reducing the leverage level of the company.
This implies interest expense will decline thus improving the cash flow (McDaniel & Gitman 2008). Increase in cash flow will also arise from an increase in revenue and operating profit. The fleet age is likely to go down from 38 to 34 months. Also, fleet size is likely to grow in the coming years.
It will increase up to £3,102 in 2015. With the increase in level of operation and revenue, EBITDA will go up to 40% in 2015. Management of the company intends to reduce the leverage level of the company. They expect to reduce the net debt over the years.
The funding needs are based on the assumption that debt funding will go down by 5% every year to £967.61 in 2015. Equity funding will remain constant over the period of the forecast. The funding mix will enable the company to achieve a total debt to equity ratio of 2.0 by 2015 from 2.32 in 2012.
The budget above shows the funding needs of the company for the next three years. It shows the expected flow of revenue, cash flow needs and funding needs. The budgets take into account the capital expenditure, depreciation, working capital movement, taxation, and dividends (Maher, Stickney, & Weil 2011).
All these are shown in the net cash flow. The forecast is also based on the assumption that the company will reinvest a substantial amount of net income into the business. It is due to the fact that the current capital mix and performance of the entity may not allow it to obtain external funding easily.
This may continue for the next three years thereafter it can seek external source of funding (Mankiw 2011). Therefore, the estimates are based on a 90% level of confidence that the company will achieve and even surpass the estimates in the estimates above.
Capital Structure, Funding Analysis and Valuation
Analyzing the capital structure of a company is of utmost importance because it determines the rate at which a company grows (Kinney, Skaife & William 2007). Further, it also dictates the amount of working capital that is available for the company.
The capital structure shows the amount of various ways of funding that the company uses (Kymal 2007). It is of importance to maintain an optimum mix of various sources of funds because the mix have an impact on the profitability, cash flows and amount attributed to shareholders (Longenecker, Petty, Palich, & Moore 2009).
The capital structure that a company decides to use depends on the market the company operates in, the financial planning through the business cycle, the operational excellence of the group and the the next phase of growth patterns of the company (Lys, Collins, & Badertscher 2007).
The table below shows the current capital mix of the company for the year 2012.
The current capital structure of the company comprises of debt and equity financing. The total debt amounts to £875.6 million. It is equivalent to 61.22%. The company uses lease financing, secured bank debt, and secured bank note. Total equity amounts to £554.7. It is equivalent to 38.78% of the capital structure.
Therefore, it is evident that the debt financing is greater than equity financing. The debt to equity ratio is 2.3.
Optimal Level of Debt
Determination of optimal level of debt is a vital decision on financing options to use. Optimal level of debt is the level at which the cost of capital is minimized. It is the level beyond which a firm should not borrow. There are various studies that have been conducted to show the optimal debt – equity mix.
The most popular theory is the Miller and Modigliani model (Mintz & Morris 2011). The model asserts that in the absence of transaction cost, the capital structure of the company has no effect on the value of the firm (Moorad, Joannas, Pereira, & Pienaar 2003). Therefore, the capital mix a firm uses if of no importance.
The theory further asserts that the capital structure of a company is irrelevant. However, various scholars greatly criticized this model (Newage International Publishers 2012).
They argue that the Miller- Modigiliani model is based on unrealistic assumptions of absence of taxes, efficient market, absence of agency cost and perfect information (Nicholson 2000). In the contemporary business world, these assumptions are quite unrealistic and do not exist (Nikolai, Bazley, & Jones 2011).
An example of a scholar with a contrary opinion is the Aswath Damodaran. The scholar is against the irrelevance model. He argues that capital structure has an impact on the value of the firm (Michael & Jon 2010).
Damodaran argues that the amount of debt in the capital structure of the company affect cash flow thus changing debt changes cash flows to equity because cash flow is attained from assets after repayment of debt and making reinvestment for future growth (Melicher & Leach 2009).
He further asserts that as debt increases, equity becomes riskier and the cost of equity will definitely increase. The optimal debt ratio depends on a number of factors (McLaney & Atrill 2008). These are the tax rate, the pre – tax returns on firm, variation in earnings and default spread (McGraw-Hill Higher Education 2007).
Computation of optimal debt will be based on the Damodaran mode thus the amount of debt has an effect on the capital structure of the firm.
The Ashtead Group uses a number of key performance indicators to measure performance for a given period. Of most importance are the underlying earnings per share, return on investment, and net debt and leverage at constant exchange rate.
The Group aims to maintain a “conservative balance sheet structure with a target range for net debt to underlying EBITDA of 2 to 3 times” (Ashtead Group Plc. 2012e).
The Group also aims to “sustain significant availability that is, the difference between the amount we are able to borrow under our asset-based facility at any time and the amount drawn through the cycle” (Ashtead Group Plc. 2012e). It is worth noting that the Group operates in an extremely capital intensive sector.
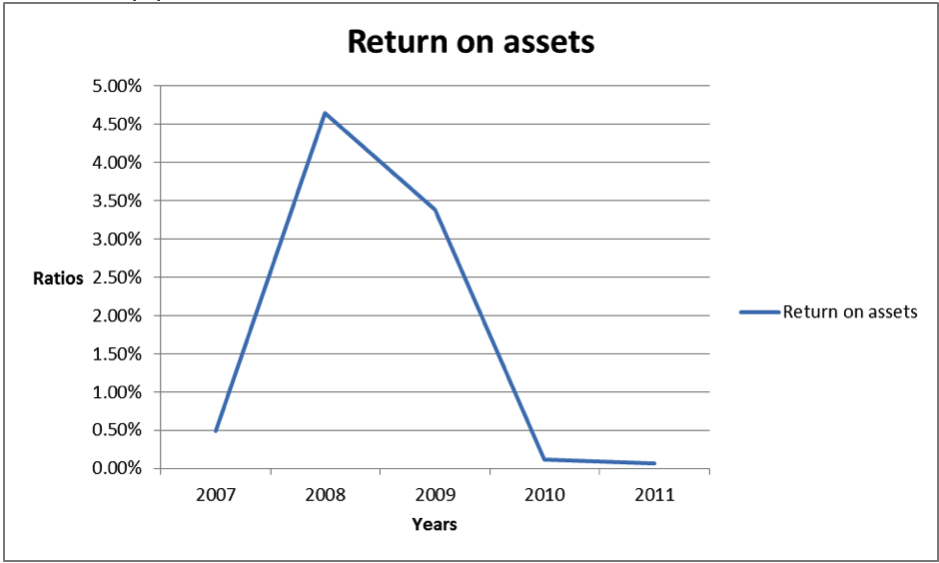
The company heavily relies on asset based financing. It is also of utmost significance to evaluate the returns on assets of the company for the past five years. This would help ascertain if the company is using the assets adequately to generate returns.
From the ratios calculated, it is worth noting that the return on assets of the company are quite dismal and they have a declining trend since 2008. This trend is attributed to the global financial crisis which resulted to low profitability and a sharp decline in equipment rental business.
The table below shows the amount debt of the company for the past five years.
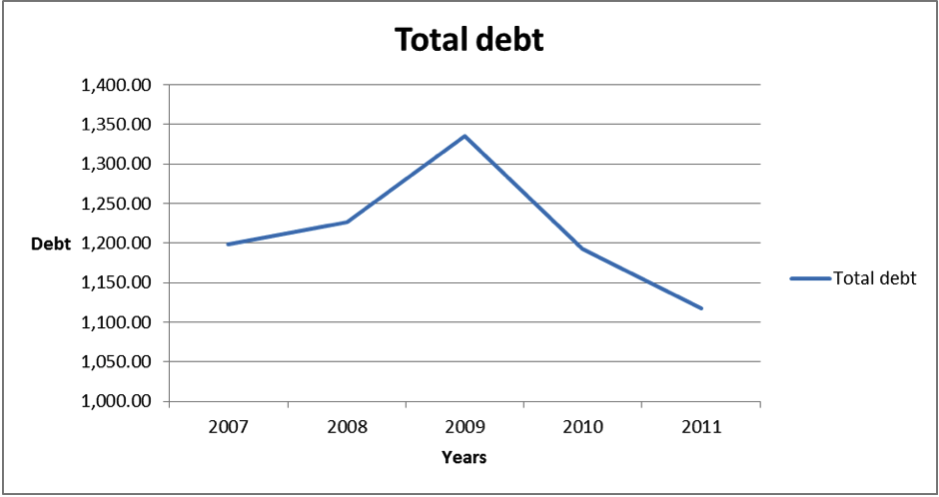
The table above shows the total amount of debt the Group has both short term long term debt. From the table, it is evident that the amount of debt increased between 2007 and 2009 thereafter it started to decline.
The decline is attributed to the management decision to reduce debt to equity ratio to 2 times. The trend of total debt is shown in the graph below.
Calculation of of optimal debt for the group will be based on the underlying theoretical models. The weighted average costs of capital approach will be used to calculate the optimal debt.
Based on this approach, the cost of debt is determined by a number of factors these are, the rate at which the company can borrow long term today (risk free and a default spread) and the tax rate. The cost of debt is not similar to the interest rate at which a company obtains debt. The cost of debt is computed as shown below.
Cost of debt = (risk free rate + default spread) (1 – t)
Risk free rate = 9%
Default spread = 0.4
Tax rate = 26% (corporate tax in the UK is 26%)
Substitute the values
(9% + 0.4)0.26 = 6.956% = 7%
The cost of debt is 7%. It is based on the assumption that risk free rate is 9% and the default spread is 0.4%. Determination of the optimal amount of debt majorly depends on the objective the firm. Use of debt is cheap and it reduces the weighted average cost of capital.
However, increasing the amount of debt increases the amount of weighted average cost of capital as gearing, financial risk, and beta equity goes up. If the Group’s objective is to maximize shareholders’ wealth, then the company must reduce the amount of debt thus reducing beta equity.
Further, the amount of debt is inversely related to its risk.
Cost of equity denotes the of return shareholders require for their investment. Equity is a significant component of the capital structure. It is worth noting that the amount debt in the capital structure has an impact on the cost of equity.
High amount of debt increases risk of equity thus increasing the risk premium that shareholders will require for their investment. Cost of equity is computed using the formula shown below.
Cost of equity = risk free rate + Beta * Risk premium
Risk free rate shows the rate of interest that does not have default risk, no reinvestment risk and are in the same currency. Beta measures the market risk in which the group operates in. Beat depends on the type of business, operating leverage and financial leverage.
Finally, risk premium shows the premium for the average risk of investment.
Cost of equity = 9% + 0.4 * 5.82% = 11.328% = 11.33%
The calculations above shows that the cost of equity is 11.33%. The risk premium is relatively high because of the high leverage. Computation of the weighted average cost of capital is shown below.
The weighted average cost of the capital = cost of equity * proportion equity the capital
structure + cost of debt * proportion debt in the capital structure.
Weighted average cost of capital = 11.33% * 38.78% + 7% * 61.22% = 8.68%
The calculations above can be summarized as shown in the table below.
Even though the market for equipment rental is likely to grow rapidly and equipment rental businesses will require adequate funding so as to tap the growing market especially in the US, there is a need for the Group to maintain a capital mix that will maximize shareholders’ wealth.
Debt offers a cheap source of financing though it reduces shareholders’ wealth. The optimal level of debt in the capital structure should be 50% of the total amount of debt.
Implications of Optimum Level of Debt in the Capital Structure
Currently the proportion of debt in the capital structure is 61.22%. In the event that the proportion of debt is reduced, the risk of debt will go down. Therefore, risk premium used in debt calculation will go down. Summary of calculations is shown below.
Cost of equity = risk free rate + Beta * Risk premium
Cost of equity = 9% + 0.4 * 3.82% = 10.53% = 10.53%
Once the risk premium reduces, the cost of equity also reduces. The calculation for the weighted average cost of capital is shown below.
The weighted average cost of the capital = cost of equity * proportion equity the capital
structure + cost of debt * proportion debt in the capital structure.
Weighted average cost of capital = 10.53% * 50% + 7% * 50% = 8.77%
From the calculations, it is evident that reduction of the amount of debt to 50% reduces the cost of equity from 11.33% to 10.53%. Further, the weighted average cost of capital increases slightly from 8.68% to 8.77%. The information is summarized in the table below.
Criteria for Evaluating Future Funding Needs
Investment decisions require adequate review before injecting funds into the investments because they require massive capital (Arnold, 2008). Further, the decisions are irreversible. Also, there are competing demands for capital therefore, funds should only be channeled to most viable ventures (ACCA 2012; Mankiw 2012).
There are a number quantitative criteria that can be used to evaluate investment. The firm’s key goal is to reduce leverage and increase returns. A significant quantitative approach is the net present value approach (Khan & Jain 2006). It shows the present value of net benefits that a firm expects.
It is a superior method of evaluating project because it uses cash flow for the entire project life. Further, it makes use of time value of money. However, it is complex to compute. A second approach, is the payback period (Holmes & Sugden 2008). The Group should invest in projects that promises an early return due to the swings in the market.
An advantage of this approach is that it offers an investor an opportunity to rank project (Troy 2009). However, the criterion does not make use of cash flow after the payback period (Tutor2u: Variance analysis 2012). Finally, the management can use the internal rate of return to evaluate the project (Vance 2003).
The method makes use of cash flow for the entire life of the project (Vandyck 2006). Further, it takes into account the time value of money (Watson & Head 2007). However, it is difficult to compute (Weiss 1998). Also, there is no definite way of computing the value of internal rate of return (Willekens & Numan 2010).
Valuation of Equity
Valuation of equity shows the value of a company based on the current assets and its position in the market (Zahra & George 2002). The valuation is of significance to potential shareholders and debt providers so as to know how the shares of the company performs in the market (Atrill 2009).
There are a number of models that can be used to value equity of the company, these are, price earnings ratio, dividend discount model, and dividend growth model. Valuation of equity will be carried out using a price earning ratio. It is a ratio of market value per share and earnings per share (Fahey 1999).
Using this valuation model, the value of equity is £328.8. Appendix one shows the share price of the company from July 2012. From the table, it is evident that the company’s shares has been trading at a price greater than the intrinsic value of the shares.
Financial Risk Management
Considering the fact that the company operates in two markets, it is exposed to currency and interest risks. If left unmanaged, the risks can impact greatly on the earnings of the company (Fraser 1990). The company does not trade in financial instruments.
From a review of the capital structure of the company, it is observable that the company has fixed and variable rate of debt. “The group policy requires borrowings to be held at amortized costs thus the carrying value of fixed debt is not affected by changes in the market.
There is no exposure to fair value interest rate risk”( Ashtead Group Plc. 2012e; Globusz Publishing 2012).
Upon review of the financial statements of the company, it is evident that the pretax profit of the company will change by about £5.4 million for a percentage change in the interest rate applicable to the variable rate of debt after tax effects, equity changes by £3.2 million. The interest rates are managed through interest rate swaps (Gibson 2010).
Currency exchange risk is restricted to risks arising from the translation. There are no risks arising transaction since the Group does not engage in any foreign transaction (Glen 2007). The Group reports in sterling pounds while most of the assets and liabilities are in US dollars.
The Group’s exposure to currency risk is quite limited because the most transactions are carried out in local currency (Helfert 2001).
Besides, the Group does not hedge on the translation of profits arising from the US market. Further, currency exchange risk on significant non trading transaction are treated in isolation (Have, Have, Stevens, Elst & Pol- Coyne 2003).
From the review, the group is significantly exposed to interest rate changes. However, the treasury department adequately manages the financial risks adequately.
Treasury
The treasury department is mandated to “monitor liquidity, currency, credit and financial risks” (Ashtead Group Plc. 2012e). Further, the department “manages and monitors the Group’s financial risks and internal and external funding requirements in support of the Groups corporate objectives” (Ashtead Group Plc. 2012e.)
The group does not trade in financial instruments. The financial aim of the company is to reduce leverage, increase cash flow, increase revenue and increase fleet size (Haber 2004).
In monitoring liquidity, currency, credit and financial risks, the Treasury department will ensure that the company has adequate liquidity (Heldman 2005). Further, they will aid the management to monitor the capital structure of the Group.
Reference List
ACCA 2012, Optimum capital. Web.
Arnold, G. 2008, Corporate financial management, Prentice Hall, Harlow.
Ashtead Group Plc. 2012a, About Ashtead. Web.
Ashtead Group Plc. 2012b, Ashtead at a glance. Web.
Ashtead Group Plc. 2012c, History. Web.
Ashtead Group Plc. 2012d, Investor relations. Web.
Ashtead Group Plc. 2012e, Annual report & account 2012. Web.
Ashtead Group Plc. 2012f, Annual report & account 2010. Web.
Ashtead Group Plc. 2012g, Annual report & account 2011. Web.
Ashtead Group Plc. 2012h, Annual report & account 2009. Web.
Ashtead Group Plc. 2012i, Annual report & account 2008. Web.
Ashtead Group Plc. 2012j, Annual report & account 2007. Web.
Ashtead Group Plc. 2012k, Annual report & account 2006. Web.
Atrill, P. 2009, Financial management for decision makers, Financial Times Prentice Hall, Harlow.
Berkshire Hathaway Company 2005, Hyperion delivers improved business forecasting for Ashtead Group plc. Web.
Bragg, S. 2006, Financial analysis: A controller’s guide, John Wiley & Sons, Inc., New Jersey.
Brealey, D. & Myers, T. 2009, Principles of corporate finance, McGraw Hill, New York.
Brigham, F. & Joel, F. 2009, Fundamentals of financial management, South-Western Cengage Learning, USA.
Bull, R. 2007, Financial ratios: How to use financial ratios to maximize value and success of your businesses, Elsevier, Amsterdam.
Campbell, D. 2005, Organizations and the business environment, Elsevier, Butterworth- Heinemann, Amsterdam.
Choi, F. 2003, International finance and accounting handbook, John Wiley & Sons, Inc., New Jersey.
Collier, P. 2009, Accounting for managers, John Wiley & Sons Ltd, London.
David, E. 2003, Financial analysis and decision making: Tools and techniques to solve, McGraw-Hill books, New York.
Dayananda, D., Irons, R., Harrison, S., Herbohn, J., & Rowland, P. 2002. Capital budgeting: Financial appraisal of investment projects, the Press Syndicate of the University of Cambridge, London.
Dubrin, A. 2008, Essentials of management, South-Western Cengage Learning, Alabama.
Erricos, J. & Cristian, G. 2007, Optimisation, econometric and financial analysis, Springer-Verlag, London.
Eugene, F. & Michael, C. 2009, Financial management theory and practice, South-Western Cengage Learning, USA.
Executive Hire News 2007, Tool hires top ten. Web.
Fahey, L. 1999, Competitors, John Wiley & Sons, New York.
Fraser, G. 1990, Decision accounting, Basil Blackwell Ltd, Oxford.
Gibson, C. 2010, Financial reporting and analysis: using financial accounting information, South-Western Cengage Learning, United States of America.
Glen, A. 2007, Corporate Financial Management, FT Prentice Hall, Harlow.
Globusz Publishing: Variance analysis 2012. Web.
Haber, R. 2004, Accounting dimistified, American Management Association, New York.
Have, S., Have, W., Stevens, F., Elst, M., & Pol- Coyne, F. 2003. Key management models, Financial Times/ Prentice Hall, New York.
Heldman, K. 2005, Project manager’s spotlight on risk management, Jossey-Bass, San Francisco.
Helfert, E. 2001, Financial analysis, tools and techniques: Assessment of business performance, McGraw-Hill books, New York.
Holmes, G. & Sugden, A. 2008, Interpreting company reports, Financial Times/Prentice Hall, Harlow.
Khan, M. & Jain, P. 2006, Management accounting, McGraw-Hill Companies Publishing Company, New Delhi.
Kinney, J., Skaife, A. & William, C. 2007, “The discovery and reporting of internal control deficiencies prior to S0X-mandated audits.” Journal of Accounting and Economics, Vol. 44.No.1 pp. 166-192.
Kymal, C. 2007, Conducting effective process-based audits: A handbook for ISO/TS 16949, Paton Professional, United States of America.
Longenecker, J., Petty, W., Palich, L., & Moore, C. 2009. Small business, Cengage Learning, New York.
Lys, T., Collins, D. & Badertscher, B. 2007, “Discretionary accounting choices and the predictive ability of accruals with respect to future cash flows.” Journal of Accounting and Economics, Vol. 53.No.1, pp. 330-353.
Maher, M., Stickney, C. & Weil, R. 2011, Managerial accounting: An introduction, Cangage, Alabama.
Mankiw, G. 2011, Principles of economics, Cengage Learning, Alabama.
Mankiw, G. 2012, Macroeconomics, Cengage Learning, Alabama.
Mark, C. 2002, The marketing glossary: Key terms, concepts and applications, Clemente Communications Group, New Jersey.
McDaniel, G. & Gitman, L. 2008, The future of business: the essentials, Cengage Learning, United States of America.
McGraw-Hill Higher Education 2007, Ethics in accounting. Web.
McLaney, E. & Atrill, P. 2008, Financial accounting for decision makers, Prentice Hall Europe, Harlow.
Melicher, R. & Leach, C. 2009, Entrepreneurial finance, Joe Sabatino, United States of America.
Michael, C. & Jon, W. 2010, Break even analysis: A definitive guide to cost-volume-profit- analysis, Business Expert Press, New York
Mintz, S. & Morris, M. 2011, Ethical obligations and decision making in accounting: Text and cases, McGraw-Hill, Boston.
Moorad, C., Joannas, D., Pereira, R., & Pienaar, R. 2003. Capital market instruments: Analysis and valuation, Pearson Education Limited, London.
New Age International Publishers 2012, International financial markets. Web.
Nicholson, S. 2000, Measuring community benefits, 2013. Web.
Nikolai, L., Bazley, J. & Jones, J. 2011, Intermediate accounting, Rob Dewey, United States of America.
Penton Business Media 2012a, Rental equipment register: Best business ever. Web.
Penton Business Media 2012b, RER 100 back in black. Web.
Power, T., Walsh, S. & O’ Meara, P. 2007, Financial management, Gill & Macmillan, New York.
Rachels, J. 2009, The elements of moral philosophy, McGraw-Hill, Boston.
Samuels, M., Wilkes, F. & Brayshaw, E. 2005, Financial management & decision making international, Thomson Publishing Company, Alabama.
Shapiro, A. 2005, Capital budgeting and investment analysis, Pearson Education India, New Delhi.
Shim, J. & Joel, S. 2008, Financial management, Barron’s Educational Series, Inc., New York.
Siddidui, A. 2005, Managerial economics and financial analysis, New Age International (P) Limited, New Delhi.
Sirman, D., Hitt, M. & Ireland, R. 2003, Dynamically managing firm resources for competitive advantage: Creating value for shareholders. Research Paper, Academy of Management Seattle.
Skinner, D. & Kim, I. 2010, “Measuring securities litigation risk.” Journal of Accounting and Economics, Vol. 53.No. 2, pp. 290-310.
Smith, T. & Smith, L. 2003, Business and accounting ethics. Web.
Steven, B. 2007, Financial analysis a controllers guide: Financial analysis, John Wiley & sons, New York.
The American Rental Association 2012a, Rental industry outlook — Accentuating the positive. Web.
The American Rental Association 2012b, Rental industry outlook — rental specific data at your fingertip. Web.
The Financial Times Limited 2011, The US shift to rental boosts Ashtead Business. Web.
Troy, L. 2009, Almanac of Business and Industrial Ratios 2009 Almanac of Business & Industrial Financial Ratios, CCH.
Tutor2u: Variance analysis 2012. Web.
Vance, D. 2003, Financial analysis and decision making: Tools and techniques to solve, McGraw-Hill books, United States.
Vandyck, C. 2006, Financial ratio analysis: a handy guidebook, Trafford Publishing, United states of America.
Watson, D. & Head, A. 2007, Corporate finance: Principles and practice, FT, Prentice Hall.
Weiss, L. 1998, How to understand financial analysis, Insead, Fointanebleau, France.
Willekens, M. & Numan, W. 2010, “An empirical test of spatial competition in the audit market.” Journal of Accounting and Economics, Vol. 53. No. 2, pp. 450-465.
Zahra, S. & George, G. 2002, International entrepreneurship: The current status of the Field and Future Research Agenda in Strategic Entrepreneurship creating a new mindset, Blackwell Publishing, Oxford.