During the world economic crisis between 2008 and 2010, the automotive industry was one of the worst affected and this is obvious in the low sales and massive layoffs that were characteristic to companies operating in the automobile markets (Lafontaine & Morton, 2010). Government intervention and different strategies applied by the players in the automobile market contributed to restoring the performance of the automotive industry (Mishkin, 2011). Nevertheless, the effects of the economic crisis make all industries unpredictable and make it necessary for business analysts to constantly perform forecasts and analysis on market performance. This paper is a forecast of the potential sales performance of AutoNation based on past trends from the last eleven years.
Trend
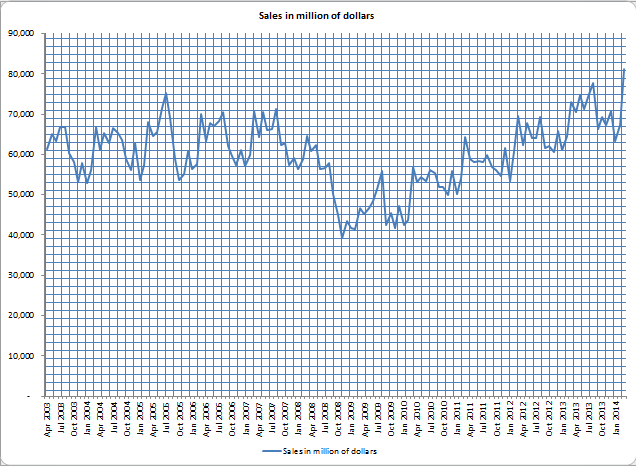
AutoNation is a major player in the automotive industry and currently has 2% of the market share. The trend in the automotive industry will be similar to that of AutoNation, which makes it possible to forecast the company’s performance in the next two years. Using the United States’ government’s monthly retail sales survey, the annual performance of the automotive industry was derived. Figure 1 below is a scatter plot that illustrates the sales performance of the automotive industry in the last eleven years. A generally horizontal trend line indicates that the automotive industry is remaining flat with some seasonal growths and deeps, which can be observed in the repeated peaks and valleys.

The economic recession from 2008 to 2010, the growth in automotive sales since 2010, and the seasonal buying behavior of consumers are some factors that have shaped the trend line.
Yearly Patterns

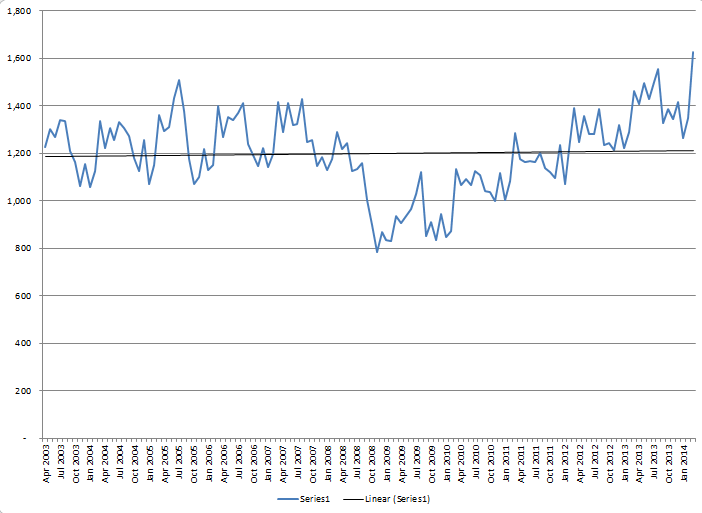
Figure 2 above is the trend line for AutoNation sales in the last eleven years and a slight upward pattern can be observed. The peaks and valleys are seasonal and are seen to repeat annually in the same months. Seasonal influences such as low car sales during the summer (from June to September), increase in consumer spending after-tax rebates (from February to March), and end of year sales (from October to December) all have yearly effects on the trend line. Annually, a negative deep can be observed during the summer period when consumers spend most on other products, and a positive deep can be observed during the Christmas holidays and after-tax rebates when consumers spend on luxury products.
Linear Forecast
The results of the linear forecasts are presented in the Excel sheet attached to this document. Using linear regression, the results show that there will be continuous growth in the average sales of AutoNation’s products for the next two years. These sales will follow the same peak and valley patterns that were seen in the previous figures.
Time on GDP Forecast
In the linear forecast, the ‘years’ and the ‘months’ were used as the dummy variables. The GDP recorded in the last eleven years can be used to predict the performance of the AutoNation since the GDP represents the total sales recorded in the country. The Excel document attached to this report provides details of the results achieved when the GDP was used to forecast the sales of AutoNation.
Conclusion
This report provided a two-year forecast for AutoNation using two different methods. The two methods used are valid and provide an idea of the potential performance of the company. However, it is recommended that the Linear Forecast method is used since it provides a lower forecast of the company’s performance.
References
Lafontaine, F. & Morton, F. S. (2010). Markets: State franchise laws, dealer terminations, and the auto crisis, Journal of Economic Perspectives, 24(3), pp. 233-50.
Mishkin, F. S. (2011). Over the cliff: From the subprime to the Global Financial Crisis, Journal of Economic Perspectives, 25(1), pp. 49-70.