Introduction
HSBC is a global company that provides banking and financial services in different parts of the world where it operates. The company s headquartered in London, in the United Kingdom but has about 7500 branches that are spread across 87 countries in different continents. It is regarded as the second largest banking and financial service provider in the world. It was founded in 1991 and has over the years recorded remarkable growth since its commencement.
Protective Life Corporation on the other hand provides financial services related to insurance and investment products. The company is headquartered in Alabama and has subsidiaries in all states in the United States. The company was founded in 1907 and for over 100 years it has been in operation, the company has grown to be recognized as one of the country’s leading life insurance provider.
The two companies have been in operation for a number of years and have been very successful in their operations. This report seeks to compare the recent balance sheet structures for the two companies and also account for how the differences in the structures reflect their financial intermediary roles. The report also investigates the profitability of the two companies, the metrics used to measure profitability, variation in the last five years and the reasons for these variations.
Comparison of the balance sheet structures for HSBC and Protective Life Corporation
The report will use the consolidated balance sheet for the year 2009. The two companies have different balance sheet components because they serve purposed of different nature. Since their balance sheets are composed of assets and liabilities, we shall analyze the differences in the balance sheet structures based on these components.
Balance sheet of HSCB
Like other commercial banks, the balance sheet of HSCB has two sides, the asset and liability sides. The balance sheet clearly indicates the system that the bank uses to raise funds and how different asset categories are financed or acquired by these funds. The bank also has other money that exist in form of shareholder’s capital and the deposits that the customers have deposited with the bank.
Asset Side
According to HSCB annual reports (2009), the asset side of the balance sheet has the following components:
- Cash and balances at central bank- the balance for these components are 31 December 2009 was $ 97, 268, 000. This figure represents 0.1% of the total assets. This figure is determined by the central bank. The central bank states the minimum cash balance that commercial banks should hold in their central bank accounts.
- Items in the course of collection from other banks. These are receivables in form of cash, securities or equities that HSCB expects to receive from other banks. Their figure was $5,588,000 in 2009 December 31st. This represents 0.0058% of the total assets the company had in 2009. This amount may differ from period to period depending on the amount expected to be received. These denote financial assets and liabilities at amortized costs that are held by the bank.
- Trading assets: These are debt securities and equity shares that a company holds for selling in future. Could be a portfolio of financial instruments which are managed together for short-term profit-taking. The figure of these assets by the end of 2009 was $450,546,000 which represents 0.467% of the total assets of the company. This figure depends on the debentures and equity shares that the bank holds in any given financial year. It may therefore differ from year to year.
- Derivatives: According Whaley (2006, pg. 3), a derivative is a contractual agreement to execute an exchange at some future date. He further states that, the term derivative arises from the fact that the agreement derives its value from the price of an underlying asset such as stock, bonds, currency and commodity. For the HSCB, the derivatives with positive fair value stood at $ 1,275,588,000 in by the end of financial year 2009. This represents 1.12% of the total assets heal by the company. According to HSCB annual report (2009), the asset derivatives “represent the cost of the Group of replacing all the transactions with a fair value in the Group’s favors in the assumption that the entire Group’s counterparties default at the same time and that the transaction is replaceable immediately”. The value of the derivatives depends on the price of the financial assets they are derived from.
- Loans and advances to banks and to customers and financial investments. There represent the loans that HSCB has advanced to other banks and to its customers. The total figures for 2009 are $20,399,181,000 and $ 29,370,509,000 respectively. Jointly they contribute about 51.6% of the total assets. Financial investments, whose 2009 figure ($43,886,319,000), represent 45.46% of the total assets. These three components represent the highest percentage of the bank’s assets. They are the main activities of banks. Banks make money by lending loans and placing their surplus in revenue generating projects.
- Property and equipments: for accounting purposes, property and equipments are reported in the balance sheet at their historical cost or fair value as required by IFRSs less any impairment or depreciation. For HSCB, the figure for property and equipment $172,596,000 which is 0.179% of the total assets for 2009. These are long-term assets that aid in the delivery of services by the bank. They could either be freehold or leasehold.
- Prepayments and accrued incomes: prepayments are basically bills that have been settled ahead of their payment dates. Accrued incomes are receivables which are due in the current financial period but no cash has been received for their settlements. The value for HSCB in 2009 for these figures is $329,362,000 which contributes 0.34% of the total assets.
The liability and equity side
The liability and equity side of the balance sheet include the following components.
- Deposit by banks and customer accounts. These usually have the largest percentage in the liability side. They relate to the principle activities of the bank. Customer accounts forms the highest percentage of the liabilities. Banks offer account services (current and savings accounts) to its customers. The money deposited in these accounts is liabilities to the bank. Their figure depends on the number of customers the bank has and the amount they retain in the account accounts. Deposits to the accounts held with HSCB by other banks are also liabilities. The figures are $2,767,527,000 and $84,872,508,000 respectively which contributes over 97% of the total liabilities.
- Other components: the other components of the equity and liability side of the balance sheet contribute about 3% of the total liabilities. They include: items in the course of transmission to other banks, derivatives with negative fair values, and debt securities in issue, current taxation, accruals and deferred income, provisions, retirement benefit liabilities deferred tax liabilities and other liabilities.
- Other liabilities include share-based payments obligations, obligations under finance eases and endorsements and acceptances.
Balance sheet of Proactive Life Corporation
The assets side
According to PRAKASH, the balance sheet of a life insurance company, other than the normal items, includes “the shareholder’s funds, the policy holder’s funds, investment related to policyholder’s funds, shareholder’s funds and assets held to cover linked liabilities” (PRAKASH, n. d, pg.4).
- Investments: According to Protective Life Corporation Annual reports (2009), the investment component of the balance sheet include components such as fixed maturities ($22,830,427,000) and Equity securities at fair market price ($275,497,000) which contribute 54.6% of the total assets of the company. Other components of investment include mortgage loans, investment in real assets, policy loans, other long-term investments and short-term liabilities. The total investment amounts to $29,056,838,000. This is about 68.87% of the total assets. This means that the life insurance company (Protective Corporation) holds most of its assets in placements/investments. These are long-term investments expected to generate revenues for a longer period of time.
- Other assets include cash held in liquid form, investment income accrued, accounts and premiums receivable (after deducting any allowances and uncollectable amounts), reinsurance receivables, and property and equipments net of depreciation. Others include income tax receivable, deferred income and variable annuity. These contribute only 31.13% of the total assets. This means most of the assets are held in long-term investments.
The equity and Liability side of the balance sheet.
The liability side of the balance sheet of a life insurance company is mostly dominated by policy liabilities and accruals. These include future policy benefits and claims and unearned premiums. For protective life corporation, the total for these figures is $18,548,267,000 which is 46.57% of the total figure for liabilities. Other components combined comprise 53.47% of the total liabilities. They include stable value product account balances, other policyholder’s funds, deferred income taxes, long-term debt variable annuity etc. This shows that most of the liabilities are policy liabilities and accruals.
Actual comparison of the bank (HSCB) and Life Insurance Company (protective)
Based on the information gathered above, there are some clear distinction of the functions carried out by the bank and those of a life insurance company. This is reflected by the assets and liabilities that each institution holds and are reported in the financial statements.
It is clear from the analysis that most of the assets of the bank are held in form of Loans and advances to banks and to customers and financial investments. Loan and advances occupy 51.6% of the total assets while the financial investments represent 45.46% of the total assets. These figures are high because they are the main source of revenue for banks. They are part of the core functions or principles of the bank. The banks give loans and other credit facilities to investors who repay the facilities with interest. This interest is the source of income for the banks.
For the life insurance company (protective life insurance corporation), the core function is to provide financial services related to insurance and investment products. Members pay premiums in return for insurance services. They may also invest in financial assets provided by the insurance company. Since most of these premiums are not demanded by the insured on regular basis but on occurrence of the risks, the company invests the money in long-term and short-term investments. Total investments accounted for 68.87% of the total assets.
On the side of liabilities, most of the bank’s liabilities are the deposits by customers and other banks. This is because banks provide services of keeping customers deposits. These deposits are mostly invested in loans and advances given to customers and other banks. Banks need to have cash in liquid form because customers may come for their deposits any time. The repayments of the loans advanced starts almost immediately the loans are disbursed to ensure that there is cash in the banks for customers to withdraw when they need it.
For the protective life insurance corporation, the liability side is dominated by policy liabilities and accruals. Policy liabilities include the premiums and unsettled claims. They constitute 53.47% of the total liabilities of the company as at 31st December 2009.
Profitability of HSCB and Protective Life Corporation between 2006 and 2010.
According to Vause (2009, pg 144), profit is defined as the surplus of income over expenditure. In financial accounting, where income exceeds expenditure, a profit is produced while a loss is produced where expenditure is greater than income. The ability or efficiency of a firm to generate earning or more income than expenditure is called profitability. The profitability of a firm is usually measured using profitability ratios. They are the metrics that financial analysts use to assess the profitability level of a company in a given financial period.
Profitability ratios
These ratios assess the company’s earnings with respect to a given level of sales, a certain level of assets, the owner’s investment, or share value. A firm’s profitability evaluation is crucial because in the long run, the firm has to operate profitably in order to survive. The long-term creditors, shareholders, suppliers, employees and their representative groups need these ratios in order to evaluate the firm’s profitability for their own interest. They are all interested in the financial soundness of an enterprise. Mostly used ratios in measuring profitability are gross profit margin, net profit margin, operating profit margin, return on investment/return on total assets, return on equity, and return on capital employed (ROCE).
HSCB and Protective Life Corporation profitability between 2006 and 2010:
For HSCB and protective life corporation, the net profit margin, gross profit margin, return on investment, return on equity and return on capital employed will be used to measure the profitability of the company for the five years. These ratios could be summarized by the table below:
Table indicating the ratios data for five years (HSCB):
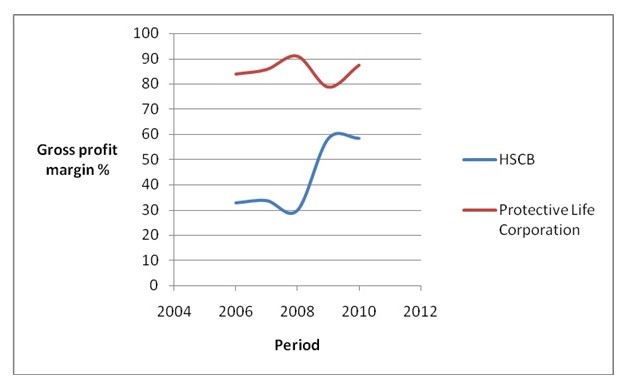
Gross profit margin: this ratio indicates the efficiency with which management of produces each unit of a product, that is, by controlling the cost of sales. The ratio is computed by expressing the gross profit as a percentage of sales.

For the HSCB, the margin does not seem consistent over the period between 2006 and 2010. However, it recorded tremendous increase between 2008 and 2009. According to Morningstar.com (2011), for protective life corporation, the GP margin is higher than for HSCB and is more consistent. It reached its highest level around 2008 and lowest level around 2009. This could be summarized in the graph below:
Net profit margin
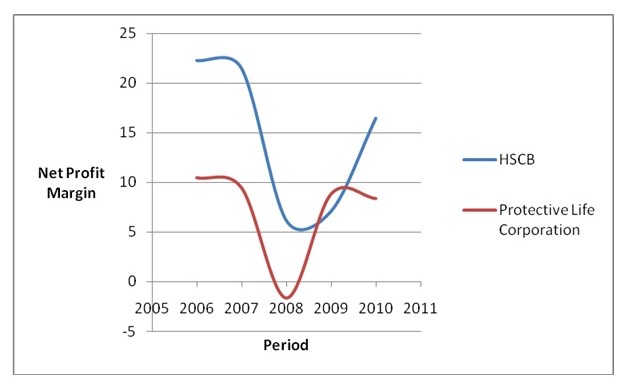
This indicates the ability of the firm to control financing expenses in particular interest’s expense. For HSCB, the net profit margin has shown a tremendous decrease between 2007 and 2008. This show the expenses were many during the period. For PLC, the ratio also decreased between 2007 and 2008 and reached the negative mark in 2008. However, the two ratios increased at a high rate through 2009. The ratio is calculated as follow:

The trend is reflected in the in the curve below:
Return on assets
This ratio indicates the return on profit from investment of one shilling in total assets.

According to Morningstar.com (2011), the return on assets for the two companies decreased steadily from 2006 to 2008 where for PLC became negative in 2008. However, the ratios started increasing beyond 2008.
The trend for HSCB and PLC are reflected by the curves below:
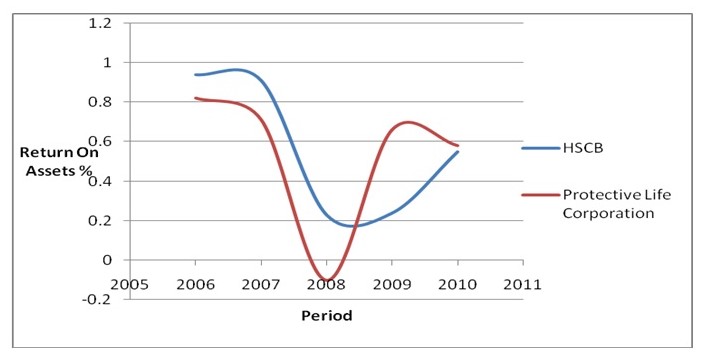
the trend declined steadly up to the period between 2008 and 2009 beyond which it increased steadly.
Return on equity
This ratio indicates the return of profitability on one shilling of equity capital contributed by shareholders.

The trend for HSCB and PLC are summarized in the graphs below:
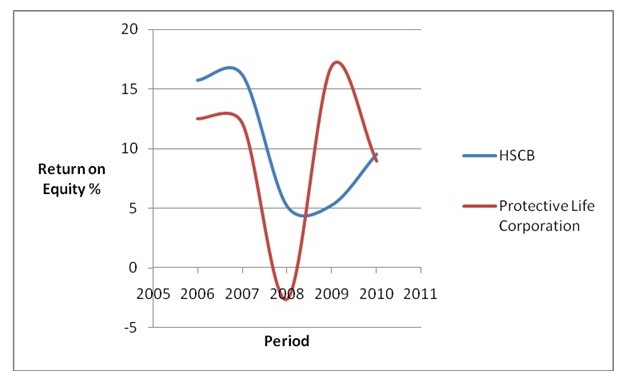
The return on equity for HSCB and PLC declined steadly between 2006 and 2008 beyond which they increases at a high.
Return on capital employed
According to Scarlett (2008), the overall performance of a business operation depends on the operating profit that it is generating relative to the value of the capital engaged in achieving that profit. Return on Capital Employed is the simplest measure of this. Capital employed is the book value of the net asset employed by the business.

The trend for HSCB and PLC are shown in the graphs below:
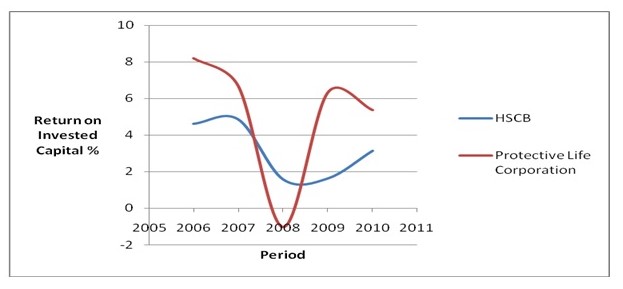
The two curves shows a decline bewteen 2006 and 2008 but they both started rising beyond 2009.
Reasons for the behaviors of the ratios/ curves
From the data analyzed and presented using the curves, the two companies seem to have suffered a challenge that contributed to poor growth between 2006 and 2008. It seems that the economic crisis that took place between 2006 and spilled over to 2008 affected the company. The economies in different counties started recovering in 2009 onwards. This is shown by the performance of the companies after 2008 and beyond. The global recession of 2007 to 2008 mostly affected the financial institutions like banks and insurance companies. HSCB and Protective Life Corporation were not exceptional. Their performances seem to have increased with the end of the global economic crisis in 2009 and beyond.
Conclusion
The balance sheet of an enterprise depends on the kind of the enterprise. The components of balance sheet and their proportion depend on the kind of activities the business does. The performance of the company could best be measured using the financial ratios. They help evaluate the performance of the company at different financial periods.
References
HSCB Annual Reports., 2009. Web.
Morningstar.com. 2011. HSBC Holdings PLC. Web.
Morningstar.com., 2011. Protective Life Corp. Web.
PRAKASH V., n. d. Accounting: Accounting of Life Insurance Companies. Web.
Protective Life Corporation Annual reports., 2009. Web.
Scarlett, R., 2008. CIMA Official Learning System Management Accounting – Performance Evaluation. US: Elsevier
Vause, B., 2009. Guide to analyzing companies. New York: John Wiley and Sons.
Whaley, R. E., 2006. Derivatives: markets, valuation, and risk management. New York: John Wiley and Sons.