Introduction
The following essay analyses the beer industry in the United States. It looks into the beer industry and developing growth mechanisms in the light of globalization, integrated technology and strict industry regulations. The analysis examines the political environmental, social, technological, economic and legal factors that affect the beer industry in the United States.
The Political/Legal Factors
Even after beer manufacturing was made legal by the federal government, the state government perpetuated prohibition by limiting the drinking hours and distribution systems of beer to make the Americans accept beer as good drink. The political environment includes taxation procedures that are in the country.
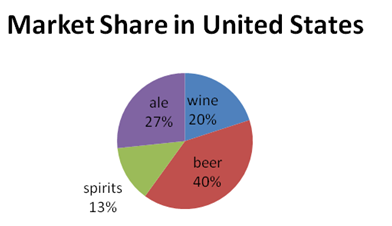
Currently, the tax is 40% of the retail prices, which is a higher rate of taxation as compared with taxation in other countries, such as Germany (Lundström 2005).
The imported beer sales volume is a part of the locally produced beer in the United States (Figure 1). Regulation of the beer industry has also affected its profit margins due to regulation on advertising, as it is perceived to be deceptive to public on the advantages of drinking beer (Strokes 2010).
The Economic Factors
The United States of America is the world’s largest economy. It boasts of having the world’s highest gross domestic product as well as the highest per capita income of $48,000. The country has a population of approximately 300,000 million people. It is the largest exporter of electronics and technological goods, such as computers as well as organic waste (The World Bank 2010).
The first economic aspect that has affected the beer industry is the global recession, which has reduced the volume of beer consumption in the country.
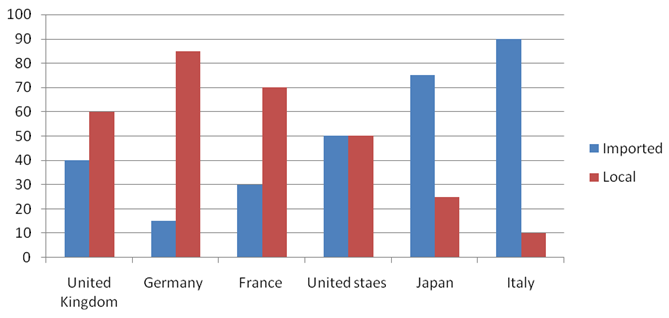
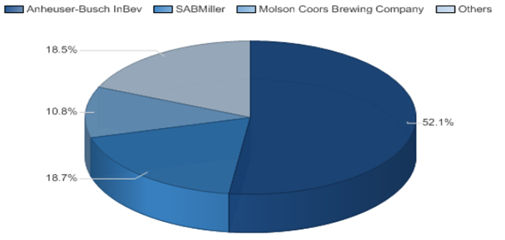
The other economic factor relates to the increased competition across the globe due to the merger and acquisition of the beer companies resulting in concentration of beer industries (Figure 2). For instance, one of the major manufacturers of beer, Anheuser-Busch InBev, has acquired more than forty establishments of beer distribution in the United States (Espey 1989).
Social Cultural Factors
Americans have a high sense of style and self-importance and everything that helps them perpetuate this image has a wide acceptance (Strokes 2010). This explains how Heinemann has succeeded to sell its classic drinks in the United States.
In a survey conducted by the Institute of beer manufacturers, it is shown that sixty percent of those who drink beer are between eighteen and forty-five years of age (Table 1). It also indicates that beer drinking exists in all social economic classes although it is low among people with $50,000 per capita income (Espey 1989).
Table 1. Estimated Number of Beer Establishments
To understand the culture better, the existing literature, especially fictional works, indicates instances where the characters are in a binge and the types of beer that they drink (Swedberg 2009). The social-cultural environment in the United States of America shows prevalence of drinking beer in the country. It also provides information on how beer marketers can capitalise on this market (Andriani et al. 2004).
Technological Factors
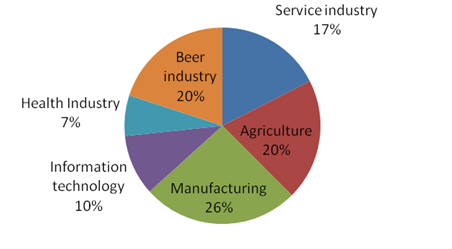
Technology has affected the beer industry in the United States in a number of ways. The first way involves the methods of beer production. With increased technology, especially, with the development of enterprise resource planning systems, beer industries have increased (Figure 3).
The companies have reduced their costs of operations and managed to reduce the selling price. The use of Enterprise Resource Planning has enabled the companies to reduce administrative costs, such as payroll processing to pay the workers, suppliers and inventory management (Schultz 2000).
Technology is also useful in fermenting, processing and eventual production of beer, and this has significantly reduced costs of production. Technology has also been useful in marketing the beer products all over the globe through the traditional media, such as television as well as social networks. The ability to integrate technology in marketing and production activities gives the companies advantage over their competitors (Pratesi 1994).
The Environmental and Ecological Factors
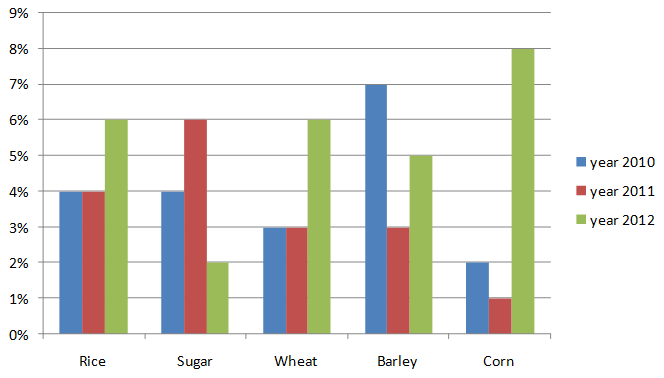
Beer is made from fermented food materials such as rice, corn and barley. With the increased global climatic changes, the demand for food has increased and led to growth in the prices of these commodities. This has made the production costs of beer to be high (Table 2).
Table 2. Estimated Number of Employees
The environment advocacy groups advocate for companies to be energy and environment-conscious. Most of the companies have also engaged or used their resources in environment conservation efforts (Beverage World 2000).
Another environmental factor relates to the increase in lifestyle-related diseases in the United States of America where many people suffer from obesity, diabetes, blood pressure and kidney ailments.
These have made people more conscious and reserved from enjoying alcoholic beverages due to their contribution to these diseases. This has affected the companies negatively as it has reduced the overall number of beer consumers in the country (Lundström 2005).
The Buyer Power
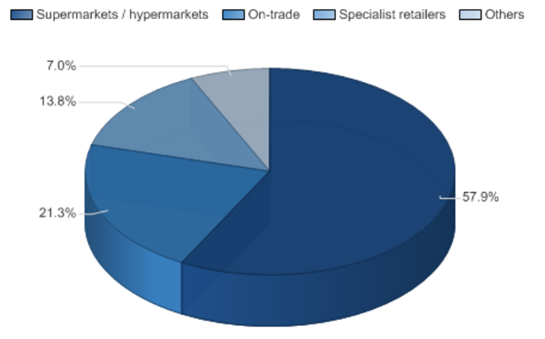
The buyer power of the beer consumers in the United States of America is moderate. This is because, on the one hand, the major beer buyers are hypermarkets and supermarket retailers. This buyer negotiates the beer prices with the manufacturer. The transfer costs of this buyer are not very high, which gives them undue advantage (Schultz, 2000).
However, the beer manufacturers have differentiated their products in terms of the ingredients of the beer products that offer the buyer many options of beer brands.
This minimizes the buyer power, as the buyers who are supermarkets have to stock different brands of beer for their consumers. The other factor of buyer power is that of an expected market decline which has ensured a reduction in the number of consumers as shown in Figure 4.
Supplier Power
The suppliers play a significant role in the beer industry, and their influence cannot be underscored. The major suppliers who wield power in the beer industry are those who supply the beer inputs such as barley, rice and corn. The beer industry moderates this power by butting the beer supplies rather from independent farmers than from cooperatives. This makes it easier for them to dictate the quality and price of the product.
To reduce the power of suppliers, some of the beer companies decided to have their own ad hoc farms, which supply their own inputs (Figure 5). This weakens the suppliers. However, the suppliers do have an added advantage in that they can choose not to sell their supplies to the beer manufacturer and instead use the barley, corn for animal supplies.
This utility advantage gives the supplier a moderate influence on the beer industry where the farmers can improve their process of production if needed. The suppliers can also sell their supplies to the wines and spirit manufacturers (Figure 6)
New Entrants
Other than the government’s stringent regulations on new entrants in the beer industry, the capital required to enter into the beer market poses a major challenge to the new entrants. However, new entrants in the beer industry come in as microbreweries where they fill a certain niche in the market. The main beer manufacturers focus on the major brands where they focus on major brands which have higher prices (Figure 5).
The new entrants can concentrate on providing low-processed beers. The new entrants are, however, at a disadvantage as many of the beer manufacturers focus on the economies of scale that produce large volumes of beer at lower costs, which has increased their profit margins (Table 3).
Table 3
The new entrants in the beer market will also have to face the competition in the production of the beer, as they have to take more time before they establish a good network with independent suppliers, and retailers in the market. The new entrants’ influence on beer market in the United States of America is minimal and has little effect on the major players in the industry (Beverage World 2000).
Threat of Substitutes
The substitutes in the beer market play also a significant role as one of Porter’s market forces. The substitutes that pose threat to beer are mainly spirits and wines and non-alcoholic or low alcoholic drinks. With concerns on the impact of alcohol on consumer’s health, a percentage of consumers now prefer non-alcoholic drinks.
The retailers have also noticed this trend and stock non-alcoholic or low-alcoholic beverages together with the beer (Beverage World 2000). However, the beer manufacturers retain some advantages in that most of the substitute products are new entrants that cannot match the capital intensity of the beer industry.
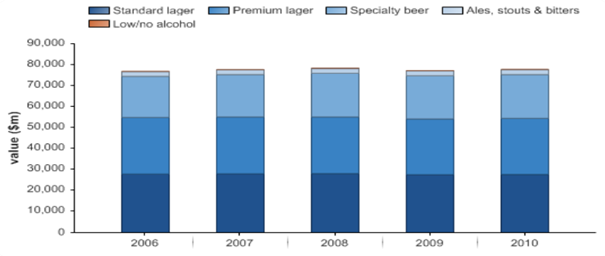
Some of the non alcoholic products take longer shelf space and time, which makes beer a preferred product to stock by the sellers in comparison with other beverages. For instance, it is expensive to stock beer products as compared to wines and spirits (Table 4).
Table 4. United States beer market category segmentation: % share, by value, 2006–2010
Degree of Rivalry
The rivalry in the beer industry in the United States is relatively higher as compared to other market forces. The beer industry in the United States has high concentration although three major industry players, namely, the Anheuser-Busch inBev, SAB Miller and Molson Coors, occupy a large market signet.
The extent of this rivalry is seen through the number of beer brands that each manufacturer has in the market, which gives the consumers a wide variety of beer brands to choose. Rivalry is also evident through the advertising that each company spends to promote its brands, with each of the there major players spending over $1 billion in advertising annually (Figure 7).
Conclusion
In the next five years, the beer industry is expected to be in a boom mainly due to the expected economic recovery, which will increase consumers’ expenditure. The sales volume is expected to soar by over ten percent by the year 2017. The concentration of the beer brands in the industry will continue to exist in five years, and no major new entrant is expected.
The other notable phenomenon is that the taxation for beer products is expected to remain high in the forthcoming years. The prices will also increase due to the increase of supplier power and industry rivalry. The overall sales volume of beer in the country grew by 4% in the year 2012 (Table 5). Similar growth is expected in the year 2013, and even more increase is expected in future (Barnes Reports 2012).
Table 5. Five-year trend of sales
References
Andriani, L, Gold, F, Rotella, M, & Scharf, M. 2004, ‘Travels with barley: a journey through beer culture in America’, Emily Publishers Weekly, vol. 8, pp.42.
Barnes Reports 2012, U.S. Beer and ale wholesale industry. Web.
Beverage World 2000, ‘Brew u? Labatt USA opens beer academy’, Beverage World News, 15 May, pp.16.
Espey, J 1989, ‘The big four: an examination of the international drinks industry’, International Journal of Wine Marketing, vol. 1, no. 2, pp.47-64.
Lundström, A. 2005, Beer production policy: theory and practice, Springer, New York.
Pratesi, C 1994, ’Miller beer,’ Management Decision, vol. 32, pp.25-28.
Schultz, M 2000, The expressive organisation: linking identity, reputation and the corporate brand, Oxford University Press, New York.
Strokes, R 2010, E-marketing: the essential guide to online marketing, McGraw Hill, New York.
Swedberg R 2009, Beer: the social science view, Oxford University Press, Oxford.
The World Bank 2010, Doing business 2011: making a difference in the beer industry, International Finance Corporation, Washington, D.C.