Investment Patterns
Belgium was ranked the 36th out of 189 countries globally in the 2014 Doing Business Report by the World Bank. This country has been steadily declining in the index since 2007 when it ranked the 16th. This implies that the conditions for setting up and running a business in it have been worsening (The World Bank). Belgium’s financial sector was majorly affected by the 2008 global financial crisis with the country’s largest banks requiring government intervention (Eurostats).
The government stepped in by selling off banks, nationalizing banks, bail outs, providing bank guarantees, and deposit insurance. No bank collapsed but these measures have led to cross exposures between the financial sector and the government. This macro-economic instability has affected the economic performance ultimately. With the country in 2012 experiencing the negative GDP growth, there is a possibility that the country may be headed into a recessionary period (The International Monetary Fund).
Over the years the high quality transport system, purchasing power of residents, and skilled labor have made Belgium a very attractive country for investors. It could present high levels of Foreign Direct Investment (FDI) relative to its physical size and economic size. The Central Government attracted investors to the country through incentives like low corporate taxes. The various regions also have their own incentives in place develop the investments field. According to Eurostats, a third of the 3,000 largest corporations in Belgium are foreign.
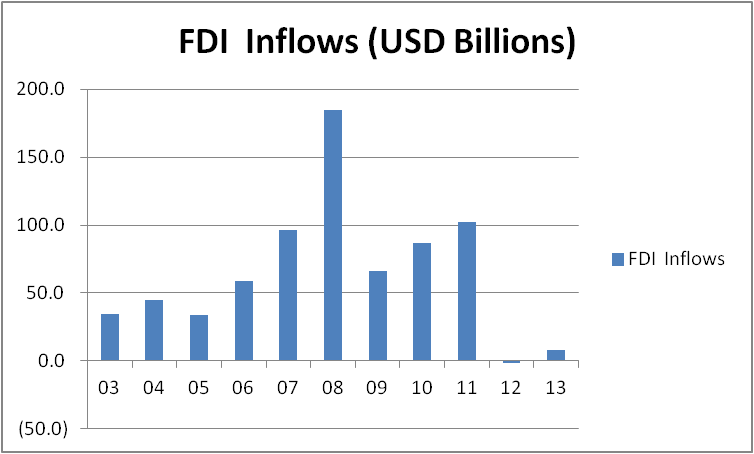
In 2012, there was a massive drop in the FDI inflows, from an all-time high of 102$ billion in 2011 to -1.9$ billion in 2012. The negative FDI inflows are caused by disinvestment that has been driven by Belgium’s loss of competitiveness. The loss of productivity in regard to its neighbors, higher labor costs and inflation have led to a reduction in foreign and local investors (International Monetary Fund). As seen below, this loss of confidence has resulted into a slump in the GDP with 2012 recording negative GDP growth. The GDP growth in 2013 is forecasted to remain flat and achieve 1.1% growth in 2014 (Eurostats).

Source: World Bank Data Bank
Government Expenditure
The Government Expenditure refers to the money spent by central governments to provide services to the residents. Depending on the structure of the government the money may also be distributed to federal and local governments and spent at the grassroots. The Government spending excludes transfers like unemployment benefits and social security (International Monetary Fund). In Belgium, expenditure by the central government and the regional governments is separate. In 2012, central government expenditure was 23% of the total government expenditure.
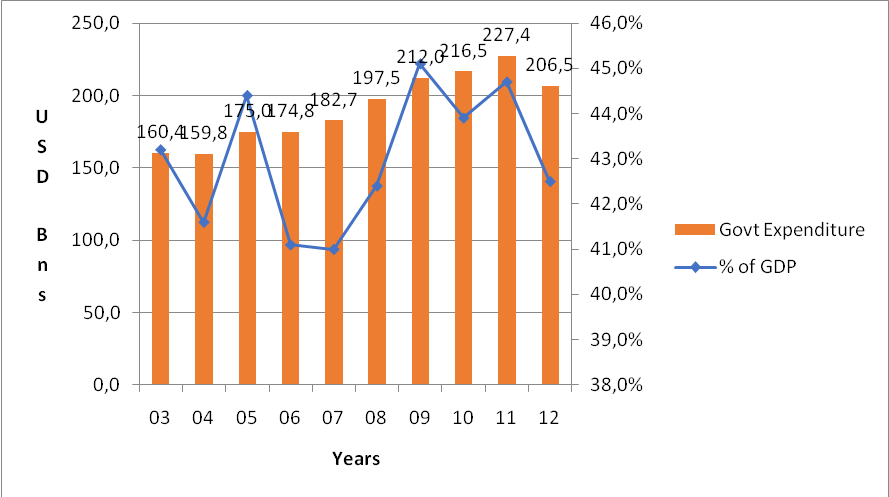
The graph below shows the total government expenditure in Belgium between 2003 and 2013. The comparison between government expenditure and GDP over the 10 years reflects that in the years when the economy was doing well the government would increase its expenditure. The negative GDP growth in 2012 sees the government reduce its spending. The expenditure as a percentage of the GDP is maintained at a range of between 41% and 44%.

However, there is need to improve tax collection or curb public expenditure as Belgium’s government expenditure outstrips its revenue. During the period of the study, the only year Belgium did not have a deficit was 2006. The European Union has been urging the government to cut its spending. In March 2013, the government agreed to sell assets valued at one billion Euros in a bid to reduce the deficit. There are also proposals to raise some taxes and duties, and increase some legal charges as well. This will be coupled with the reduced spending on services such as health care, social-security, transport, and defense (Index Mundi).
Net Exports
Net exports refer to the difference between the monetary value of goods exported out of the country and the goods imported into the country. This is also known as the balance of payments. When the exports exceed the imports, the country has a surplus; and when the imports are higher, it has a deficit. Belgium is mainly an exporter but most of its exports are intermediate goods (Eurostats).
Due to the fact that the country imports and exports large volumes of goods, its net exports are highly susceptible to changes in the global markets. The industries in the North import raw materials for the production of exports such as processed foods, glass, scientific instruments, and basic metals. Belgium’s major trade partners are Netherlands, Germany, the USA, China, Ireland, and the UK (Index Mundi).
Since 2008 Financial Crisis, the country has posted a deficit in the balance of payments a number of times. The 2013 figure is an estimate of the first two-quarters of the year according to Eurostats.
Sources: OECD Statistics and Eurostats
Disinvesting by major industries due to the global economic slow-down is one of the reasons Belgium is experiencing deficits in the net exports. In the last two years, two major car manufacturers have closed their plants in the country. The shutdown of Opel and Renault plants has lowered Belgium’s export earnings. However, the plastics and resins industries should improve Belgium’s exports once the construction and automobile sectors pick up in other parts of Europe (International Monetary Fund). With the economies of its major export partners recovering and Belgium being an export-driven economy, net exports are expected to improve in 2013. External demand is expected to lift the economy out of its current slump.
Works Cited
Eurostats. European Commission Eurostats. European Commission, 2013. Web.
Index Mundi. Belgium Economy Profile 2013. Index Mundi, 2013. Web.
International Monetary Fund. IMF Data and Statistics. International Monetary Fund, 2013. Web.
OECD. OECD Statistics. Organization for Economic Co-operation and Development, 2013. Web.
The World Bank. Data – The World Bank. The World Bank, 2013. Web.