Selecting a Company
Boeing Co. is listed on the New York Stock Exchange (NYSE). The company has a market capitalization of $95.36 billion, and an average volume of 5.22 million stocks (“Boeing Co. NYSE: BA” table). It paid shareholders dividends at a rate of $0.73 per share at the end of 2013. The major competitor is Airbus Group. It has a market capitalization of $56.39 billion (“Airbus Group N.V. ADS” table). Airbus has earnings per share of $0.62 compared with $6.03 for Boeing.
Economic Analysis
The U.S. economy is moving upwards with key economic indicators showing improvement. The real GDP improved by 3.2% above the values that were recorded at the end of 2012. The seasonally adjusted GDP stood at $17,102.5 billion for the fourth quarter in 2013. Civil unemployment declined by 6.6% (FRED table). A higher real GDP and lower unemployment show that consumption is likely to increase. A higher GDP will result in higher aggregate demand, which will affect most industries positively. Real GDP and employment affect the operations of the company through its stock, and demand for products. Companies demand more goods and services when the economy improves. Optimism increases the stock prices by creating a higher demand in the stock exchange. People purchase more goods when they expect economic conditions to remain favorable. People save for precautionary purposes when they expect difficult economic conditions.
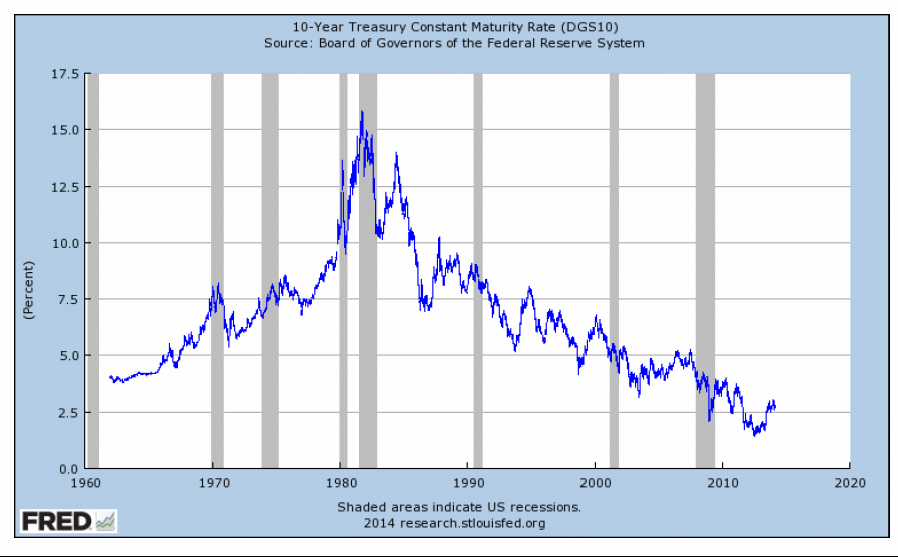
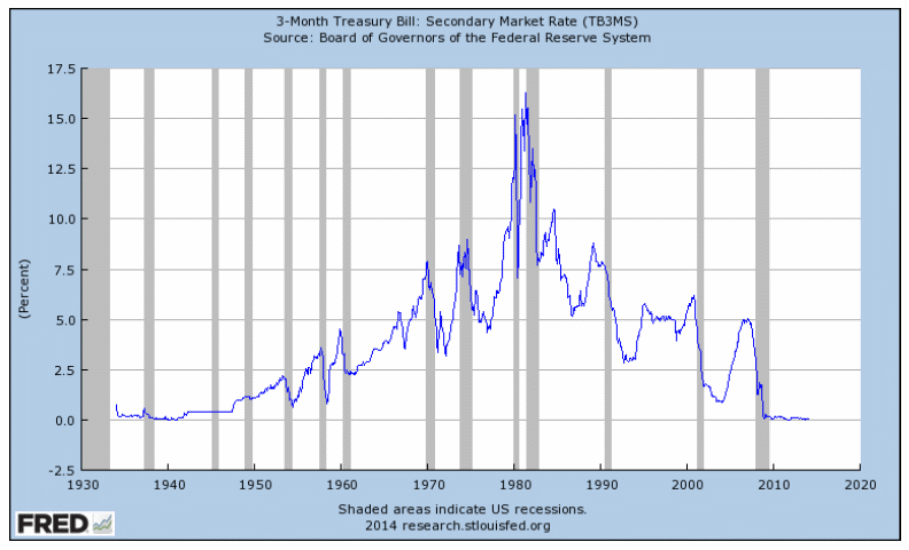
Higher interest rates indicate the cost of raising capital for expansion has increased. The long-term interest rates are higher in 2013 than they were in 2011 and 2012. The graph of the 10-Year Treasury bills shows that the long-term interest rates have increased (Figure 1). The 10-Year Treasury bill has a constant maturity rate of 2.76 (FRED table). The increase in interest rates for the long-term Treasury bills is an indication that other investment options are providing a higher rate. It is also an indication of increased demand for finances which is a sign of more opportunities. The 3-Month Treasury bill has a rate of 0.04%.

The 3-Month Treasury bill rate has remained fairly constant since 2010 (Figure 2). The low-interest rates are a result of the monetary policy seeking to create a favorable business environment. Boeing and Airbus are in an industry that relies on debt. Low rates on short-term loans mean the companies can obtain overdrafts for their cash account at a lower rate. The companies can also service their long-term debt at a lower cost compared with historical rates.

A higher inflation rate reduces aggregate demand. A low inflation rate indicates that the purchasing power of the national income has been maintained. The CPI is a measure of inflation. The consumer price index (CPI) for all urban consumers averaged 233.109 in 2013 (FRED table). In the first month of 2014, it stood at 234.933. The 1982-84 prices have been used as the base year. There is a difference of 1.824. It shows an increase of about 1.8% between the two years. The producer price index for all commodities has changed with a small margin. It was 203.4% in 2013 (average), and 203.5% in 2014 (first month) (FRED table). It shows a difference of 0.1%. It indicates that the cost of production does not change rapidly. It is good news for manufacturing companies such as Boeing, and Airbus. A low inflation rate means demand for products will either increase or remain the same.
A high consumption level creates investor confidence because they indicate companies will be able to generate high revenues. Personal consumption expenditures were 105.926% in 2013 (average) when 2009 is the base year at 100%. It was 106.47% in 2014 (first month) which shows that there is an improvement (FRED table). Increased consumption is favorable for manufacturing companies because it increases the chance of converting revenues into profits. The price level of government consumption was 1.69403 in 2011 when 2005 is considered the base year at 1.0 (FRED table). It shows that consumption has reached levels higher than the pre-financial crisis. Government consumption is important because the U.S. government is one of the major consumers of aerospace products.
Considering the measures discussed above, the U.S. economy is favorable for the aerospace industry. There is increased aggregate demand for products based on a higher real GDP, low inflation rate, and low-interest rates.
Industry Analysis
Nature of industry
The industry relies on a global market for engines and planes. Outsourcing has become a common feature because of competitive pricing. Companies seek to manufacture different parts in different countries and assemble them in one country. For example, General Electric has been manufacturing engines for Boeing airplanes since 1996 (Thurber par. 2). The industry can be analyzed using Porter’s five forces. There are very many competitors which show that there is an intense rivalry. Entry is barred by accumulated knowledge and the size of capital. Most of the companies have operated for several decades. They have accumulated knowledge and expertise. Some of the examples include Bombardier Aerospace (since 1942), Cessna (since 1927), Dassault (entered U.S. market in 1963), and Hawker Beechcraft (since 1937) (Thurber par. 5).
All these companies rely on accumulated knowledge. The cost of the planes is high. For example, Airbus’ A319 initial price was $35 million (Thurber par. 1). As a result of the high prices, the customers would be few and large. However, the global market opens up an opportunity for many customers. They include airlines, governments, and rich individuals across the globe. The high number of countries and airlines shows that there are many customers. It reduces their bargaining power. There are few substitutes for airplanes such as high-speed trains. There are many suppliers as mentioned in the outsourcing of parts. Suppliers have low bargaining power because of their high number. The five areas are the summary of the industry under Porter’s five forces.
The U.S. aerospace industry generated $86 billion in export as revenues in 2011 (Select USA par. 2). Exports in the aerospace industry exceeded imports by $47.1 billion. The sale of commercial planes is projected to grow at a rate of 3.5% annually for the next 20 years (Select USA par. 3). There is potential for growth and investment in the industry.
Major competitors
Boeing has developed a reputation for making large-cabin planes. Boeing partnered with General electric in 1996 to develop a new generation 737 known as BBJ. BBJ2 and BBJ3 (2005) followed the same trend of large size business jets. Boeing large-sized jets include the 737, 747-8, and the 787 (Thurber par. 2).
Airbus entered the business jet segment in 1997 with its versions known as the Airbus Corporate Jet (ACJ). It has been able to capture a large market by receiving boosts from customers in the Middle East, and Asia Pacific (Thurber par. 1).
Embraer has been recognized as the fourth largest commercial airplane maker. It mainly relies on small-cabin and mid-sized jets to maintain its market share (Thurber par. 6).
Cessna Aircraft has dominated the industry over the years. Thurber (2011) explains that of the 16,000 business jets used across the globe, a third of them have been produced by Cessna. Cessna produced the Mustang. It was considered the fastest business jet in 2011 (Thurber par. 7). It mainly focuses on light jets and their speed.
Importance of technological developments
Important technological developments include fuel-efficient engines such as the pusher-turboprop Piaggio Avanti in the 1970s. There is a need for lower-cost aircraft. There are customers who are looking for jets that provide the highest speed such as G650 by Gulfstream Aerospace. It goes at a maximum speed of Mach 0.925 (Thurber par. 8). Customers are also looking for the size of the cabin such as commercial planes developed by Airbus, and Boeing. There are planes designed to go for a long-distance without refueling such as the G650 by Gulfstream. It can fly 7,000 nautical miles without the need to refuel (Thurber par. 6). There is a demand for comfort, and automated aerodynamics. Companies capture their market share based on these developments.
Economic forces with the most impact
The industry relies on a global market. It is reliant on the global economy as a result of the global market. The global economy relies on the EU economies, the U.S., and other advanced economies. The industry relies on the level of consumption. The level of consumption is boosted by a higher real GDP, and lower unemployment. When people have high expectations of employment, they reduce their precautionary balances by engaging in more consumption. A higher GDP creates investor confidence. Investment by firms results in more consumption. Companies are the main customers in the industry. The industry relies on exports as indicated in the nature of the industry. It means global levels of consumption are important.
Company Analysis
Liquidity ratios
Current ratio = current assets/ current liabilities
Boeing ($)
2013 = 65.07B/ 51.49B = 1.26 times
2012 = 57.31B/ 44.98B = 1.27 times
Airbus (Euros)
2013 = 47, 098M/ 48,581M = 0.97 times
Quick ratio = (current assets – inventory) / current liabilities
Boeing ($)
2013 = (65.07B – 42.91B) / 51.49B = 0.43 times
2012 = (57.31B – 37.75B) / 44.98B = 0.43 times
Airbus (Euros)
2013 = (47,098M – 25,060M) / 48,581M = 0.45 times
The current ratio shows that Boeing has a higher ability to clear its current debts than Airbus. The Airbus quick ratio is higher than the Boeing’s quick ratio. It indicates that Boeing holds a larger inventory than the competitor. The firm has maintained its current ratio and quick ratio over the two years.
Cash ratio = cash/ current liabilities
Boeing ($)
2013 = 9.09B/ 51.49B = 0.18 times
2012 = 10.34B/ 44.98B = 0.23 times
Airbus (Euros)
2013 = 7,765M / 48,581M = 0.16 times
Sources: “Boeing Co. NYSE: BA” (table) and “Airbus Group N.V. ADS” (table).
Boeing improved efficiency in holding cash in 2013 by reducing the amount it holds to match its major competitor. There is an opportunity cost of keeping cash that is not needed. Airbus appears to have more efficient cash holdings.
Financial leverage ratios
Total debt ratio = (total assets – total equity) / total assets
Boeing ($)
2013 = (92.66B – 15.0B) / 92.66B = 83.8%
2012 = (88.9B – 5.97B) / 88.9B = 93.3%
Airbus (Euros)
2013 = (93,311M – 11,054M) / 93,311M = 88.2%
Debt/ Equity ratio = total debt/ total equity
Boeing ($)
2013 = 77.67B/ 15.0B = 517.8%
2012 = 82.93B/ 5.97B = 1389.1%
Airbus (Euros)
2013 = 82,257M / 11,054M = 744.1%
Equity multiplier = total assets/ total equity = 1 + debt/ equity
Boeing ($)
2013 = 92.66B/ 15B = 6.18 (using the second formula = 1 + 5.17 = 6.17)
2012 = 88.9B/ 5.97B = 14.89
Airbus (Euros)
2013 = 93,311M / 11,054M = 8.44
Sources: “Boeing Co. NYSE: BA” (table) and “Airbus Group N.V. ADS” (table).
Both firms use leverage to a very large extent. The debt levels in both companies exceed equity several times. Boeing reduced the total debt ratio and debt-equity ratio in 2013. Reduction in the proportion of debts is good for investors because it reduces risk. Both companies are risky to investors because of the high debt ratios. There is reduced profitability as a result of servicing debts. There is a reduced ability to retain equity in case of bankruptcy.
Profitability ratios
Profit margin = net income/ sales
Boeing ($)
2013 = 4.58B/ 86.62B = 5.3%
2012 = 3.9B/ 81.7B = 4.8%
Airbus (Euros)
2013 = 1,475M / 59,256M = 2.5%
The two companies have low profitability because of the high cost of goods sold (COGS). It can be seen in the small difference between COGS excluding depreciation and amortization (71.35B) and sales (86.62B) for Boeing in 2013. Depreciation and amortization are about 3.5B in 2013. It shows that COGS is the main cause of the low-profit margin. The situation is similar to that of Airbus.
Return on assets (ROA) = net income/ total assets
Boeing ($)
2013 = 4.58B/ 92.66B = 4.9%
2012 = 3.9B/ 88.9B = 4.4%
Airbus (Euros)
2013 = 1,475M / 93,311M = 1.6%
Return on equity (ROE) = net income/ total equity
Boeing ($)
2013 = 4.58B/15B = 30.5%
2012 = 3.9B/ 5.97B = 65.3%
Airbus (Euros)
2013 = 1,475M / 11,054M = 13.34%
EBITDA Margin = EBITDA / Sales
Boeing ($)
2013 = 8.25B/ 86.62B = 9.5%
2012 =7.94B/ 81.7B = 9.7%
Airbus (Euros)
2013 = 2,607M / 59,256M = 4.4%
Sources: “Boeing Co. NYSE: BA” (table), and “Airbus Group N.V. ADS” (table).
The profitability ratios are used to show the efficiency of the firm in generating income from assets and equity. Boeing is more profitable than Airbus. Boeing uses assets more efficiently than Airbus. Boeing’s use of assets improved in 2013.
Measures of efficiency
Accounts receivable turnover = net sales/ net accounts receivable
Boeing
2013 = 86.62B / 6.62B = 13.08 times
2012 = 81.7B / 5.76B = 14.18 times
Airbus
2013 = 59,256M / 7,239M = 8.19 times
Accounts receivable turnover indicates that Boeing has shorter times to wait for receivables than Airbus, considering its higher frequency. Boeing’s efficiency in managing receivables reduced slightly in 2013.
Inventory turnover = cost of goods sold/ inventory
Boeing
2013 = 73.19B / 42.91B = 1.71 times
2012 = 68.56B / 37.75B = 1.82 times
Airbus
2013 = 50,895M / 25,060M = 2.03 times
Airbus manages inventory more efficiently than Boeing. Boeing efficiency in managing inventory reduced in 2013.
Accounts payable turnover = COGS/ accounts payable
Boeing
2013 = 73.19B / 9.39B = 7.79 times
2012 = 68.56B / 9.39B = 7.30 times
Airbus
2013 = 50,895M / 10,372M = 4.91 times
Accounts payable turnover shows that Airbus is able to delay payments longer than Boeing, which is an advantage in managing the cash account. Boeing’s efficiency reduced in 2013.
Fixed asset turnover = Net sales/ net property, plant, equipment
Boeing
2013 = 86.62B / 10.22B = 8.48 times
2012 = 81.7B / 9.66B = 8.46 times
Airbus
59,256M/ 15,925M = 3.72 times
Boeing utilizes fixed assets more efficiently than Airbus. Boeing efficiency improved between the two years.
Estimating Beta
Filling data into Excel


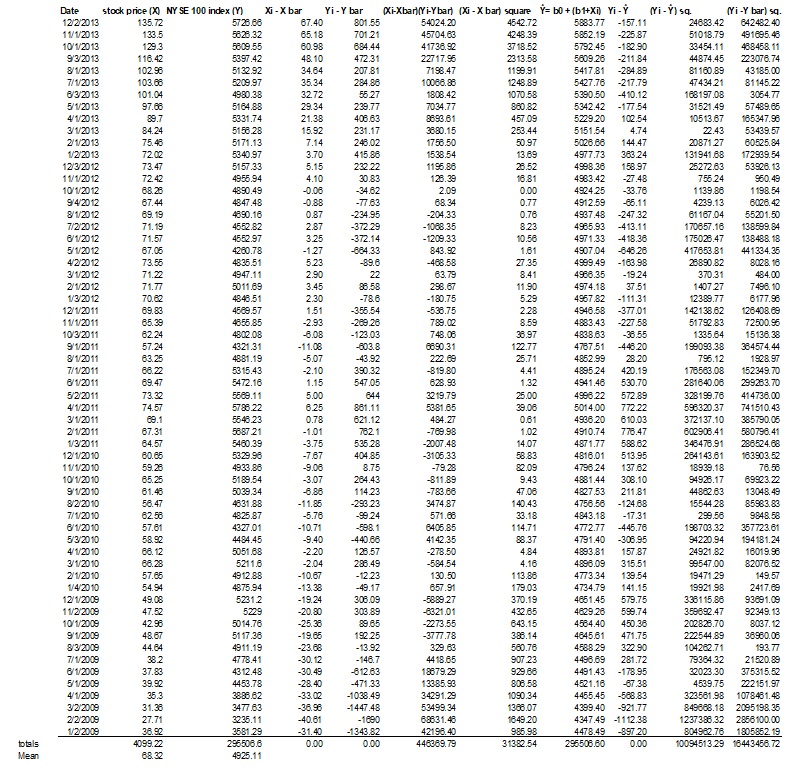
The expression can be expressed as a function of X as shown below.
- 14X = Y – 3953
- X = (Y/14) – (3953/14)
- X = 0.07Y – 282
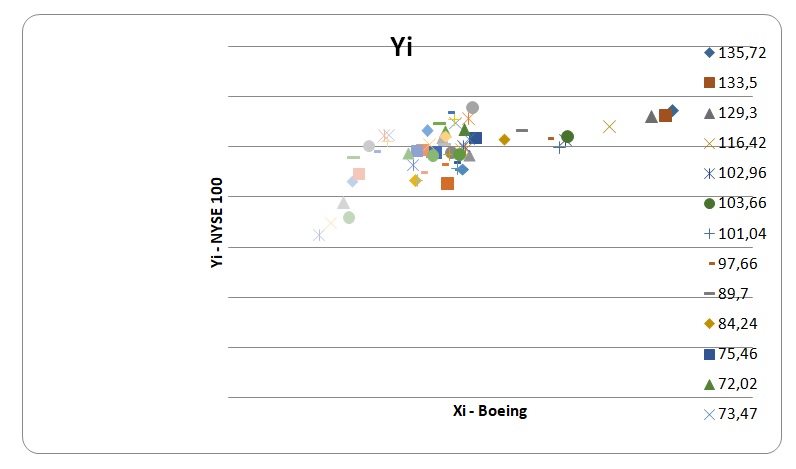
The same equation can be written as X = 0.07Y – 282 since X standards for the values of Boeing stock. It would indicate that 7% of the Boeing stock prices are influenced by shifts in the entire market.
The monthly return of the stock and market index is represented as a change from the previous month.
Estimating beta using regression
The beta can be estimated by finding the slope of the Yi and Xi values. In Excel, it involves selecting ‘SLOPE’ on the formula bar, and then the range of Y and X values. The result is 14.22. It is similar to the value ‘b1’ obtained by the long method. The market indices used are for the NYSE 100. The R-squared, which is 0.39, indicates that more than half the points fall outside the regression line.
Estimating Intrinsic Value of Stock
Boeing paid its shareholders $0.485 as dividends on a quarterly basis in 2013 (“The Boeing Company (BA): Yahoo Finance” table). It adds up to $1.94 for the year. The company paid $0.44 on a quarterly basis in 2012. It paid $0.42 between 2009 and 2012 (“The Boeing Company (BA): Yahoo Finance” table). The current profitability levels indicate the company will maintain the level of growth in dividend issued. It cannot afford rapid growth in dividends because of low profitability. The average dividend growth rate between 2009 and 2013 is 3.9% (((= 0.485 – 0.42) / 0.42)) /4 years). The dividend growth rate in the coming years may grow by a value slightly higher than 3.9% annually because the global economy has recovered. The years 2009 and 2010 were immediately after the global financial crisis (GFC). Low consumption and less profitability followed the GFC. I project an upper limit of a 4.5% dividend growth rate in the coming years because of favorable economic conditions.
Expected return
CAPM
Rf = risk free rate = 8%
Rm = market risk premium
Βi = beta of the stock
Ri = Rf + βi X (Rm – Rf)
Ri = 8% + 14.22 (12% – 8%) = 8.57%
Constant growth dividend valuation model
The price of stock = Dividend in the coming period/ (Discount rate – growth rate)
P0 = Div1/ (R – g)
Div1 = Div0 (1+g)
P0 = $1.94* (1+4.5%) / (8.6% – 4.5%)
P0 = 2.813/ 4.1% = $68.61
Conclusion and Recommendation
Conclusion
The U.S. economic conditions are more favorable than they were a few years ago. There is increased consumption, reduced unemployment rate, and real GDP growth. The producer price index is favorable for manufacturers because it shows a very small change in the cost of raw materials. The profitability of the firm will improve at a slow rate because of the high COGS associated with the industry. Dividends are likely to increase at a higher rate than in the past years. The intrinsic value of the stock is lower than the market price of the stock in Dec 2013 ($68.61 compared with the adjusted close of $135.72). It shows that investors have overestimated the value of its stock.
Recommendation
The investor should sell the stock because the growth opportunities of the firm are low considering its low-profit margins, and low return on assets. There is no need to hold the stock because the returns are lower than the risk-free rate.
Works Cited
Airbus Group N.V. ADS 2014. Web.
Boeing Co. NYSE: BA2014. Web.
FRED 2014, Federal Reserve Economic Data: 212,000 US and international time series from 62 sources. Web.
Select USA 2013, The aerospace industry in the United States. Web.
The Boeing Company (BA): Yahoo Finance 2014. Web.
Thurber, Matt 2011, The major airplane manufacturers at a glance. Web.