Introduction
The present report was commissioned by the Chief Financial Officer of Alaska Air Group to assess the company’s current attractiveness to investors. The report provides a detailed analysis of the company’s financial leverage, the attractiveness of bonds, and trends in stock prices. The report utilizes quantitative methods to make recommendations on how the company can become more attractive for investors.
Financial Leverage
The present section of the report aims at discussing the level of financial leverage of the Alaska Air Group. Financial leverage is assessed using three financial ratios, including the debt-to-assets (debt) ratio, debt-to-equity ratio, and interest coverage (times interest earned) ratio.
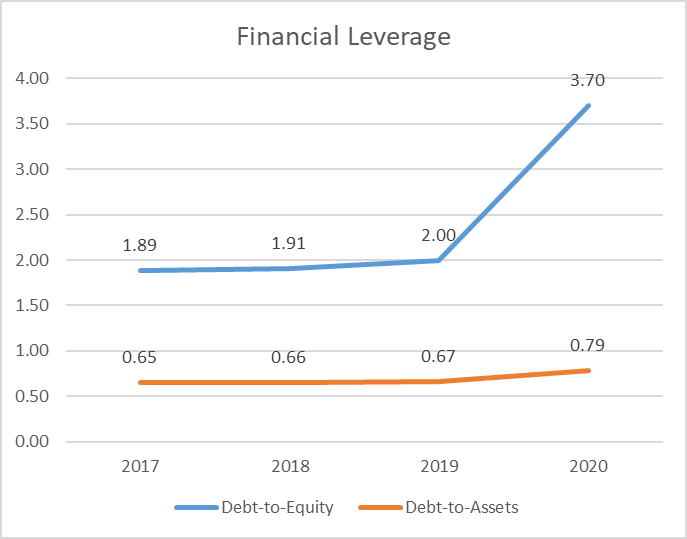
The analysis of Alaska Air Group demonstrated that the level of the company’s financial leverage increased drastically in 2020. There are two primary reasons for such a case of events. First, due to low sales associated with the COVID-19 pandemic, the company was forced to increase its long-term debt to finance its current operations. As a result, the debt-to-assets and debt-to-equity ratios increased drastically in 2020. In particular, the debt-to-equity ratio almost doubled in 2020 in comparison with 2019, while the debt-to-assets ratio increased from 0.67 in 2019 to 0.79 in 2020. The changes in these two ratios are visualized in Figure 1 below.

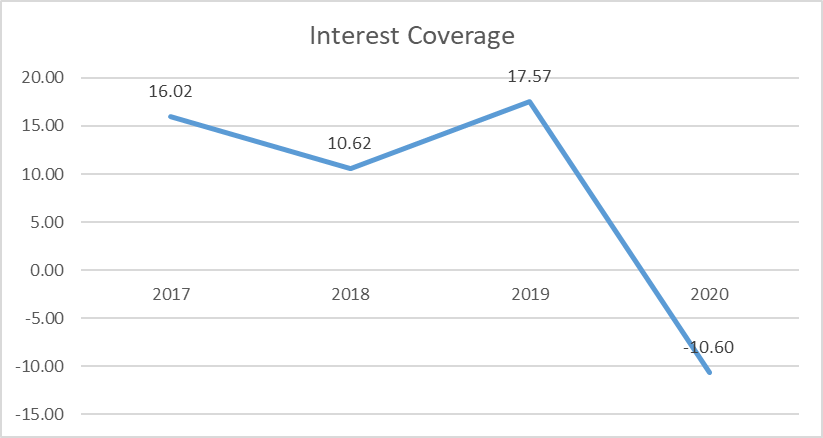
Second, the interest coverage negative became negative due to the decrease in revenues, which caused a significant drop in earnings before interest and tax (EBIT). At the same time, an increase in interest payments increased from $63 million in 2019 to $87 million in 2020. The dynamics of this ratio are provided in Figure 2 below.

In summary, the COVID-19 pandemic had a significant negative impact on the company’s financial leverage. Such an increase can lead to continuing financial distress in the firm, which may lead to decreased interest from investors. Thus, it is crucial to decrease financial leverage to make investments in Alaska Air Group less risky.
Bonds Analysis
The present section provides a comparative analysis of two bonds issued by Alaska Air Group, including ALK5006757 and ALK5005663. In particular, prices, annual coupon interest payments, current yields, and YTMs are analyzed. The recommendations are provided in considering the results of the analysis.
Calculations
ALK5006757 is a bond issued by Alaska Air Group with a maturity date of 15 August 2025. Its last listed price, according to FINRA (2021), was $1115. ALK5005663 is another bond listed by the company with a maturity date of February 15, 2029. The last listed price of the bond was $1103.2.
Assuming that the par value of a bond is $1,000 if an investor decides to purchase ALK5006757 on May 3, 2021, it will need to pay the price of $1115 plus the accrued interest for the period between interest payments. Since the last payment was on February 15, 2021, and the interest rate is 8%, the investor will need to pay:
Assuming that the par value of the bond is $1,000 and the interest rate is 4.8%, the price of ALK5005663 can be calculated the following way:
Assuming that the par value of a bond is $1,000, the annual coupon interest payments can be calculated the following way:
The current yield can be calculated by dividing the annual coupon payment by bond price. The calculations of current yield rates are provided below:
The YTM of ALK5006757 is estimated at 5.058%, and YTM for ALK5005663 is 3.259%.
Analysis and Recommendations
The calculations provided in Section 3.1 of the present report provide valuable insights into the performance of Alaska Air Group’s stocks. The calculations revealed that if an investor would need to decide between buying the two bonds under analysis, it is recommended that ALK5006757 be purchased. This bond outperforms its counterpart in all the characteristics. In particular, its interest rate is higher by 2.72%; the annual coupon payments of ALK5006757 are higher than that of ALK5005663 by 40%; the YTM of ALK5006757 is currently estimated at 5.058%, while YTM for ALK5005663 is lower by 1.8%. Additionally, it should be considered that ALK5005663 is callable, which implies that there is a chance that its YTM will decrease. Thus, even though the investor will need to pay a slightly higher price for the bond; however, the increased price is worth paying.
However, if an investor is to decide to purchase any bond, it is recommended that other company’s stocks are selected. The primary problem is that the Alaska Air Group demonstrates unstable financial performance. In 2020, the company’s total sales fell by 60% in comparison with 2019 due to the COVID-19 pandemic. As a result, the company reported a $1,324 million loss in net income in 2020. Ratio analysis demonstrated that, in 2020, Alaska Air Group experienced a significant decline in profitability, efficiency, and returns on investments. However, these changes were not associated with internal factors. As comparative analysis shows, competitors also experienced similar declines. Alaska Air Group adapted to the environment better than JetBlue. At the same time, the adaptation made by Alaska Air Group’s management was insufficient to prevent losses short-term.
Yahoo Finance (2021) reports that the company’s sales may continue to decrease in 2021 due to the third wave of the pandemic. Further reduction of sales and profitability may lead the company to further inability to pay its investors and creditors short-term. Such poor financial performance may even lead the company to bankruptcy, which implies that the bonds will not be repaid. Thus, it is recommended that investors select another company from a different industry, as all airlines in the US and abroad experience a significant decline in growth.
Stock Performance
The present section aims at evaluating the stock performance of Alaska Air Group. First, market ratios will be compared against the company’s major competitor, JetBlue, and the industry averages. Second, the recent changes in stock prices will be evaluated to make forecasts about its future changes. Conclusions will be drawn from the analysis.
Market Ratio Analysis
The market ratios of Alaska Air Group are provided in Table 1 below.
Table 1. Market ratio analysis (MorningStar, 2021a; 2021b).
The analysis demonstrates that Alaska Air Group’s market performance experienced significant issues. First, it should be noticed that the company’s EPS and P/E ratios were negative due to negative net profits of -$1,223 million (Yahoo, 2021). The P/E ratio and the EPS were not included in Table 1, as the company did not report the current number of shares. However, assuming that the number of shares did not change in 2020 (123,279 thousand), EPS will be -9.92 (Yahoo Finance, 2021). Considering that the share price at the end of the 2020 fiscal year was $52, the P/E ratio was -5.24 (Yahoo Finance, 2021). Assuming that the number of shares did not change for JetBlue Airways Inc., its EPS in 2021 was -4.57, while its P/E ratio was -3.18. This implies that JetBlue was outperforming Alaska Airways in 2020 in terms of the P/E ratio and the EPS ratio, which makes Alaska Air Group less attractive for investors, as its stock is overvalued. In terms of the P/E ratio, Alaska Air Group is bad condition compared to the industry average, which demonstrated that the average P/E ratio for the air transport industry was 8.14 (Damodaran, 2021).
Similar conclusions can be drawn from the analysis of the market to book ratio. In 2020, Alaska Air Group’s performance in terms of the ratio did not change considerably, reaching 1.87. However, this ratio was significantly higher than that of JetBlue Airlines, which was 1.24. This implies that Alaska Air Group’s shares are overvalued more than JetBlue’s shares. Thus, JetBlue is a more attractive stock.
The dividend per share ratio dropped significantly in 2020 in comparison with the previous years. Between 2017 and 2019, the company paid $1.3 per share annually on average. However, in 2020, the ratio fell to as low as 0.38, which is more than a 70% decline. Since JetBlue does not pay out dividends, it is impossible to compare the companies based on this criterion. However, Alaska Air Group’s performance in terms of dividends per share does not add to its stocks’ attractiveness.
Considering all the information presented above, investors do not receive an adequate return on their investment. Therefore, it is not reasonable to buy the stock according to the ratio analysis.
Stock Price Trends
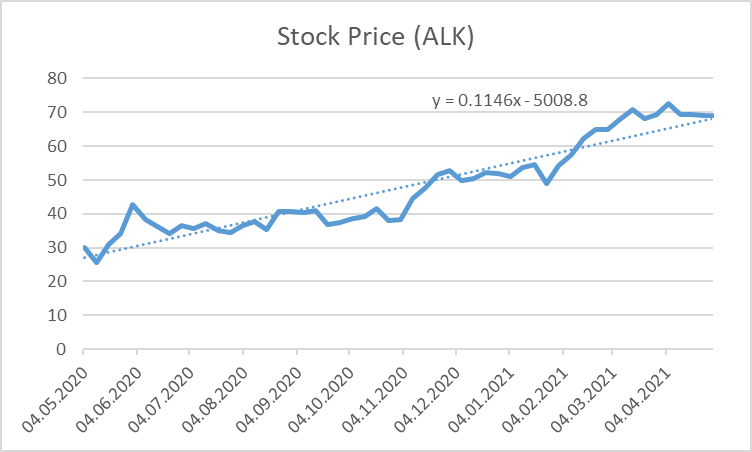
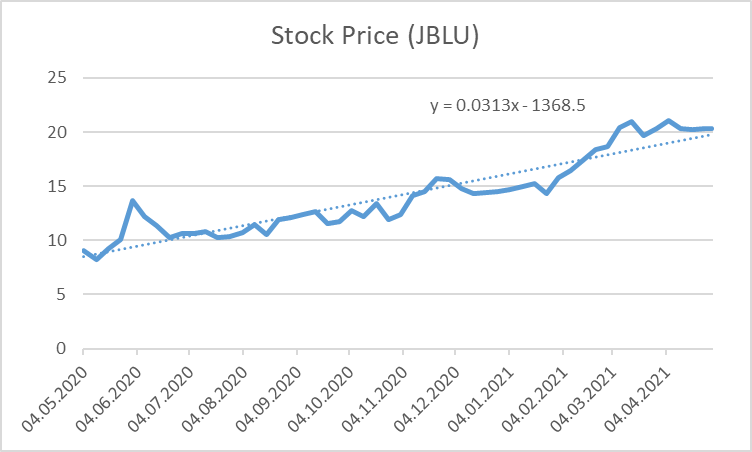
While using financial ratios can be useful to predict the future performance of a stock, it is also useful to analyze the historical prices of stocks. Figures 3 and 4 below visualize the performance of Alaska Air Group and JetBlue, respectively, based on data from Yahoo Finance (2021).


The analysis of historical data of Alaska Air Group’s stock performance demonstrated that the stock price of the company was growing steadily during the past year. In May of 2020, the company’s stock price was as low as $30 per share, while today, it is trending at $69. This implies that the company’s stock price grew by 230% in a year. It is crucial to acknowledge, however, that JetBlue’s stock price was also growing steadily during the past year. Thus, some part of the price growth can be attributed to the overall tendency of the market. However, comparing the regression equations demonstrated in Figures 3 and 4, the growth coefficient for Alaska Air Group was higher than that of JetBlue’s growth. This implies that Alaska Air Group’s stock prices were growing faster during the past year. Thus, trend analysis of stock prices demonstrated that investment in Alaska Air Group is possible due to stock price growth. At the same time, investment in Alaska Air Group is favorable in comparison with JetBlue Airway Inc.
Summary and Recommendations
The analysis provided in the present report demonstrated that Alaska Air Group experiences significant financial problems, which may affect the trust of investors. The decline in sales in 2020 led to the company’s inability to pay for its operations, which caused an increase in financial leverage. Additionally, negative net income caused significant problems with EPS, P/E ratio, and dividend growth ratio. Even though its bonds remain attractive, there is a significant doubt that the company will be able to pay out the debt of bonds when it matures. Additionally, while the stock prices are growing, the rebound may be associated with overall market trends. Thus, the company needs to implement the following recommendations to optimize its performance.
- The primary concern of Alaska Air Group is to increase its sales. Currently, the 59.4% drop in sales in 2020 is the central problem the company needs to solve. Market research needs to be conducted to assess the needs of potential clients, and every effort should be given to fulfilling these needs.
- The company needs to decrease its level of financial leverage to decrease interest expenses. As mentioned in Section 2, the current level of leverage is higher than that of the competitor. The capital can be raised by selling property and equipment, which will improve asset turnover. However, such action may lead to unfavorable outcomes long-term; thus, a risk assessment needs to be conducted.
- The company should aim at gradually increasing its dividend payouts to improve attractiveness for the investors.
Reflection
The present project provided an opportunity to assess the attractiveness of bonds and stocks of a company from different sides. Additionally, the assignment helped to acquire a deeper understanding of financial leverage by analyzing leverage ratios. I learned that analysis of stock performance should be approached from two sides, including assessment of historical data and analysis of market ratios. Moreover, I learned that bonds should not be analyzed without analysis of financial performance, as there is a chance that they will not be paid out. I used Excel for creating charts and graphs that reflected trends in financial performance. I also received experience in formatting formal reports to make them look neat and organized. I am sure I will be able to use all this experience in my workplace, as I often need to look for financial data, make relevant calculations in Excel, and create reports for higher management.
References
Alaska Air Group. (2021). Annual report 2020. Web.
Damodaran, A. (2021). PE ratio by sector. Web.
FINRA. (2021). Bonds center. Web.
MorningStar. (2021a). Alaska Air Group Inc.Web.
MorningStar. (2021b). JetBlue Airlines Inc. Web.
Yahoo Finance. (2021). Alaska Air Group Inc. Web.