Introduction
Walt Disney is one of the largest media and entertainment companies in the world. The company was established over nine decades ago in the US. Currently, the company is listed at the New York Stock Exchange. It also operates in all continents in the world. Walt Disney is organized into five major business segments namely, “media networks, parks/ resorts, studio entertainment, consumer products, and interactive media” (Walt Disney).
Given its financial success, the company’s stock has been one of the most attractive to investors in the last decade. This paper will provide a detailed analysis of the financial performance of the company in the last five years. This will involve using descriptive statistics, as well as, regression analysis to describe the performance of the company. The analysis will focus on three measures namely, stock price, revenue, and earnings-per-share. Based on the outcome of the analysis, recommendations will be made to investors concerning the suitability of investing in the company’s stock.
Trend Analysis
Revenue
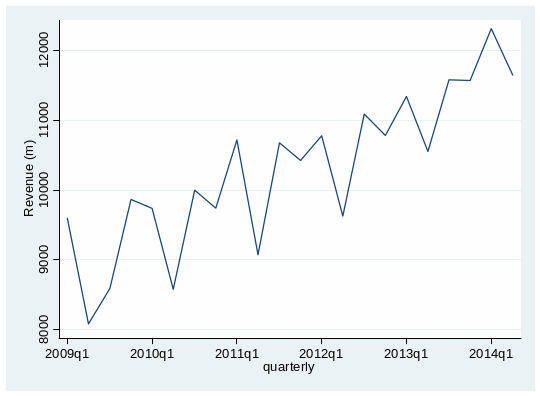
Walt Disney realized an upward trend in quarterly revenues in the last five years. The company’s revenue increased from USD 9,867 million in the last quarter of 2009 to USD 11,568 million in the last quarter of 2013. This represents a 17.24% increase in revenue. In the second quarter of 2014, the company’s revenue declined by 5.4% compared to the first quarter. Overall, the upward trend is statistically valid. This conclusion is supported by the p-value of 0.000 in table 1, which presents the results of the test for the significance of the upward trend in the company’s revenue.

The upward trend is illustrated in figure 1, which shows that the company’s revenue has increased significantly in the last five years. However, the figure shows that the quarterly revenues have been fluctuating. One of the factors that explain the fluctuation is the seasonality of the entertainment industry (Walt Disney). For instance, visits to parks and resorts are often high during summer seasons and low during winter. In this respect, seasonal variations in expenditure among customers affect the company’s quarterly revenues.
Earnings-per-Share
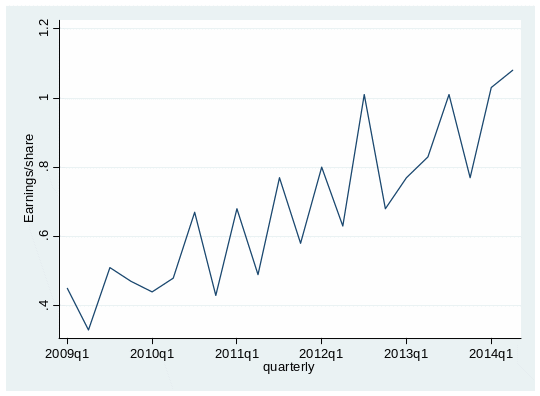
The company’s quarterly earnings-per-share (EPS) exhibits an upward trend. The EPS increased from USD 0.33 per share in the second quarter of 2009 to USD 1.08 per share in the second quarter of 2014. This change represents nearly 300% increase in the amount of the company’s income allocated to each share in the last five years. Indeed, the p-value of 0.0000 in table 2 confirms that the upward trend is statistically significant. The increase in the EPS means that the company’s profitability has consistently improved. It also suggests that Walt Disney has a strong financial position. The EPS normally determines the payment of dividends and changes in future stock prices. In this respect, the steady increase in EPS implies that Walt Disney is a reliable company where investors can expect high returns in future (Jones 128-148). Although the year-on-year EPS has been increasing, figure 2 shows that the quarterly EPS has been fluctuating. The fluctuation can be attributed to the seasonal changes in the company’s revenues, which are likely to affect its quarterly profits.

Stock Price
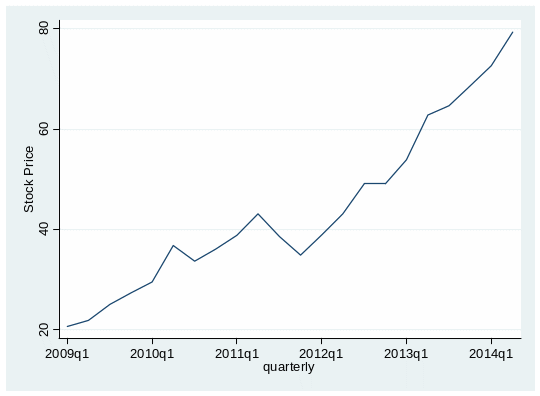
Figure 3 shows that Walt Disney’s stock price has maintained an upward trend. In addition, the upward trend is statistically valid as indicated by the p-value of 0.0000 in table 3. The price of the company’s stock increased from USD 21.9 per share in the second quarter of 2009 to USD 79.34 per share in 2014. This means that holders of the company’s common stock realized a 362.28% capital gain in the last five years. According to figure 3, the company’s share price exhibits little fluctuations despite the significant quarterly changes in revenues and EPS. This suggests that the stock is less volatile and is resilient to unfavorable changes in the company’s fundamentals and the macroeconomic environment (Jones 400-417). Overall, the upward trend indicates that Walt Disney is a growth stock that is likely to realize huge capital gains in future.

The Beta of Walt Disney’s Stock
Beta is a measure of the volatility of an equity security in relation to the stock market as a whole (Jones 368-400). Specifically, it indicates the extent to which the returns on a given equity security are likely to vary in response to swings in the stock market. Thus, investors normally use beta to assess the significance of the systematic risks associated with holding a given stock. Using quarterly closing figures of Dow Jones Industrial Average (DWJA) and the prices of Walt Disney’s listed shares, the stock’s beta was found to be 0.87.
According to the capital asset pricing model (CAPM), the stock market’s beta is always 1. In this respect, a beta of 0.87 means that Walt Disney’s stock is less volatile than the market. Specifically, the stock is at least 13% less volatile compared to the market. This confirms the trend shown in Figure 3, which exhibits little volatility in the company’s stock price.
Theoretically, low risks are associated with low returns. Thus, holders of Walt Disney’s stock are likely to realize low returns. However, investors and financial analysts often use a low discount rate when pricing a stock with a low beta (less than 1). This perspective is based on the fact that holding a stock with a low beta is associated with little systematic risks. The lower the discount rate, the higher the present value of a firm’s expected future cash flows (Jones 246-262). In this context, Walt Disney’s stock is likely to be priced favorably in the future due to its low beta, thereby increasing investors’ earnings.
Descriptive Statistics Analysis
Stock Price
The descriptive statistics for Walt Disney’s stock price are presented in Table 4. In 2009, the company’s stock price had a mean of USD 23.77 per share. The stock price deviated from its mean by only USD 3.05 per share. This deviation implies that the stock price was moderately volatile in 2009. The positive skewness of the stock price means that investors realized frequent small capital losses, which were likely to have been offset by a few high capital gains. The kurtosis of the stock price was less than that of a normal distribution. Thus, the probability of obtaining an extremely high or low stock price in the subsequent years was higher than normal.
Table 4: Stock price.
In 2010, the stock price averaged USD 34.05 per share with a standard deviation of USD 3.29. However, the stock price was negatively skewed and its kurtosis was less than 3. In this case, holders of the stock are likely to have realized frequent small capital gains, as well as, a few high capital losses. In 2011, the mean of the stock price increased to USD 38.87 with a standard deviation of USD 3.36. In addition, the stock price was positively skewed, which indicates reduced volatility in returns. This is confirmed by the fact that the kurtosis of the stock price improved to 1.99.
The mean stock price increased to USD 45.07 in 2012. However, its volatility increased significantly. Specifically, its standard deviation increased to USD 4.99. The frequency of short-term capital losses is likely to have increased due to the negative skewness of the stock price. In addition, the reduction in kurtosis indicates that the variance of the stock price increased. The increase in the mean of the stock price in 2013 was accompanied by high volatility. The standard deviation rose to USD 6.22, whereas the skewness reduced to -0.64. In this case, there was a significant fluctuation in the stock price, which exposed investors to the risk of making losses in the short term. In 2014, the mean of the stock price rose to the highest level of USD 75.98. Moreover, its volatility reduced significantly since the standard deviation declined to USD 4.76. In addition, the skewness of the stock price improved to 0 (normal distribution). However, the low kurtosis suggests that the probability of an extreme price movement in future is high.
Revenue
The descriptive statistics for the company’s quarterly revenue are summarized in Table 5. The mean of the revenue in 2009 was USD 9,037.25 million, with a standard deviation of USD 837.00 million. Clearly, there was a huge fluctuation in the company’s quarterly revenue due to the high standard deviation. The revenue was negatively skewed, which indicates that the company realized frequent small reductions in revenue and occasional large increases in revenue. The likelihood of obtaining an extremely high or low revenue was high since the kurtosis was only 1.29. In 2010, the mean of the revenue increased by nearly half a billion to USD 9,515.75 million. The standard deviation of the revenue reduced to USD 635.90 million, whereas its kurtosis increased to 2.25. This means that the company’s revenue was more stable in 2010 than in 2009. Nonetheless, the distribution of the revenue remained negatively skewed.
Table 5: Revenue.
The company’s quarterly revenue averaged USD 10,223.25 million in 2011. Although the standard deviation increased slightly, the kurtosis improved to 2.25. In this regard, the variation of the quarterly revenue was relatively low. The negative skewness implies that the company is likely to have experienced regular small increases in revenue, which eventually offset large reductions. The mean quarterly revenue improved marginally to USD 10,569.5 million in 2012. However, there was a significant reduction in the volatility of the revenue. Specifically, the standard deviation reduced to USD 643.54 million, whereas the kurtosis remained above 2. In addition, the skewness improved to -0.97, which indicates a slight reduction in the risk of a significant reduction in revenue.
In 2013, the quarterly revenue averaged USD 11,260.25 million. The revenue was less volatile since its standard deviation reduced to USD 483.39 million. The reduced volatility is also confirmed by the kurtosis of 2.18, which is close to that of a normal distribution. Nonetheless, the quarterly revenue remained negatively skewed. In the first two quarters of 2014, the company’s revenue averaged USD 11,979 million. The company also recorded the lowest variation in quarterly revenue in the last five years. Overall, the company’s quarterly revenue improved steadily, whereas its variance gradually reduced.
Earnings-per-Share
The descriptive statistics for the company’s earnings-per-share are reported in Table 6. In 2009, the company’s quarterly EPS averaged USD 0.44. There was little variation in the EPS since its standard deviation was only USD 0.08. The negative skewness of the EPS suggests that investors were exposed to a high risk of realizing reduced returns on their investments. The probability of realizing an extremely high or low EPS was moderate since the kurtosis was only 2.11. The quarterly EPS increased moderately to USD 0.51 in 2010. However, it became more volatile as indicated by its standard deviation, which increased to USD 0.11. The EPS was positively skewed, which indicates that investors were likely to realize improved returns on their investments. The improvement of the kurtosis to 2.22 further suggests that investors were less exposed to extreme fluctuations in EPS.
Table 6: Earnings-per-share.
In 2011, the mean of the EPS and its standard deviation increased moderately. However, the EPS was negatively skewed. In this respect, holders of the company’s stock were exposed to the risk of a significant decline in quarterly EPS. The high volatility of the EPS is further confirmed by the kurtosis, which reduced to 1.6. The increase in the EPS in 2012 was accompanied by a significant increase in volatility. This is demonstrated by the increase in the standard deviation to USD 0.17, as well as, the low kurtosis of 1.85. Nonetheless, the positive skewness indicates that the risk of realizing a very low EPS was little.
The mean of the EPS rose to USD 0.845 in 2013, whereas its standard deviation declined to USD 0.11. This implies that there was a decline in the volatility of the quarterly EPS. The kurtosis of the EPS also improved to 2.15, whereas its skewness remained positive. The improvement implies that the variance of the EPS reduced during the year. In the first two quarters of 2014, the company realized an average EPS of USD 1.05. In addition, the standard deviation declined to USD 0.04. Thus, the company realized the highest and most stable EPS in 2014. Overall, the company’s quarterly EPS has steadily increased despite its volatility.
Statistical Relationship
The correlation matrix (figure 4) shows the pairwise relationship between the measures of the company’s performance. Stock price has the expected strong and positive relationship with revenue. In addition, the relationship is statistically significant at the 5% level of significance or 95% confidence interval. Conceptually, an increase in revenue is an indication of improved financial performance, which often increases the company’s ability to pay dividends (Jones 327-345). Thus, the stock price is expected to increase when the company’s revenue is increasing.
Figure 4: Correlation matrix.
Where * means statistically significant at 95% confidence interval
The stock price also has a strong positive relationship with the earnings-per-share. The relationship is statistically significant at the five percent level of significance. An increase in EPS means that the company’s profitability is improving (Jones 368-391). Thus, financial investors are often interested in the stocks of companies with high EPS so that they can earn high returns. In this respect, the steady increase in Walt Disney’s EPS is likely to have contributed to the increase in its stock price.
The EPS has a strong positive relationship with revenue. Moreover, the relationship is statistically significant. Revenues normally determine the net profits realized by a firm. In particular, an increase in revenue is likely to increase the net income, which in turn increases the EPS. This explains the positive relationship between Walt Disney’s revenue and EPS.
Regression Analysis
Conceptually, the stock price is determined by firm-specific factors such as profitability, revenue, and debt-to-equity ratio. In addition, the stock price is determined by macroeconomic factors such as the level of inflation, gross domestic product (GDP) growth, and interest rate. In this regard, the stock price of Walt Disney can be expressed as a function of both firm-specific and external factors. This relationship can be expressed as a regression equation of the form SP=α+EPS+Rev+GDP+DWJA+ε. In this equation:
- SP – denotes stock price,
- EPS – is the earnings-per-share,
- Rev – denotes revenue,
- GDP – is the US gross domestic product, and
- DWJA – refers to the Dow Jones Industrial Average index.
- α – is the intercept, whereas
- ε – is the error term of the equation.
The results of the regression equation are presented in Table 7. The data for the variables had unit roots in their levels. Consequently, they were used in their first difference to avoid spurious regression. The R-squared of the regression equation is 0.5419. This means that 54.19% of the variation in Walt Disney’s stock price is explained by the variables included in the equation. The stock price had a positive and statistically significant relationship with earnings-per-share. Generally, this relationship shows that an increase in the company’s earnings-per-share will lead to an increase in its stock price. The relationship between the stock price and the Dow Jones Industrial Average is also positive and statistically significant. This finding is not surprising since the stock’s beta of 0.87 is very close that of the market. In addition, Walt Disney is one of the companies whose stocks are included in the Dow Jones index. In this respect, the company’s stock is likely to move in the same direction as the market. Thus, investors can use the Dow Jones index to predict the possible movements in the company’s stock price.
Table 7: Regression results.
The stock price had a positive, but statistically insignificant relationship with the US GDP. The positive sign means that an increase in GDP growth leads to an increase in the company’s stock price. The statistical insignificance of the relationship could be explained by the fact that the company’s financial performance depends on the economic growth in foreign countries where it operates. Surprisingly, the relationship between the company’s stock price and quarterly revenue is negative, but statistically significant. This relationship can be attributed to the impact of negative revenue surprises (Jones 334-336). Specifically, the stock price is likely to decline if the reported increase in revenue is significantly lower than investors’ expectations.
Conclusions
The analyses in the foregoing paragraphs indicate that Walt Disney’s financial performance has improved tremendously. The company’s stock price tripled in the last five years, thereby benefiting investors in terms of high capital gains. The stock price had a standard deviation of less than USD 5 except in 2013 when it rose to USD 6. This shows that the company’s stock price has experienced low volatility. The increase in share price is explained in part by the improvements in the company’s earnings-per-share and revenue. Specifically, the company has consistently reported a steady increase in quarterly and year-on-year revenues. In addition, the variation in quarterly revenue has been declining steadily. In this respect, the company’s earnings are likely to be more stable in future, thereby improving its stock price. The company’s earnings-per-share doubled in the last five years. This indicates that the profitability of Walt Disney has been improving consistently. The strong growth in profitability is expected to increase as the global economy grows and the company improves its competitive position. Overall, the company is financially stable and its growth is backed by strong fundamentals.
Recommendation
Investors should consider buying Walt Disney’s stock due to the following reasons. First, Walt Disney is a growth stock that has a high potential of realizing a significant increase in price in future. The company’s quarterly revenue and earnings-per-share have maintained a statistically valid upward trend in the last five years. This excellent performance is likely to boost the performance of the company’s stock in the medium term. As a result, investors are likely to realize a high return if they purchase the stock. Second, the stock’s beta indicates that it is less volatile. Specifically, the stock is expected to swing less than the market, thereby cushioning investors from the risk of making huge losses in the short-term. Moreover, the stock price has showed very little seasonal variation in the last five years. In this respect, Walt Disney is appropriate for investors who are not ready to take high risks. Third, the regression analysis shows that US GDP growth has no statistically significant effect on the company’s stock price. This means that the stock is resilient to the systematic risks that often affect returns on equity securities. Consequently, investors should buy the stock because it is associated with a high growth potential and a low-risk profile.
Works Cited
Jones, Charles. Investments: Principles and Concepts. New Delhi: John Wiley and Sons, 2010.
Walt Disney. About Us 2014. Web.