Cape Town city, located in Western Cape region, is the capital of South Africa. The city has developed from the historical scars of apartheid and has become a model for urban planning and development. This report studies three aspects of the city –demographic transition, migration pattern, and economic condition in the city.
Demographic Transition
This section provides information regarding the transition in the demographic profile of the population in Cape Town city. The demographic transition will show a trend in change in the demographic profile of the city from 1996 through 2007.
Population
The population of Cape Town according to the Community Survey report was 3,497,097 in 2007. This was an increase of 20.9% from the census data of 2001 and 36.4% since 1996 census (Small 6). The city showed a very high increase in population as compared to the population growth of South Africa, which was by 8.2% between 2001 and 2007.
The population growth in Western Cape was by 16.7% in the same period. Cape Town showed the highest increase in the population growth of the province and it comprised of 80.2% of the population increase of Western Cape (Small 6).
Population by Race
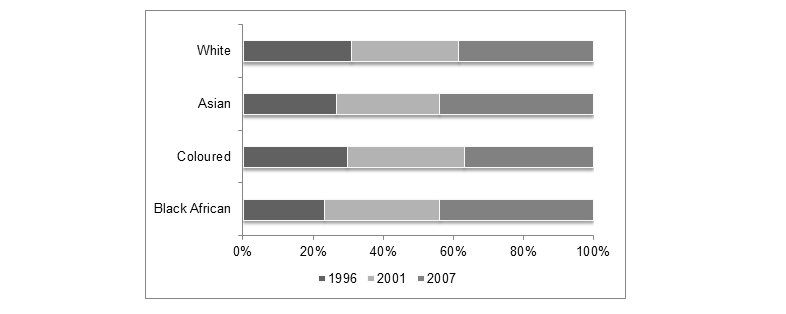
Figure 1 shows that there has been a higher degree in increase in Asian and Black African population than coloured or white population. The growth of Black African population (89.4% since 1996) has been highest in Cape Town. The second highest population growth has been for the Asians (64.6% since 1996).
However, the largest population in the city is coloured population since 1996 through 2007. The population of whites in 2001 declined however, it showed an increase of 24% in 2007.
Table 1: Population Growth based on Race (Small)
Population by Gender
The gender ratio has shown a remarkable transition in the city since 1996. The city had a dominant female population in 1996 that changed from 51.6% of total population to 50% percent of the total population. In 2007, the city has an equal male and female population. The total increase in male population since 1996 through 2007 was 36.6% and that of female population was 28.1%.
The distribution of population based on race and gender in 2007 (see table 1) shows that the component of coloured male and female population was highest (21.3% and 22% respectively) in 2007 followed by Black African male and female population (16.9% and 18% respectively).
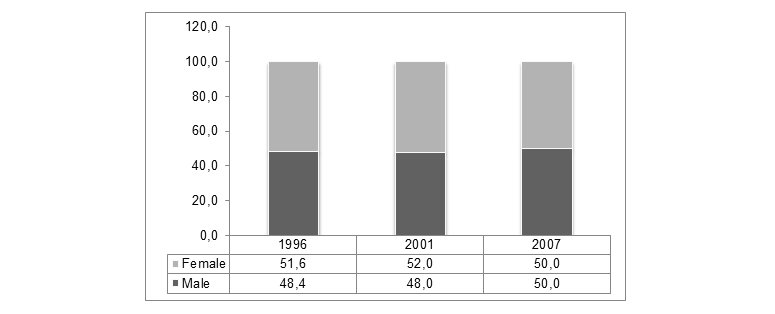
Table 2: Demographic distribution by Age and Colour of Cape Town in 2007 (Small)
Population Age Distribution
Figure 3 demonstrates that the age distribution of the pupation in 2007 based on gender and race shows that the population of the city is young and within the working group. In all the categories, the maximum population is found in the age group of 18 to 64 years, which is the working age group. Therefore, those who are potentially in an economically active group have the highest population in the city.
The population of the young population has been declining since 1996 throguh 2007 and that of the working age group has increased. Further, there is an increase in the 65+ age group indicating that the population is aging.
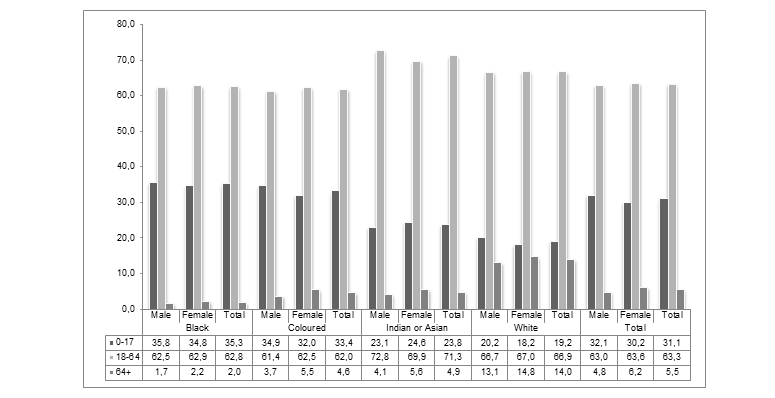
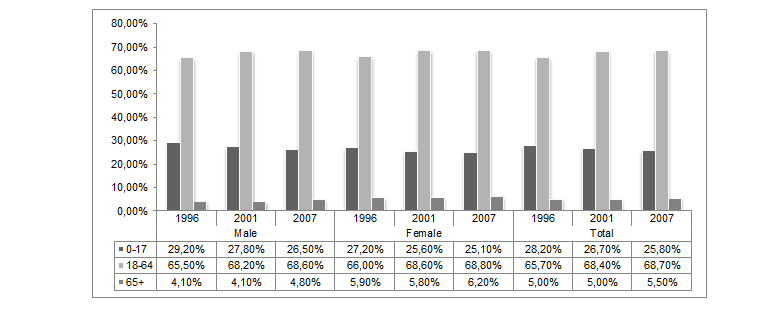
Table 3: Mean Age of population (Small).
The mean age of the population of Cape Town has shown an increasing trend. This demonstrates that over the years the average age of the population is increasing indicating that there are more people belonging to the higher age groups (see figure 4).
The population of Cape Town therefore shows the following trend since 1996 through 2007:
- There is an increase in male population than female.
- The growth of Black African and Asian population in the city is the highest.
- The mean age of the city population is increasing from 28.1 in 1996 to 29.6 years in 2007. Though the overall population is still young.
- The age demographics is shifting from a young population to an older population (figure 4).
Migration Pattern
According to a 2007 report, 68.7% of the total population was born in Western Cape and 19.4% in Eastern Cape (Small 10). Rest of the population was born in Gauteng (3.3%), and rest were born outside South Africa (4%).
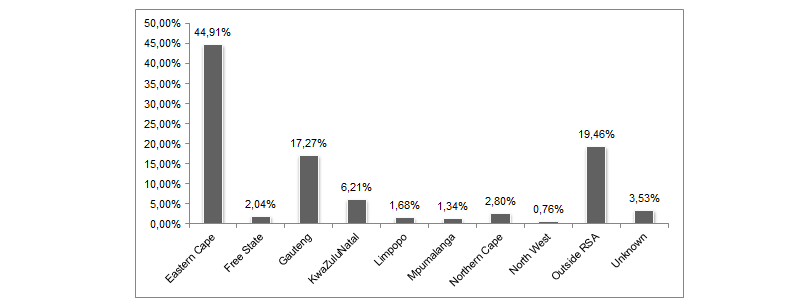
In term of migration, the 2007 report showed that most of the people who migrate to Cape Town are from Eastern Cape comprising of 44.9% of the total migration into the town. The second highest migration is from outside South Africa (19.46%). This demonstrates that there is a high degree of migration from other provinces into the city.
Table 4: Population by country of birth (City of Cape Town).
Table 4 demonstrates that the residents are mostly South Africans by origin. The overall analysis suggests that internal migration, especially rural to urban migration, is high. This demonstrates that there is shift in the population from rural to urban areas. However, international migration in the city is not very high.
There has been a total in-migration of 190,256 people in Cape Town since 2001 from all provinces, excluding Western Cape as well as outside South Africa (Small 12). On dividing the age profile of the migrating population, of this population, it is observed that the highest number of people migrating into Cape Town is in the age group of 20-34 years (37.9%) and 20 to 24 years (14.8%). This indicates that a large part of the migration occurs for working age population, presumably, in search of work.
Economic Outlook
The economy of the city has demonstrated a substantial growth from 2005 through 2009. Real GDP of Cape Town was R188,456 million in 2009 (City of Cape Town). The contribution of the city in the total GDP of Western Cape province is 71.10% and that to the South African economy is 10.58%. This indisputably makes Cape Town the second richest city (City of Cape Town). From 1995 through 2004 the city grew at an annual average rate of 3.7% while the growth rate 4.06% from 2005 through 2009 (City of Cape Town).
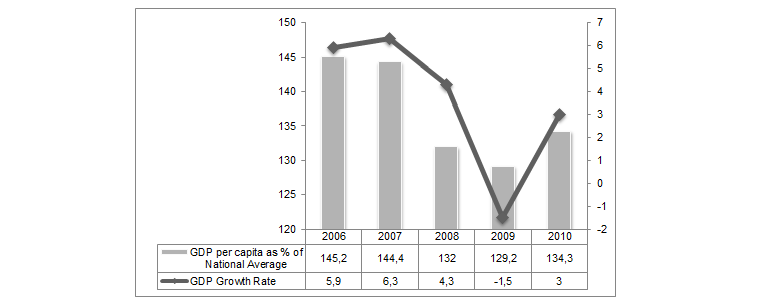
The growth of GDP of the city has been declining, indicating a fall in the GDP (MIS). The city’s growth rate was highest in 2007 at 6.3% after which it declined. The city experienced a negative GDP growth rate in 2009, presumably due to the recession in the world economy. In 2010, there again has been an increase in the growth rate of the economy of the city. Further figure 6 also shows that the GDP per capita of the city is much higher than the GDP per capita if the country. Therefore, the city has a growing economy.
The local economy of the city is distributed into various sectors most predominant of which is manufacturing and services such as financial services and retail, which are the major contributors to the city’s GDP (City of Cape Town; MIS).
Cape Town has a high growth rate, the informal sector is small in the city’s economy comprised of 10.63% of the total economic activity (City of Cape Town). This has a negative consequence to the city’s ability absorb more employment in the sector. This has a negative consequence on the city’s economy and therefore the economy lacks diversity and dynamism (City of Cape Town).
Conclusion
The economy of Cape Town is growing and therefore holds good potential for the economy. The main sectors in the city are manufacturing, financial services and retail. The city has a young population, and the people migrating into the city are also young and belong to the working age. This provides a large pool of working population in the city.
Works Cited
City of Cape Town. “Cape Town’s Economic Environment.” 2011. Economic and Human Development . Web.
MIS. “Cape Town, City of.” 2011. Moody’s Investor Service. Web.
Small, Karen. “Community Survey Analysis for Cape Town.” 2008. City statistics and population census. Web.